Selective removal of isoquinoline and quinoline from simulated fuel using 1,1′-binaphthyl-2,2′-diol (BINOL): crystal structure and evaluation of the adduct electronic properties

Adeniyi S. Ogunlaja*, Eric Hosten, Richard Betz and Zenixole R. Tshentu*
Department of Chemistry, Nelson Mandela Metropolitan University, P.O. Box 77000, Port-Elizabeth 6031, South Africa. E-mail: slaja1@yahoo.com; zenixole.tshentu@nmmu.ac.za; Fax: +27 41 504 4236; Tel: +27 41 504 2074

Received 11th February 2016 , Accepted 12th April 2016

First published on 13th April 2016


Abstract

1,1′-Binaphthyl-2,2′-diol/quinoline (BINOL/QUN) and 1,1′-binaphthyl-2,2′-diol/isoquinoline (BINOL/ISOQUN) adducts were successfully synthesized. X-ray single crystals of BINOL/QUN and BINOL/ISOQUN were grown and analysed. The crystal packing of the molecules in both adducts confirmed that they are held in aggregates by strong hydrogen bonds (O2–H2⋯O3), (O3–H3⋯N1), (O2–H2⋯O1), (O1–H1⋯N1), (O2–H2⋯O1) and weak hydrogen C–H⋯π bonds. The patterns of the hydrogen bonding network as well as the conformation of BINOL contribute to the formation of the shape of the voids that entrap quinoline and isoquinoline. Molecular modelling which was employed to investigate the electronic properties of BINOL/QUN and BINOL/ISOQUN shows that the HOMO positions of the adducts are localized around the 1,1′-binaphthyl-2,2′-diol (BINOL), while the LUMO is positioned on isoquinoline and quinoline. Thermodynamic parameters obtained from isothermal titration calorimetry (ITC) revealed a stronger isoquinoline/BINOL interaction compared to quinoline/BINOL. 6-Vinyl-1,1′-binaphthyl-2,2′-diol was co-polymerized with styrene to form [DBN-co-STY]. Electrospun [DBN-co-STY] exhibited selectivity for quinoline and isoquinoline in a model simulated fuel presenting an adsorption capacity of 2.2 and 2.4 mg g−1 respectively. The adsorption study showed a higher adsorption capacity for isoquinoline compared to quinoline. This may be attributed to the more favourable electronic properties (HOMO–LUMO properties) of isoquinoline. This concept demonstrates the possibility of extracting/separating isoquinoline and quinoline from fuel.

Introduction

1,1′-Binaphthyl-2,2′-diol (BINOL) is considered to be one of the privileged ligands employed in metal-based catalysis and frameworks in asymmetric organocatalysis.1–4 BINOLs are also known to be employed as hydrogen bonding catalysts.5–7 Recent work indicates an interest in the use of racemic 1,1′-binaphthyl-2,2′-diol (BINOL) for the construction of superstructures with guest molecules such as tetra-n-alkylammonium halides, morpholine, dimethylsulfoxide, acetone, tetrahydrofuran, 2,2′-bipyridine and aromatic hydrocarbons.8–12

Owusu et al.,13 investigated a similar aggregation system between tetrabutylammonium bromide (TBAB) and 2,3,6′,7′-tetrahydro-1,1′-binaphthyl-2,2′-diol (BNP) adduct (TBAB/BNP), as well as tetrapentylammonium bromide (TPAB) and BNP adduct (TPAB/BNP). This approach is based on the concept of molecular similarity that is often used for the design of substrates for biological/molecular targets.14 The findings reported by Owusu et al.13 proved that interactions between 1,1′-binaphthyl-2,2′-diol (BINOL) and organic molecules play an important role in separation science and technology due to their aggregation properties.

Selective interaction of molecules can be tailored for use in cleaning of contaminated organic streams via selective adsorption and molecular recognition.15 It has also been demonstrated to be viable for removal of organosulfur compounds in fuel.16,17 Nitrogenated compounds (NCCs) such as carbazole, indole, quinoline, isoquinoline are common in coal-derived liquids, fossil fuels and shale oil, however, their presence is most problematic in synthetic feed stocks and heavier petroleum fractions, where its concentrations are higher due to their prevalence and aromatic stability.18 Nitrogen removal is also required to maintain NOx emissions below regulatory levels as hydrodenitrogenation (HDN) process that is currently being employed for the removal of nitrogenated compounds suffers limitations in achieving the nitrogen content requirement.18 The major deleterious effects of NCCs in fuel are the deactivation of refining catalyst which inhibits deep desulfurization among others.18 Science research in fuel denitrogenation is devoted to removing these nitrogen compounds without altering the fuel specifications.

Complexing agents with more environmentally acceptable properties could open possibilities for effective removal of N-compounds, such as quinoline and its derivatives, from fuel. Herein, we developed a co-polymer, 6-vinyl-1,1′-binaphthyl-2,2′-diol-co-styrene [DBN-co-STY] for the adsorption of quinoline and isoquinoline in model fuel. Isothermal titration calorimetry (ITC) was employed to measure the binding affinity as well as the thermodynamic properties of 1,1′-binaphthyl-2,2′-diol/quinoline and/isoquinoline interactions in solution. Crystal structures of the various adducts were grown and analysed. A comparison of both co-crystals bond lengths and angles with modelled structures is also considered to understand the molecular assembly phenomenon. Electronic properties contributing to the formation of adducts were explained by employing molecular modelling.

Experimental

Materials and methods

2-Napthanol (99%, Merck Chemicals), FeCl3·6H2O (90%, Sigma-Aldrich), bromine (Sigma-Aldrich), ammonia solution (25%, Merck Chemicals), 3,5-di-tert-butylcatechol (Sigma-Aldrich), styrene (Sigma-Aldrich), palladium tetrakis(triphenylphosphine) (Sigma-Aldrich), tributyl(vinyl)tin (Sigma-Aldrich) and benzoyl chloride (Merck Chemicals) were employed for the ligand synthesis. Azobisisobutyronitrile (AIBN) with 99% purity was purchased from Sigma-Aldrich. The initiator, AIBN, was recrystallized using methanol. Nitrogen containing compounds such as quinoline and isoquinoline as well as naphthalene were purchased from Sigma-Aldrich (Germany). Solvents such as absolute ethanol, toluene, dimethylformamide (DMF), tetrahydrofuran (THF) and diethyl ether were obtained from Merck Chemical (South Africa).

Instrumentations

FT-IR spectra (4000–400 cm−1) were run on Bruker, Tensor 27 platinum ATR-FTIR spectrometer. The solid reflectance spectra of the adducts were recorded on a Shimadzu UV-VIS-NIR Spectrophotometer UV-3100 with a MPCF-3100 sample compartment with samples mounted between two quartz discs which fit into a sample holder coated with barium sulfate. The spectra were recorded over the wavelength range of 2000–250 nm, and the scans were conducted at a medium speed using a 20 nm slit width. The 1H NMR spectra of the ligands were recorded on a Bruker 400 MHz spectrometer in CDCl3 and DMSO-d6. Thermogravimetric analysis (TGA and DSC) were performed using Perkin-Elmer TGA 7 thermogravimetric analyser. Typically the samples were heated at a rate of 10 °C min−1 under a constant stream of nitrogen gas. [DBN-co-STY] nanofibers images and chemical characterization were carried out by using TESCAN Vega TS 5136LM scanning electron microscope (SEM) and energy-dispersive spectroscopy (EDS) respectively. Before images were taken for SEM analysis, nanofibers were coated with a thin film of gold to prevent surface charging and also to protect the material surface from thermal damage by the electron beam. No surface coating was needed for EDS analysis. The synthesized ligands were confirmed using an Agilent 7890A gas chromatograph-mass chromatography (GC-MS). Polymer molecular weight distribution was carried-out by using the Waters GPC Instrument connected to (i) Waters 2487 dual wavelength absorbance UV/vis detector equipped with a ultraviolet (UV) detector, and (ii) Waters 2414 differential refractometer (set at 30 °C). The GPC analysis method had the following parameters: columns: two PLgel 5 Mixed-C (300 × 7.5 mm) columns with pre-column (PLgel 5 Guard, 50 × 7.5 mm), column oven temperature: 30 °C, injection volume: 100 μL, eluent: THF, wavelength: 325 and 330 nm, flow rate: 1.0 mL min−1 and calibrant: narrow polystyrene standards ranging from 580 to 2 × 10⁶ g mol−1. Adsorption studies were monitored by employing an Agilent 7890A gas chromatograph fitted with flame ionization detector (GC-FID). GC conditions were optimised to efficiently separate the products from the reactants in the Zebron Phenomenex ZB-5MSi capillary column (30 m × 0.25 mm × 0.25 μm) on the GC-FID/GC-MS. Helium was used as carrier gas at a flow rate of 1.63 mL min−1 with an average velocity of 30.16 cm s−1 and a pressure of 63.73 kPa. The analysis run was started with an oven temperature of 50 °C ramping to 250 °C @ 15 °C min−1.

Isothermal titration calorimetry (ITC)

Isothermal titration calorimetry (ITC) which is based on the detection of the heat released or consumed upon titration of an analyte with (sub)microliter aliquots of a titrant, has become the criterion for label-free affinity measurements and the comprehensive thermodynamic characterization of interactions in solution.19 This technique has found widespread application across many different research fields, particularly in the quantification of host–guest and supramolecular assemblies,20 metal ion21 as well as biomolecular interactions.22–27 The schematic diagram of ITC is presented in Fig. 1, the two lollipop shaped cells are contained within an adiabatic jacket. A small continuous power is applied by the heater on the reference cell. Thermocouple detectors sense temperature differences between the reference and sample cells. The heat per unit time supplied to the sample cell is the observable signal in an ITC experiment and a direct measure of the heat evolved upon binding.28
image file: c6ra03854a-f1.tif
Fig. 1 Schematic diagram of an ITC instrument.

For the purpose of this experiment, high-sensitivity ITC experiments were carried out at 25 °C. Isoquinoline–BINOL titration was performed on a modular titration nanocalorimeter TAM III with an injection volume of 5 μL, a time spacing of 15 min between injections and a stirrer speed of 50 rpm. The quinoline–BINOL titration was performed with an injection volume of 10 μL, a time spacing of 10 min between injections and a stirrer speed of 50 rpm. The reference cell contains water[thin space (1/6-em)]:[thin space (1/6-em)]EtOH (4[thin space (1/6-em)]:[thin space (1/6-em)]1). The ligand (quinoline and isoquinoline)-molecule (BINOL) binding equation is presented below (1) as:

 
M + nL ⇌ MLn (1)
M = molecule (BINOL), L = ligand (quinoline and isoquinoline), n = stoichiometry of interaction.

Computational studies

Density functional theory was employed to explore the electronic properties and vibrational analyses of the adducts. The full geometry optimization of the chemical structures was carried out at the DFT level of theory using Becke's three-parameter hybrid exchange functional in combination with the gradient-corrected correlation functional of Lee, Yang and Parr (B3LYP)29,30 and a basis set 6-311 G using the Gaussian program31 (calculated at 298 K).

Synthesis protocol

Synthesis of 1,1′-binaphthyl-2,2′-diol [BINOL] (I). 1,1′-Binaphthyl-2,2′-diol preparation was adopted from the synthetic route reported by Brussee et al.32 with a few modifications which are noted below. A solution of FeCl3·6H2O (56.0 mmol, 15.14 g) and 2-napthanol (28.0 mmol, 4.03 g) in water (200 mL) was stirred for 1 h at 50 °C (Scheme 1). After cooling to room temperature, the precipitate was filtered, washed with H2O and dried in vacuo. Recrystallization was carried-out in absolute ethanol (40 mL). Yield = 3.80 g, 96.3% of 1,1′-binaphthyl-2,2′-diol. Melting pt = 212–214 °C. FT-IR (cm−1): 3490, 3426 ν(O–H), 3065 ν(C–H aromatic), 1362–1598 ν(C[double bond, length as m-dash]C–C aromatic) (Fig. 1). 1H NMR (400 MHz, DMSO): δ 9.22 (s, 2H), 7.89–7.81 (m, 4H), 7.32 (d, 2H), 7.23 (t, 2H), 7.17 (d, 2H), 6.94 (d, 2H) (Fig. S1).
image file: c6ra03854a-s1.tif
Scheme 1 The synthesis scheme for 6-vinyl-1,1′-binaphthyl-2,2′-diol.
Synthesis of 6-bromo-1,1′-binaphthyl-2,2′-diol (II). In 40 mL of CH2Cl2, 2.10 g (7.34 mmol) of 1,1′-binaphthyl-2,2′-diol was dissolved and the system cooled to −75 °C. Bromine (0.5 mL, 9.8 mmol) was added drop wise over 20–30 min with constant stirring at −75 °C (Scheme 1).33 After stirring for an additional 2.5 h, while warming to room temperature, the excess Br2 was destroyed by addition of 50 mL of 10% aqueous solution of sodium bisulfite. The layers were separated, and the organic layer was washed with saturated NaCl solution and dried. This was further purified on a silica gel column with ethyl acetate and ethanol (ratio 1[thin space (1/6-em)]:[thin space (1/6-em)]1), and it was then concentrated using rotavap to give a dark greenish semi-solid product (2.1 g), 55% yield. FT-IR (cm−1): 3483, 3405 ν(O–H), 3005 ν(C–H aromatic), 1337–1617 ν(C[double bond, length as m-dash]C–C aromatic), ν(C–Br aromatic), 661. 1H NMR (400 MHz, CDCl3): δ 6.90 (d, 2H), 7.10–7.30 (m, 6H), 7.85–7.90 (m, 3H), 8.20 (s, OH, 2H). The molecular mass of 6-bromo-1,1′-binaphthyl-2,2′-diol was also confirmed using a GC-MS (Fig. S2) (m/z = 366 g mol−1). The GC chromatogram of the various products observed in the green product prior to purification is presented in Fig. S3.
Synthesis of 6-bromo-1,1′-binaphthyl-2,2′-diyl dibenzoate (III). 6-Bromo-1,1′-binaphthyl-2,2′-diol (1.33 g, 0.003 mol) was dissolved in 30 mL THF and triethylamine (0.61 g, 0.006 mol) was added followed by benzoyl chloride (0.98 g, 0.007 mol). The mixture was stirred overnight resulting in the formation of precipitate within the solution, and the precipitate was filtered off while the filtrate was concentrated to give a brown sticky liquid which was washed with ethanol to give 1.60 g (82% yield) of 6-bromo-1,1′-binaphthyl-2,2′-diyl dibenzoate (Scheme 1). FT-IR (cm−1): 1732 ν(C[double bond, length as m-dash]O aromatic), 1009–1357 ν(C[double bond, length as m-dash]C–C aromatic), ν(C–Br aromatic), 674. 1H NMR (400 MHz, CDCl3): δ 8.08 (d, 1H), 7.98 (s, 1H), 7.92 (d, 1H), 7.80 (t, 2H), 7.62–7.56 (dd, 4H), 7.49–7.45 (m, 2H), 7.39–7.27 (m, 4H), 7.26–7.07 (m, 6H).
Synthesis of 6-vinyl-1,1′-binaphthyl-2,2′-diyl dibenzoate (IV). To a solution of 6-bromo-1,1′-binaphthyl-2,2′-diyl dibenzoate (1.22 g, 2.24 mmol) dissolved in dichloromethane, palladium tetrakis(triphenylphosphine) (0.052 g, 0.045 mmol), tributyl(vinyl)tin (0.65 mL, 2.24 mmol) and trace amount of 3,5-di-tert-butylcatechol were added (Scheme 1). The resulting mixture was heated to reflux under nitrogen environment for 5 h. Upon cooling, the resulting solution was filtered and then concentrated to give a green viscous liquid. The resulting oil was dissolved into 30 mL acetonitrile and washed with 20 mL hexane. The lower of the two immiscible liquid was run into a beaker, concentrated to give 6-vinyl-1,1′-binaphthyl-2,2′-diyl dibenzoate (1.60 g, 82% yield). FT-IR (cm−1): 1737 ν(C[double bond, length as m-dash]O aromatic), 1024–1263 ν(C[double bond, length as m-dash]C–C aromatic). 1H NMR (400 MHz, CDCl3): δ 8.16 (d, 3H), 7.92 (s, 2H), 7.73 (d, 3H), 7.56–7.62 (m, 5H), 7.51–7.41 (m, 5H), 7.32 (t, 2H), 6.39 (dd, 1H), 6.07 (d, 1H), 5.58 (d, 1H).
Synthesis of 6-vinyl-1,1′-binaphthyl-2,2′-diol (V). 0.45 g of 6-vinyl-1,1′-binaphthyl-2,2′-diyl dibenzoate was dissolved in 10 mL of ethanol. Sodium ethoxide was prepared separately by adding 50 mg of sodium in dry ethanol (50 mL). The sodium ethoxide was then added to the product solution drop wise until the mixture became yellow it was then concentrated and dissolved in 50 mL of 0.20 M NaOH (Scheme 1). The pH was adjusted to 6 by adding 0.1 mol HCl until the solution becomes cloudy, the precipitate was filtered and centrifuged and then washed with ice cold methanol followed by cold diethyl ether giving a pure cream solid (Scheme 1). FT-IR (cm−1): 3566, 3198 ν(O–H), 2988 ν(C–H aromatic), 1024–1263 ν(C[double bond, length as m-dash]C–C aromatic). 1H NMR (400 MHz, CDCl3): δ 7.82 (s, 2H), 7.47–7.33 (m, 5H), 7.08–6.97 (m, 4H), 6.75 (dd, 2H), 5.73 (d, 1H), 5.19 (d, 1H), 4.61 (s, 1H). The 1H NMR of the various products (II–V) and the FT-IR of product (I–V) are overlaid and presented in Fig. S4 and S5 respectively.

Polymerisation of 6-vinyl-1,1′-binaphthyl-2,2′-diol

For the synthesis of [DBN-co-STY] polymer, the 6-vinyl-1,1′-binaphthyl-2,2′-diol [DBN] and styrene [STY] monomers were polymerized by free radicals reaction in toluene using AIBN as a free radical initiator (Scheme 2). 2.012 g of monomer, [DBN], 1.5 mL of styrene and 100 mg (∼5 wt% of the monomer, [DBN]) of initiator were charged in a glass test tube containing 1.5 mL of toluene, which was bubbled with nitrogen gas for 30 min. The test tube was then sealed under nitrogen and placed in a constant temperature (80 °C) oil bath for 48 h. After this period, the reaction mixture was cooled to room temperature, and the polymer was isolated by precipitating the product, [DBN-co-STY], in ethanol (20 times the volume of the reaction mixture) followed by filtration and subsequent drying overnight.
image file: c6ra03854a-s2.tif
Scheme 2 Co-polymerisation of 6-vinyl-1,1′-binaphthyl-2,2′-diol with styrene to form [DBN-co-STY].

Fabrication of [DBN-co-STY] nanofibers by electrospinning

A polymer solution for electrospinning was prepared by dissolving 2.0 g of [DBN-co-STY] polymer in 3 mL of THF[thin space (1/6-em)]:[thin space (1/6-em)]DMF (1[thin space (1/6-em)]:[thin space (1/6-em)]1). The mixture was gently stirred for 4 h at room temperature to obtain a homogeneous solution for electrospinning.

Polymer solutions were respectively poured into a 25 mL syringe attached to a needle connected to the positive electrode of a high voltage power supply (Series EL, Glassman high voltage Inc.). A syringe pump (Model NE-1010, New Era Pump Systems Inc. USA) was used to supply a constant flow of polymer solution from the syringe during the electrospinning process. A voltage of 16 kV was applied to the polymer solution which was pumped at a flow-rate of 0.5 mL h−1, with a distance between the needle tip and aluminium collector plate placed at 17 cm. The repulsive electrical forces between charged nanofibers enable them to spread smoothly and the solvent evaporates resulting in solidification while traveling toward the grounded collector.

Synthesis of 1,1′-binaphthyl-2,2′-diol/quinoline (BINOL/QUN) and 1,1′-binaphthyl-2,2′-diol/isoquinoline (BINOL/ISOQUN) adducts

Similar experimental procedures were followed for the synthesis of BINOL/QUN and BINOL/ISOQUN adducts. To a 15 mL methanolic solution of 1,1′-binaphthyl-2,2′-diol (0.3 g, 0.001 mol), quinoline (0.136 g, 0.001 mol) was added. The mixture was stirred for 30 min, thereafter allowed to stand. After one night suitable brown crystals were collected. The crystals were dried under a nitrogen flow and subjected to single-crystal X-ray diffraction. FT-IR (cm−1): 3490, 3426 ν(O–H), 3065 ν(C–H aromatic), 1362–1598 ν(C[double bond, length as m-dash]C–C aromatic), 1090–1020 ν(C–N). 1H NMR (400 MHz, DMSO): δ 9.19 (s, 2H), 8.92 (s, 1H), 8.37 (s, 1H), 8.01 (d, J = 10.3 Hz, 2H), 7.81 (d, J = 30.3 Hz, 5H), 7.58 (d, J = 32.1 Hz, 2H), 7.42–7.08 (m, 7H), 6.95 (s, 2H).

Results and discussion

Structure determination and refinement of 1,1′-binaphthyl-2,2′-diol/quinoline (BINOL/QUN) and 1,1′-binaphthyl-2,2′-diol/isoquinoline (BINOL/ISOQUN)

Single crystals of 1,1′-binaphthyl-2,2′-diol/quinoline (BINOL/QUN) and 1,1′-binaphthyl-2,2′-diol/isoquinoline (BINOL/ISOQUN) suitable for X-ray analysis were analysed. The molecular structure of BINOL/QUN and BINOL/ISOQUN are presented in Fig. 2 and 3 respectively. Intensity data were collected on a Bruker APEX II CCD diffractometer with graphite monochromated Mo Kα radiation using the APEX 2 data collection software.34 Crystal data and details for the determination of the structures are presented in Table 1. The structure was solved by direct methods applying SHELXS-2013 and refined by least-squares procedures using SHELXL-2013.35 The crystal structure diagrams were drawn with ORTEP-3 for windows.36 Some of the bond distances and angles between atoms within adduct are presented in Table 2. Hydrogen bonding geometries and short contacts (Å, °) for both BINOL/QUN and BINOL/ISOQUN are provided in Table 3. A schematic illustration showing the entrapment of quinoline by BINOL in crystal packing is shown is Fig. 4.
image file: c6ra03854a-f2.tif
Fig. 2 An ORTEP view of the BINOL/QUN with ellipsoids drawn at 50% probability level.

image file: c6ra03854a-f3.tif
Fig. 3 An ORTEP view of the BINOL/ISOQUN with ellipsoids drawn at 50% probability level.
Table 1 Crystal data for the structural determination of BINOL/QUN (I) and BINOL/ISOQUN (II)
  I II
Formula C20H14O2, C9H7N C20H14O2, C9H7N
Formula weight 415.47 415.47
Crystal system Triclinic Triclinic
Space group P[1 with combining macron] (no. 2) P[1 with combining macron] (no. 2)
a, b, c [angstrom] 10.2219(4), 10.7838(4), 11.7729(4) 9.8716(5), 10.7064(5), 12.3284(6)
V3] 1067.88(7) 1052.56(10)
Z 2 2
D (calc) [g mL−1] 1.292 1.311
Mu (MoKα) [mm−1] 0.081 0.082
F(000) 436 436
Crystal size [mm] 0.26 × 0.34 × 0.45 0.34 × 0.54 × 0.54
Temperature (K) 200 200
Radiation [angstrom] MoKα 0.71073 MoKα 0.71073
Theta min.–max. [Deg] 2.2, 28.4 1.9, 28.4
Dataset −13: 13; −14: 14; −15: 15 −13: 13; −14: 14; −16: 16
Tot., uniq. data, R(int) 19[thin space (1/6-em)]180, 5327, 0.016 28[thin space (1/6-em)]615, 5246, 0.016
Observed data [I > 2.0sigma(I)] 4393 4486
Nref, Npar 5327, 291 5246, 291
R, wR2, S 0.0388, 0.1121, 1.04 0.0393, 0.1095, 1.05
Max. and av. shift/error 0.00, 0.00 0.00, 0.00
Min. and max. resd. dens. [e Å−3] −0.20, 0.31 −0.20, 0.34


Table 2 Some bond distances (angstrom) and bond angles (°) of BINOL/QUN and BINOL/ISOQUN (experimental and calculated values)
Bond lengths (Å) Experimental values Calculated values Bond angles [°] Experimental values Calculated values
BINOL/QUN
O1–C2 1.3632(14) 1.3960 O1–C2–C3 120.83(11) 120.37
O2–C12 1.3552(14) 1.3990 O1–C2–C1 118.13(11) 117.79
N1–C21 1.3101(17) 1.3322 O2–C12–C13 121.71(9) 120.13
N1–C29 1.3719(15) 1.3818 O2–C12–C11 117.58(11) 117.92
O1–H1 0.8400 0.9724 C21–N1–C29 118.55(11) 118.31
O2–H2 0.8400 0.9728 N1–C21–C22 123.85(12) 123.50
N1–C29–C24 121.36(11) 121.77
N1–C29–C28 119.04(11) 118.84
[thin space (1/6-em)]
BINOL/ISOQUN
O2–C20 1.3590(12) 1.3975 O2–C20–C29 121.14(9) 120.56
O3–C30 1.3703(16) 1.3760 O2–C20–C21 117.87(9) 118.81
N1–C11 1.3160(19) 1.3307 O3–C30–C31 119.30(10) 120.19
O2–H2 0.8400 0.9723 O3–C30–C39 119.43(11) 118.85
O2–H3 0.8400 0.9721 C11–N1–C19 117.61(11) 118.54
N1–C19 1.363(2) 1.3770 N1–C11–C12 124.21(15) 122.76
  N1–C19–C18 123.28(13) 122.08


Table 3 Hydrogen bonding geometry and short contacts (Å, °) for BINOL/QUN and BINOL/ISOQUN
Hydrogen bonds Bond lengths (Å) Bond angles (°)
BINOL/QUN
O1–H1⋯N1 0.8400 1.8000 2.6317(14) 168.00
O2–H2⋯O1 0.8400 1.9200 2.7580(11) 173.00
[thin space (1/6-em)]
BINOL/ISOQUN
O2–H2⋯O3 0.8400 1.9200 2.7576(11) 172.00
O3–H3⋯N1 0.8400 1.8500 2.6809(14) 169.00
C34–H34⋯O2 0.9500 2.5300 3.4199(19) 156.00


image file: c6ra03854a-f4.tif
Fig. 4 A schematic illustrations showing the entrapment of quinoline by BINOL.

UV studies

Solid reflectance spectra of BINOL and BINOL/QUN were recorded on a Shimadzu UV-VIS-NIR Spectrophotometer UV-3100. Maximum absorption (λmax) of 344, 348 and 356 nm attributed to π–π for BINOL BINOL/QUN and BINOL/ISOQUN respectively was observed (Fig. 5). The observed shift in λmax to a longer wavelength (bathochromic shift) upon formation of BINOL/QUN and BINOL/ISOQUN are due the increase in the conjugation of the system. The energetically favorable π–π excitation occurs from the highest energy bonding pi-orbital (HOMO) to the lowest energy antibonding pi-orbital (LUMO).
image file: c6ra03854a-f5.tif
Fig. 5 Solid reflectance spectra of (I) BINOL, (II) BINOL/QUN and (III) BINOL/ISOQUN.

Stoichiometry of the interaction-isothermal titration calorimetry (ITC)

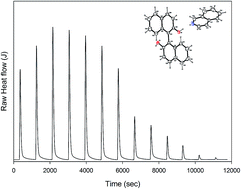
The binding isotherms were carried out using the isothermal titration calorimetry (ITC). The same titration conditions were employed (i.e., concentrations, injection volumes, etc.) for quinoline and isoquinoline titrations with 1,1′-binaphthyl-2,2′-diol (BINOL). The ITC interaction titrations for quinoline vs. 1,1′-binaphthyl-2,2′-diol and isoquinoline vs. 1,1′-binaphthyl-2,2′-diol are presented Fig. 6. The peaks displayed the progress of binding of the analyte (quinoline or isoquinoline) to 1,1′-binaphthyl-2,2′-diol with time. The amount of heat released as interaction progresses decrease, hence confirming a decrease in adsorption capacity (Fig. 6). The stoichiometry of interaction (n), association constant (Ka), free energy (ΔGb), enthalpy (ΔHb) and entropy (ΔSb) is presented in Table 4. For the adsorption process to be spontaneous there must be a decrease in free energy of the system, i.e. ΔGb of the system must have a negative value.
image file: c6ra03854a-f6.tif
Fig. 6 ITC titration involving 1,1′-binaphthyl-2,2′-diol (BINOL) and (A) isoquinoline and (B) quinoline. 9.98 mM (quinoline/isoquinoline) was titrated into 0.998 mM 1,1′-binaphthyl-2,2′-diol (BINOL).
Table 4 Thermodynamic properties, association constant (Ka) and dissociation constant (KD) obtained from isothermal titration calorimetry (ITC)
  Free energy (ΔGb) (kJ mol−1) Stoichiometry of the interaction (n) Enthalpy (ΔHb) (kJ mol−1) Entropy (ΔSb) (kJ mol−1) Association constant (Ka) Dissociation constant (KD)
BINOL/quinoline −16.9 1.322 ± 5 × 10⁻² −5.6 −12 9.2 × 10² 1.08 × 10⁻³
BINOL/isoquinoline −16.3 1.240 ± 4 × 10⁻² −270 ± 68 −835 7.3 × 10² 1.37 × 10⁻³


From the obtained thermodynamic parameters (Table 4), negative free energies were observed for both isoquinoline/BINOL and quinoline/BINOL interactions (Table 4). During the adsorption process, the randomness of the interacting molecules decreases, hence giving rise to negative entropies (−ve ΔSb). Isoquinoline/BINOL presented a higher degree of randomness as compared to the interaction obtained via quinoline/BINOL. Enthalpy (ΔHb) values of −5.6 kJ mol−1 and −270 ± 68 kJ mol−1 was obtained for quinoline/BINOL and isoquinoline/BINOL respectively, and this confirmed a stronger interaction between isoquinoline and BINOL as compared to quinoline and BINOL (Table 4).

Thermal analysis

Thermogravimetry (TG) and differential scanning calorimetry (DSC) were carried out on a PerkinElmer TGA 7 thermogravimetric analyzer. The experiments were performed over a temperature range of 30–350 °C at a constant heating rate of 10 °C min−1, with a purge of dry nitrogen flowing at 30 mL min−1. The TG trace of 1,1′-binaphthyl-2,2′-diol/quinoline (BINOL/QUN) shows a three-step degradation pattern (Fig. 7), a weight loss of 31% equivalent to quinoline occurred between 130 and 198 °C, followed by a further weight loss of 6% attributed to one –OH group of BINOL at a temperature range of 207–252 °C. A rapid collapse/decomposition of the BINOL (60 wt% loss) occurred at a temperature range of 253–327 °C to give a residue. BINOL/QUN desorbs in two distinct steps (Fig. 7), each corresponding to the loss of a single quinoline guest. The DSC shows two accompanying endotherms, one broad (T = 164 °C) for guest melt followed by the host melt at T = 215 °C. The crystallization peak observed at 325 °C confirmed the formation of crystalline residue.
image file: c6ra03854a-f7.tif
Fig. 7 TG and DSC curves for 1,1′-binaphthyl-2,2′-diol/quinoline (BINOL/QUN).

The TG profile of 1,1′-binaphthyl-2,2′-diol/isoquinoline (BINOL/ISOQUN) shows a two-step degradation pattern (Fig. 8), a weight loss of 32% equivalent to isoquinoline occurred between 125 and 180 °C. A rapid decomposition of the BINOL (68 wt% loss) occurred at a temperature range of 181–275 °C. The DSC displayed two complementary endotherms, one broad (T = 180 °C) for guest melt followed by the host melt at T = 220 °C. TG profile of BINOL is provided in Fig. S6.


image file: c6ra03854a-f8.tif
Fig. 8 TG and DSC curves for 1,1′-binaphthyl-2,2′-diol/isoquinoline (BINOL/ISOQUN).

Computational studies

Electronic properties (UV adsorption analysis). The electronic properties of BINOL/QUN and BINOL/ISOQUN were calculated using the TD-DFT approach. The calculations were performed in air as carried out in the experimental studies. TD-DFT calculations predict three transitions in the near ultra-violet region for BINOL, BINOL/QUN and BINOL/ISOQUN with varying intensities and energies. The transitions of BINOL, BINOL/QUN and BINOL/ISOQUN are presented in Table 5. Observed shift to a longer wavelength from BINOL to BINOL/QUN and BINOL/ISOQUN further confirmed an increase in the conjugation of the system. The maximum absorption wavelength corresponds to the electronic transition from the HOMO to LUMO. The calculated excitation energies, oscillator strength (f) and wavelength (k) and spectral assignments are presented in Table 5.
Table 5 UV electronic properties of BINOL/QUN and BINOL/ISOQUNa
BINOL BINOL/QUN BINOL/ISOQUN Assignment
λ (nm) E (eV) (f) λ (nm) E (eV) (f) λ (nm) E (eV) (f)
a λ = wavelength; f = oscillator strength.
317.83 3.9010 0.0330 320.29 3.8710 0.0078 424.51 2.9207 0.0045 π–π
315.97 3.9240 0.0006 316.74 3.9144 0.0048 394.65 3.1416 0.0014 π–π
300.43 4.1268 0.1340 309.14 4.0106 0.0038 333.61 3.7165 0.0015 π–π


HOMO–LUMO and electrostatic potential analysis. The HOMO represents the ability of a molecule to donate an electron and LUMO the electron acceptor ability. The molecular orbitals play an important role in the electric and optical properties of the BINOL/QUN. The plot of the HOMO and LUMO orbitals of BINOL/QUN and BINOL/ISOQUN in MeOH are shown in Fig. 9. From the computational analysis, it was found that the HOMO position of the adduct is localized around the BINOL, while the LUMO is positioned around quinoline and isoquinoline. Electrons are mainly populated on the oxygen atoms of BINOL and the nitrogen atom of quinoline and isoquinoline.
image file: c6ra03854a-f9.tif
Fig. 9 The HOMO and LUMO position of (A) BINOL/QUN and (B) BINOL/ISOQUN.

The energy difference between HOMO and LUMO orbital is called the energy gap, and it indicates the reactivity and stability of structures. The DFT level calculated energy gaps showed that the energy gaps for BINOL, BINOL/QUN and BINOL/ISOQUN are 4.50242 eV, 4.17016 eV and 3.70919 eV respectively. BINOL interaction with quinoline (QUN) and isoquinoline (ISOQUN) caused a decrease in the HOMO–LUMO energy gap.

Attractive and repulsive forces between interacting atoms and molecules of BINOL/QUN and BINOL/ISOQUN occur as a result of their electropositive and electronegative properties, explained through electrostatic potential energies. The electrostatic potentials for BINOL/QUN and BINOL/ISOQUN were color-mapped based on the electron density distribution of the various compounds (Fig. 10). The red end of the spectrum (Fig. 10) shows regions of highest stability for a positive test charge (more favorable to interactions), magenta/blue show the regions of least stability for a positive test charge (less favorable to interactions). The negative characteristic electrostatic potentials, represented in red color, are reactive as they are rich in electrons. For BINOL, negative electrostatic potential are distributed on the two oxygen atoms, while quinoline and isoquinoline has a higher electron density on the nitrogen atom. Adducts (BINOL/QUN and BINOL/ISOQUN) also show evidence of electrostatic potentials on the aromatic planes of both BINOL/QUN and BINOL/ISOQUN which contributed to the π–π interaction between the molecules, hence leading to adduct formation.


image file: c6ra03854a-f10.tif
Fig. 10 Electrostatic potential mapping of (A) BINOL/QUN and (B) BINOL/ISOQUN.
[DBN-co-STY] nanofiber characterization. BINOL was incorporated into polymer and electrospun for benefits of electrospinning. Electrospinning is a workable method for fabrication of polymer fibers with diameters in tens to hundreds of nanometers. It provides polymer fibers with controlled pore size as well as high surface-to-volume ratio, and it decreases adsorption time and mass transfer constraints.37,38 According to the characterization result obtained for the synthesized monomer, 6-vinyl-1,1′-binaphthyl-2,2′-diol, the coupling of a vinyl group to one end of 1,1′-binaphthyl-2,2′-diol (V) offers flexibility and free movement of the molecule upon polymerization. Energy Dispersive Spectroscopy (EDS) of [DBN-co-STY] polymer nanofibers confirmed the presence of oxygen, nitrogen and carbon on the nanofibers (Fig. S7). The UV spectra of polymer material [DBN-co-STY] and the resulting polymer nanofibers are presented in the ESI (Fig. S8). Maximum absorption (λmax) of 348 and 345 nm attributed to π–π transition was observed for polymer material [DBN-co-STY] and the resulting polymer nanofibers respectively. This illustrates that the polymer integrity is preserved after electrospinning to form nanofibers. TG profile of [DBN-co-STY] polymer nanofibers is provided in Fig. S9. The 1H-NMR (in DMSO) of [DBN-co-STY] confirmed polymerization via the broadening of peaks (Fig. S10).
Molecular weight and polydispersity analysis. DBN-co-STY presented a weight-average (Mw) and number-average (Mn) molecular weights of 4790 and 2635 g mol−1 respectively. Polydispersity (Đ) index of DBN-co-STY, which is the ratio of the weight-average (Mw) and number-average (Mn) molecular weights, is reported to be 1.82. The high dispersity index confirmed a wide molecular weight distribution.39,40 Fig. S11 and S12 in the ESI shows the graph of molecular weight distribution of DBN-co-STY as a function of time and the distribution plot (dw/d(log[thin space (1/6-em)]Mw) vs. log[thin space (1/6-em)]Mw) respectively.
FT-IR. The FT-IR spectra of 6-vinyl-1,1′-binaphthyl-2,2′-diol and [DBN-co-STY] is provided in Fig. 11. Of importance are the visible –OH, –C–H aromatic (stretching), –C–H aromatic (in-plane bend) and –C–C[double bond, length as m-dash]C aromatic stretch bands at 3337 cm−1, 2918 cm−1 and ∼1440 cm−1 respectively on [DBN-co-STY] after the polymerization of 6-vinyl-1,1′-binaphthyl-2,2′-diol.
image file: c6ra03854a-f11.tif
Fig. 11 FT-IR spectrum of (A) [DBN-co-STY] polymer and (B) 6-vinyl-1,1′-binaphthyl-2,2′-diol.
Scanning electron micrograph (SEM). SEM images of [DBN-co-STY] nanofibers are presented in Fig. 12. The electrospun nanofibers displayed uniform morphology without beads formation. A diameter range of 0.46–2.42 μm was presented by the nanofibers.
image file: c6ra03854a-f12.tif
Fig. 12 Scanning electron microscopy of [DBN-co-STY] polymer nanofibers.
Quinoline and isoquinoline adsorption selectivity in simulated model fuel. The adsorption assay was carried out to evaluate the adsorption capacity and selectivity of quinoline with [DBN-co-STY] nanofibers in a simulated model fuel. Simulated model fuel containing quinoline, isoquinoline, carbazole, 1-benzothiophene, naphthalene and dibenzothiophene (100 ppm each) was employed for adsorption studies under a continuous flow process. 200 mg of [DBN-co-STY] nanofibers was packed unto the tip of a syringe containing 2 mL of simulated fuel (Fig. 13).
image file: c6ra03854a-f13.tif
Fig. 13 A continuous flow set-up employed in this study. [DBN-co-STY] nanofibers are packed into a filter tip compartment, placed in the front of a syringe containing a mixture of quinoline, isoquinoline, carbazole, 1-benzothiophene, naphthalene and dibenzothiophene.

A flow-rate of 1 mL h−1 was employed for the adsorption process. Adsorption capacity, Qe (mg g−1) was calculated from eqn (2). Conditioning of [DBN-co-STY] nanofibers was carried-out by pre-wetting adsorbents with methanol prior to adsorption studies. The final concentration after adsorption was quantified using GC-FID.

 
image file: c6ra03854a-t1.tif(2)
where Co, Ce, W and V are the initial concentration (mg L−1), equilibrium concentration (mg L−1), dry weight of nanofibers (g) and solution volume (L) respectively.

Maximum adsorption concentrations of naphthalene, 1-benzothiophene, dibenzothiophene, carbazole, isoquinoline and quinoline after adsorption were 94.3 ± 6.9 ppm, 97.7 ± 4.9 ppm, 90.1 ± 3.2 ppm, 93.5 ± 4.8 ppm 5.1 ± 3.1 ppm and 11.0 ± 2.8 ppm (Fig. 14). The adsorption capacities, Qe, of quinoline and isoquinoline were 2.2 and 2.4 mg g−1 respectively. Complete desorption of adsorbed quinoline and isoquinoline from [DBN-co-STY] nanofibers was achieved by washing [DBN-co-STY] nanofibers with a mixture of excess warm water/ethanol (1[thin space (1/6-em)]:[thin space (1/6-em)]1).


image file: c6ra03854a-f14.tif
Fig. 14 Adsorption of quinoline and isoquinoline in simulated model fuel.

High selectivity for quinoline and isoquinoline was observed for the simulated model fuel adsorption study. The observation above (Fig. 16) clearly confirmed the binding interaction data obtained from the isothermal titration calorimetry (ITC) between quinoline vs. 1,1′-binaphthyl-2,2′-diol and isoquinoline vs. 1,1′-binaphthyl-2,2′-diol (Fig. 6). Low analyte adsorptions (<10%) observed for carbazole, 1-benzothiophene, naphthalene and dibenzothiophene were attributed to weak π–π aromatic interactions. Further studies on carbazole vs. 1,1′-binaphthyl-2,2′-diol binding interaction titration show mostly identical peaks which reflect only a non-binding process (Fig. S13), hence confirms the reported observation in Fig. 14. Molecular modelling was further explored to understand the electronic properties between BINOL and carbazole.

Computation study on formation carbazole/BINOL adduct. Experimental studies could not confirm the formation of adduct between carbazole and BINOL after 48 h of interaction, as both molecules remained in solution. Herein, we apply computational modelling to understand the electronic properties between BINOL and carbazole. The DFT level calculated HOMO and LUMO positions of the carbazole–BINOL adduct indicated that the HOMO position centers around carbazole, while the LUMO position is located on the BINOL. The calculated energy gap of the adduct gave a relatively small difference when compared to BINOL band gap (4.50242 eV) as the carbazole–BINOL adduct gave a band gap of 4.43083 eV. Hence, confirming the hardness of carbazole in allowing surface interaction as compared to isoquinoline and quinoline which gave a lower gap (Fig. 9). The HOMO–LUMO hardness further illustrate the reasons why interaction may not be favourable, secondly the nitrogen atom on carbazole is readily not available for interaction (electron donation) as it is attached to hydrogen atom (pyrrole nitrogen). Carbazole–BINOL adduct could only be formed via π–π stacking of carbazole and 1,1′-binaphthyl-2,2′-diol (BINOL) which could translate to a weak interaction. The electrostatic potential mapping of carbazole–BINOL adduct presented in Fig. 15 revealed that carbazole is predominantly dominated by the magenta/blue colour which confirmed that it is less favorable to interactions.
image file: c6ra03854a-f15.tif
Fig. 15 Electrostatic potential mapping of carbazole–BINOL adduct.
Binding selectivity coefficient. The selectivity coefficient (k) defined for BINOL–QUN and BINOL–ISOQUN using the polymer, [DBN-co-STY], in the presence of interfering molecules is represented by eqn (3) below. k is inversely related to a competitive affinity binding of molecule of interest competing with interfering molecule on the same binding site on [DBN-co-STY]. The higher the value of k, the better is the adsorption.
 
image file: c6ra03854a-t2.tif(3)
where Kd = Qe/Ce is the distribution coefficient of selected molecules employed for the simulated model fuel between [DBN-co-STY] and the simulated fuel. The binding selectivity coefficient (k) value of isoquinoline w.r.t naphthalene is 318, 1-benzothiophene is 821, dibenzothiophene is 175 and carbazole is 295. While the binding selectivity coefficient (k) value of quinoline w.r.t naphthalene is 135, 1-benzothiophene is 349, dibenzothiophene is 74 and carbazole is 125.
Continuous flow breakthrough adsorption studies. Breakthrough volumes were evaluated, and they represent the evolution of the concentration of a solution as a function of parameters such as contact time between liquid and solid phase, solvent concentration and temperature. 200 mg of [DBN-co-STY] nanofibers were packed into a cylindrical tube attached to the tip of a syringe containing 5 mL of 100 ppm of the respective N-compounds (quinoline and isoquinoline).

The [DBN-co-STY] nanofibers were easily contained in the tube without leaving much space and the packing was tightened by conditioning the material with solvent at 1 mL h−1. Adsorption progressed as respective N-compounds (quinoline and isoquinoline) were pumped through the conditioned adsorbent at a flow-rate of 1 mL h−1. The breakthrough curves of the N-compounds solutions obtained are presented in Fig. 16. From the adsorption curve, a maximum amount of N-compounds, quinoline and isoquinoline were retained after 2 mL (2000 μL) of the solution have been dispensed (Fig. 16). The number of theoretical plates (N), the linear capacity of the column (ns), the capacity factor of the solute (K) and percentage recovery (r) are calculated from eqn (4)–(7)37,41 and presented in Table 6.

 
image file: c6ra03854a-t3.tif(4)
where 2σV = VRVB
 
image file: c6ra03854a-t4.tif(5)
 
ns = VMKCo (6)
 
image file: c6ra03854a-t5.tif(7)
where Vo is the initial volume of the analyte, breakthrough volume (VB), retention volume (VR) and hold-up volume (VM) of the analyte. From Table 6, a higher amount of isoquinoline was recovered after continuous flow compared to quinoline.


image file: c6ra03854a-f16.tif
Fig. 16 Breakthrough curves of (A) quinoline and (B) isoquinoline using DBN-co-STY nanofibers. Co represents the initial concentration and Ce is the eluted concentration.
Table 6 Breakthrough parameters for the adsorption of quinoline and isoquinoline
N-Compounds VB (mL) VR (mL) VM (mL) N K ns r (%)
Quinoline 1.9 3.6 0.16 11.6 21.5 172 69
Isoquinoline 2.2 3.8 0.16 14.3 22.8 182 73


Reusability studies. Reusability studies of [DBN-co-STY] nanofibers were carried out by using the same adsorption study protocol described above. The [DBN-co-STY] nanofibers presented a consistent but slightly variable overall adsorption for the second (94% and 82%) and third (91% and 83%) cycle of usage (Fig. 17) for isoquinoline and quinoline respectively, hence confirming the integrity of the [DBN-co-STY] nanofibers. The initial adsorption (1st cycle) for isoquinoline and quinoline were 95% and 85%, respectively (Fig. 14). Desorption of adsorbed quinoline and isoquinoline from [DBN-co-STY] nanofibers was achieved by washing [DBN-co-STY] nanofibers with a mixture of excess warm water/ethanol (1[thin space (1/6-em)]:[thin space (1/6-em)]1).
image file: c6ra03854a-f17.tif
Fig. 17 Reusability of [DBN-co-STY] nanofibers showing the % adsorption of quinoline and isoquinoline.

Conclusions

1,1′-Binaphthyl-2,2′-diol/quinoline adduct (BINOL/QUN) and 1,1′-binaphthyl-2,2′-diol/isoquinoline adduct (BINOL/ISOQUN) are held by strong hydrogen bonds (O2–H2⋯O3), (O3–H3⋯N1) and (O2–H2⋯O1), (O1–H1⋯N1), (O2–H2⋯O1) respectively. Computationally optimized BINOL/QUN and BINOL/ISOQUN confirmed that interaction between BINOL–quinoline and BINOL–isoquinoline took place through electron transfer and via hydrogen bonding. It was discovered that the HOMO positions of BINOL/QUN and BINOL/ISOQUN are localized around BINOL, while the LUMO is positioned on quinoline and isoquinoline. BINOL was hosted on a polymer which was electrospun into nanofibers. [DBN-co-STY] polymer nanofibers exhibited selectivity for quinoline and isoquinoline in a model simulated fuel with an adsorption capacity of 2.2 and 2.4 mg g−1 respectively. The adsorption study showed a higher selectivity towards isoquinoline as compared to quinoline. A total of 95% and 85% isoquinoline and quinoline was extracted in a model simulated fuel containing a mixture of naphthalene, 1-benzothiophene, dibenzothiophene, carbazole, isoquinoline and quinoline (Fig. 16). The higher selectivity towards isoquinoline as compared to quinoline was attributed to more favourable electronic properties (HOMO–LUMO properties) of isoquinoline. Computational analyses showed that carbazole–BINOL adduct could only be formed via π–π stacking of carbazole and 1,1′-binaphthyl-2,2′-diol (BINOL), and this is understood to be a weak interaction. This concept shows the ease of separating isoquinoline and quinoline from similar compounds in fuel.

Acknowledgements

We are thankful for financial support provided by Sasol (Pty) Ltd. The South African National Research Foundation (NRF) is also acknowledged for funding A. S. Ogunlaja (Green Economy Postdoctoral Scholarship). The authors thank the Center for High Performance Computing (CHPC), Cape Town, South Africa for providing the platform in carrying out the molecular modelling studies on the Gaussian09 software.

References

  1. D. J. Cram and J. M. Cram, Acc. Chem. Res., 1978, 11, 8–14 CrossRef CAS.
  2. T. P. Yoon and E. N. Jacobsen, Science, 2003, 299, 1691–1693 CrossRef CAS PubMed.
  3. T. Akiyama, Chem. Rev., 2007, 107, 5744–5758 CrossRef CAS PubMed.
  4. M. Terada, Chem. Commun., 2008, 4097–4112 RSC.
  5. Y. M. A. Yamada and S. Ikegami, Tetrahedron Lett., 2000, 41, 2165–2169 CrossRef CAS.
  6. G. A. Jeffrey, An Introduction to Hydrogen Bonding, Oxford University Press, Oxford, 1997 Search PubMed.
  7. N. T. McDougal, W. L. Trevellini, S. A. Rodgen, L. T. Kliman and S. E. Schaus, Adv. Synth. Catal., 2004, 346, 1231–1240 CrossRef CAS.
  8. F. Grepioni, S. Gladiali, L. Scaccianoce, P. Ribeiro and D. Braga, New J. Chem., 2001, 25, 690–695 RSC.
  9. L. R. Nassimbeni and H. Su, New J. Chem., 2002, 26, 989–995 RSC.
  10. N. T. McDougal and S. E. J. Schaus, J. Am. Chem. Soc., 2003, 125, 12094–12095 CrossRef CAS PubMed.
  11. F. Toda, M. Senzaki and R. Kuroda, Chem. Commun., 2002, 1788–1789 RSC.
  12. S. G. Telfer and R. Kuroda, Coord. Chem. Rev., 2003, 242, 33–46 CrossRef CAS.
  13. E. M. Owusu and A. L. Thompson, Mol. Cryst. Liq. Cryst. Sci., 2015, 607, 50–59 CrossRef.
  14. G. J. Kemperman, R. de Gelder, F. J. Dommerholt, P. C. Raemakers-Franken, A. J. H. Klunder and B. Zwanenburg, J. Chem. Soc., Perkin Trans., 2000, 2, 1425–1429 RSC.
  15. W. M. Liao, H. T. Shi, X. H. Shi and Y. G. Yin, Dalton Trans., 2014, 43, 15305–15307 RSC.
  16. A. Jorge and S. Le Borgne, Macromolecules, 2004, 37, 2938–2943 CrossRef.
  17. A. S. Ogunlaja, M. J. Coombes, N. Torto and Z. R. Tshentu, React. Funct. Polym., 2014, 81, 61–76 CrossRef CAS.
  18. J. R. Katzer and R. Sivasubramanian, Catal. Rev.: Sci. Eng., 1979, 20, 155–208 CAS.
  19. G. Krainer, J. Broecker, C. Vargas, J. Fanghänel and S. Keller, Anal. Chem., 2012, 84, 10715–10722 CrossRef CAS PubMed.
  20. A. Cooper, M. A. Nutley and P. Camilleri, Anal. Chem., 1998, 70, 5024–5028 CrossRef CAS PubMed.
  21. C. Schönbeck, R. Holm and P. Westh, Anal. Chem., 2012, 84, 2305–2312 CrossRef PubMed.
  22. S. Leavitt and E. Freire, Curr. Opin. Struct. Biol., 2001, 11, 560–566 CrossRef CAS PubMed.
  23. L. N. Wafer, W. W. Streicher, S. A. McCullum and G. I. Makhatadze, Biochemistry, 2012, 51, 7189–7201 CrossRef CAS PubMed.
  24. O. Khakshoor, S. E. Wheeler, K. N. Houk and E. T. Kool, J. Am. Chem. Soc., 2012, 134, 3154–3163 CrossRef CAS PubMed.
  25. X. Wang, E. Matei, A. M. Gronenborn, O. Ramstrom and M. Yan, Anal. Chem., 2012, 84, 4248–4252 CrossRef CAS PubMed.
  26. S. Keller, H. Heerklotz and A. Blume, J. Am. Chem. Soc., 2006, 128, 1279–1286 CrossRef CAS PubMed.
  27. H. Heerklotz, A. D. Tsamaloukas and S. Keller, Nat. Protoc., 2009, 4, 686 CrossRef CAS PubMed.
  28. M. M. Pierce, C. S. Raman and B. T. Nall, Methods, 1999, 19, 213–221 CrossRef CAS PubMed.
  29. A. D. Becke, J. Chem. Phys., 1993, 98, 5648–5652 CrossRef CAS.
  30. C. Lee, W. Yang and R. G. Parr, Phys. Rev. B: Condens. Matter Mater. Phys., 1988, 37, 785–789 CrossRef CAS.
  31. M. J. Frisch, G. W. Trucks, H. B. Schlegel, G. E. Scuseria, M. A. Robb, J. R. Cheeseman, G. Scalmani, V. Barone, B. Mennucci, G. A. Petersson, H. Nakatsuji, M. Caricato, X. Li, H. P. Hratchian, A. F. Izmaylov, J. Bloino, G. Zheng, J. L. Sonnenberg, M. Hada, M. Ehara, K. Toyota, R. Fukuda, J. Hasegawa, M. Ishida, T. Nakajima, Y. Honda, O. Kitao, H. Nakai, T. Vreven, J. A. Montgomery Jr, J. E. Peralta, F. Ogliaro, M. Bearpark, J. J. Heyd, E. Brothers, K. N. Kudin, V. N. Staroverov, R. Kobayashi, J. Normand, K. Raghavachari, A. Rendell, J. C. Burant, S. S. Iyengar, J. Tomasi, M. Cossi, N. Rega, J. M. Millam, M. Klene, J. E. Knox, J. B. Cross, V. Bakken, C. Adamo, J. Jaramillo, R. Gomperts, R. E. Stratmann, O. Yazyev, A. J. Austin, R. Cammi, C. Pomelli, J. W. Ochterski, R. L. Martin, K. Morokuma, V. G. Zakrzewski, G. A. Voth, P. Salvador, J. J. Dannenberg, S. Dapprich, A. D. Daniels, Ö. Farkas, J. B. Foresman, J. V. Ortiz, J. Cioslowski and D. J. Fox, Gaussian, Inc, Wallingford CT, 2009.
  32. J. Brussee and A. C. A. Jansen, Tetrahedron Lett., 1983, 24, 3261–3262 CrossRef CAS.
  33. G. Dotsevi, Y. Sogah and D. J. Cram, J. Am. Chem. Soc., 1979, 101, 3035–3042 CrossRef.
  34. Bruker, APEX2.Version 1-0, Bruker AXS Inc, Madison, Wisconsin, USA, 2009 Search PubMed.
  35. G. M. Sheldrick, Acta Crystallogr., Sect. A: Found. Crystallogr., 2008, 64, 112–122 CrossRef CAS PubMed.
  36. L. J. Farrugia, J. Appl. Crystallogr., 2012, 45, 849–854 CrossRef CAS.
  37. A. S. Ogunlaja, C. du Sautoy, T. Nelson and Z. R. Tshentu, Talanta, 2014, 126, 61–72 CrossRef CAS PubMed.
  38. A. Greiner and J. H. Wendorff, Angew. Chem., Int. Ed., 2007, 46, 5670–5703 CrossRef CAS PubMed.
  39. D. T. Gentekos, L. N. Dupuis and B. P. Fors, J. Am. Chem. Soc., 2016, 138, 1848–1851 CrossRef CAS PubMed.
  40. D. Nichetti and I. Manas-Zloczower, Polym. Eng. Sci., 1999, 39, 887–895 CAS.
  41. A. Gelencser, G. Kiss, Z. Krivacsy and Z. Varga-Puchony, J. Chromatogr. A, 1995, 693, 217–225 CrossRef CAS.

Footnote

Electronic supplementary information (ESI) available. CCDC 1417759 and 1450690 for 1,1′-binaphthyl-2,2′-diol/quinoline (BINOL/QUN) and 1,1′-binaphthyl-2,2′-diol/isoquinoline (BINOL/ISOQUN) adduct. For ESI and crystallographic data in CIF or other electronic format see DOI: 10.1039/c6ra03854a

This journal is © The Royal Society of Chemistry 2016
Click here to see how this site uses Cookies. View our privacy policy here.