
Cetyltrimethylammonium bromide (CTAB) promote amyloid fibril formation in carbohydrate binding protein (concanavalin A) at physiological pH
Javed Masood Khan*a,
Mohd Shahnawaz Khanb,
Mohd Sajid Ali c,
Nasser Abdulatif Al-Shabiba and
Rizwan Hasan Khand
c,
Nasser Abdulatif Al-Shabiba and
Rizwan Hasan Khand
aDepartment of Food Science and Nutrition, Faculty of Food and Agricultural Sciences, King Saud University, 2460 Riyadh 11451, Saudi Arabia. E-mail: javedjmk@gmail.com; javedjmk@ksu.edu.sa
bProtein Research Chair, Department of Biochemistry, College of Science, King Saud University, Riyadh, Saudi Arabia
cDepartment of Chemistry, King Saud University, PO Box-2455, Riyadh 11451, Saudi Arabia
dInterdisciplinary Biotechnology Unit, Aligarh Muslim University, Aligarh, India
First published on 7th April 2016
Abstract
Amyloid fibril formation has been seen as the underlying reason for various pathological disorders studied in humans. Understanding the mechanism of amyloid fibril formation is important to prevent the onset or to develop a possible cure. In this study, we have experienced to understand the role of positively charged head and hydrophobic tail of cationic surfactant and its propensity to stimulate amyloid fibril formation in concanavalin A. Several spectroscopic techniques (far-UV CD, FTIR, Rayleigh scattering, turbidity, intrinsic fluorescence, and dye binding assays) in addition to transmission electron microscopy were employed to analyze the mode of interaction between ConA and cetyltrimethylammonium bromide (CTAB) during amyloid fibril formation. We have found that negatively charged ConA at pH 7.4, transforms into amyloid fibril in response to significantly low concentrations of CTAB while higher concentrations abolishes the amyloid fibril formation. Interestingly, ConA at pH 3.5 did not form amyloid fibril at varying concentrations of CTAB. A characteristically unique type of secondary structural transition was seen under the varying concentrations of CTAB. At low CTAB concentrations far-UV CD spectrum minimum shifts towards higher wavelength (222–225 nm) whereas at higher concentrations the β-sheet transformed into α-helical structures which is also evident from FTIR measurements. These results suggest that electrostatics as well as hydrophobic interaction are involved in the CTAB induced amyloid fibril formation. This study opens up the possibilities to understand the molecular mechanism of the interaction between CTAB and ConA and also helps to make a molecule which can inhibit or suppress the amyloid fibrillogenesis.
Introduction
Amyloid fibril formation creates a big challenge in structural biology today. Amyloid biology attracts much attention these days for being directly involved in several pathological disorders. Almost 25 different types of amyloid linked disorders have been reported such as Alzheimer's, Parkinson's, Creutzfeldt–Jakob, Huntington's disease, dialysis-related amyloidosis, diabetes mellitus type 2 and cerebral amyloid angiopathy.1,2 Amyloid fibril formation is protein misfolding phenomena in which soluble proteins accumulate in the tissues and form fibril.3 All amyloid fibrils exhibits common secondary structural features (cross β-sheet), fibrillar morphology, show biorefrenges upon binding with Congo red and are nearly insoluble in solvents.4,5 Amyloid fibrils are thermodynamically more stable than any other oligomer structures and have a technical limitation to characterize the reverse process. Piccirilli et al. 2012, has employed a new technique of high pressure FTIR to investigate the disintegration of the mature amyloid structures and to develop ways to overcome the technical obstacles.6 Morphologically, amyloid fibrils are thread-like structures, few nanometers in diameters and in length may vary from nanometer to micrometer.7 Generally, amyloid fibril formation process proceeds through nucleus-dependent mode, and subsequently, it follows by rapid extension course and generates the mature fiber architecture under in vitro condition.8 It has also been reported that sometime fibrillation process proceeds through nucleus independent manner and this kind of fibril formation requires ligand for initiation. These ligands could be either small molecules or exogenously added chemicals or physiological or pathological intra/extra-cellular components.9 Many proteins and peptides are now known to form amyloid fibril under in vitro conditions while these proteins and peptides are not involved in any type of amyloid disorders.10 Partially unfolded conformational state of proteins and peptides are more prone to form amyloid fibril as compared to well fold conformation.11–13 The proteins become partially unfolded under certain in vitro conditions, i.e. change in pH, rise in temperature, pressure, various denaturants and unfavorable solvent conditions.14,15 These in vitro conditions directed to protein chains to form amyloid fibril formation with the help of inter-chain hydrogen bonding, hydrophobic and electrostatic interactions.16–18The surfactant–protein interaction has found huge interest for many years because its application in the range of industrial, biological, pharmaceutical and food processing system.19,20 Many groups are involved in understanding the mechanism of amyloid fibril formation between protein surfactant interaction.21,22 Recently, the effect of non-ionic, cationic, anionic and zwitterionic surfactants were seen on the lysozyme fibrillation.23 Ionic surfactants are mimicking some characters of lipid of biological membranes. It is vastly reported that lipids are having strong property to promote amyloid fibril formation in both amyloid and non-amyloid origin proteins.24–26 Sodium dodecyl sulfate (SDS) is a well known anionic surfactant which promote amyloid fibril formation in a protein.27 Very low concentrations (below CMC) of SDS accelerate the amyloid fibril formation in alpha-synuclein and lysozyme similarly at higher concentration stabilized the helical conformations.28 Recently, we have reported that SDS-induced amyloid fibril formation in almost 25 diverse classes of mesophilic proteins and deciphered the mechanism of SDS–protein interaction during the process of amyloid fibril formation.29 It was found that all proteins formed amyloid in the presence of small amounts of SDS at pH two units below the isoelectric point (pI). We have concluded that electrostatics as well as hydrophobic interaction are involved in the SDS-induced amyloid fibril formation, but electrostatics interaction is more dominant.29 Conversely, CTAB is known to interact with proteins via nonelectrostatic interaction. Nevertheless, depending on the pH of the solution, it can interact electrostatically also.30 CTAB is an amphipathic surfactant composed of positively charged head and 16 carbon tail and its CMC was reported around 0.2 mM in pH 7.4 buffers.31 Earlier, we have explored the SDS-induced amyloid fibril formation mechanism in great details, but CTAB induced amyloid fibril formation was not explored yet. Here in this study, we have tried to explore the possible binding mechanism of cetyl trimethyl ammonium bromide (CTAB) with concanavalin A (ConA) lectin and also discover the amyloid fibril formation mechanism.
ConA is a carbohydrate binding protein and have a very important biological function. The known biological function of ConA is to agglutinate erythrocytes and kill the cancerous cells.32,33 ConA is a true β-class proteins belonging to legume lectin family and contains four tryptophan residue in one chain shown in Fig. 1. It exists in the tetrameric form at pH 7.4 and at pH below 6.0 found in the diameter form.34 The tetramer is joined by two identical homodimer and each monomer is having one saccharides and two metal (Ca2+ and Mn2+) binding sites.35,36 Each monomer comprised of 12 β-sheet secondary structure and jelly roll motif like tertiary structure.37 Characterization of ConA aggregation mechanism is important because ConA has a similar structural homology to the human serum amyloid protein which is linked to amyloidosis diseases.38
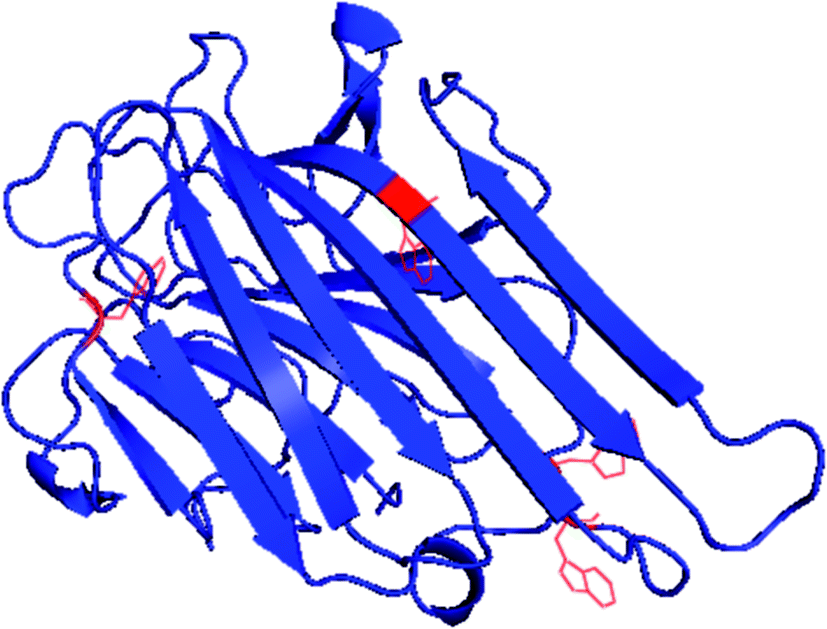 | ||
| Fig. 1 Crystal structure of ConA from jack-bean (PDB) showing position of four tryptophan and 12 β-sheet structures. | ||
ConA aggregation study is already done at in vivo conditions, but without the use of CTAB surfactants. ConA form amyloid like aggregates at high pH (8.9) values and amorphous like aggregates at low pH (5.1) values after incubation at 40 °C.39 ConA is also following non-nucleated amyloid fibril formation pathway at basic pH at 37 °C and amyloid structures of ConA is stabilized by the organization of intermolecular β-structures.40 Succinyl Con, is a dimeric variant of ConA is also reported to form amyloid like aggregates at high pH and high temperature compared to tetrameric ConA. Succinyl ConA form amyloid fibril in reasonably longer time of incubation and minor exposure of hydrophobic clusters at basic pH and high temperatures.41 As Carrotta et al. in 2012 has also investigated the inhibition process of amyloid fibril formation in ConA protein. They have claimed that α-casein is strongly blocked the intermolecular hydrophobic patches to devoid of clusters condensation of bigger size aggregates. α-Casein is highly effective in the second steps of amyloid fibril formation pathway in ConA in comparison to the first step of the pathway.42
It is important to investigate the CTAB interaction with glycoproteins at tetrameric as well as diameric conditions. Therefore, the conformational studies of carbohydrate binding protein with cationic surfactant are still interesting to understand the structural properties of the ConA fibril formation.
In this study, we have attempted to address the ConA–CTAB interaction and tried to investigate the mechanism of ConA aggregation. This is the first reports about ConA and CTAB interaction and amyloid fibril formation. For this study, we have used various spectroscopic as well as microscopic techniques to explore the CTAB induced amyloid fibril formation. It is important to investigate the molecular mechanisms of protein aggregation for the purpose to design the potent inhibitors against amyloid aggregates.
Materials and methods
Materials
Concanavalin A (ConA), thioflavinT (ThT), cetyl trimethyl ammonium bromide (CTAB), Tris–HCl and 8-anilino-1-naphthalene-sulfonate (ANS) were purchased from Sigma Chemicals Co. (St. Louis, MO, USA). All other chemicals were used to analytical grade. Milli-Q water was used throughout the study.Methods
![[thin space (1/6-em)]](https://www.rsc.org/images/entities/char_2009.gif) 000 M−1 cm−1. The ConA was mixed with and without CTAB (0.00–3.5 mM) in a 20 mM Tris–HCl buffer pH 7.4 and incubated for 12 h. After 12 h, 5 μM of ThT was added in every sample and again incubated for 30 min in the dark. All the measurements were done in the 20 mM Tris–HCl buffer pH 7.4.000 magnifications.
000 M−1 cm−1. The ConA was mixed with and without CTAB (0.00–3.5 mM) in a 20 mM Tris–HCl buffer pH 7.4 and incubated for 12 h. After 12 h, 5 μM of ThT was added in every sample and again incubated for 30 min in the dark. All the measurements were done in the 20 mM Tris–HCl buffer pH 7.4.000 magnifications.The ANS binding of ConA in the presence and absence of CTAB was investigated after excitation at 380 nm and emission spectra were recorded in the range of 400 to 600 nm. The ConA concentrations were fixed 0.2 mg ml−1 in both intrinsic as well as extrinsic fluorescence measurements. The ConA and ANS ratio was also fixed 1:50 in a 20 mM, Tris–HCl buffer at pH 7.4. The excitation and emission slit width were fixed at 5 nm in both intrinsic and extrinsic fluorescence.
Results and discussion
CTAB promote aggregation in ConA at neutral pH
CTAB is a cationic surfactant and very less known to induce aggregation in proteins while counter surfactants i.e. SDS is well known to encourage aggregation in proteins.30,43,44 CTAB is very reactive in terms of unfolding of proteins and works at very low concentration in comparison to anionic surfactants.31 In this work, we have tested the effect of cationic surfactant on ConA proteins and its conformational destabilization. From the results, it was found that ConA form amyloid-like structure in the presence of very low concentrations of CTAB at neutral pH while at acidic pH, CTAB is ineffective. CTAB interact electrostatically to ConA protein at neutral pH leads to aggregation while at acidic pH due to strong electrostatic repulsion CTAB was unable to interact with proteins and no aggregation was taking place at any concentration of CTAB. Similar kind of result was also found when lysozyme, containing a net negative charge at pH 13, and cationic surfactants (CTAB and DTAB) were interacted electrostatically which induced amyloid-like structure of the former. The hydrophilic tails of CTAB and DTAB have also played an important role in the aggregation process because CTAB induced amyloid-like structure in lysozyme at a very low molar ratio as compared to DTAB.45Rayleigh scattering
Rayleigh scattering is one of the best tools to quantitate the amount of soluble and insoluble aggregates in liquid samples. The CTAB induced aggregation was studied in 20 mM Tris–HCl buffer, pH 7.4 after 12 h incubation. The scattering of light at 350 nm was found to be negligible in the absence of CTAB at pH 7.4 while in the presence of 0.0125 to 0.25 mM of CTAB a huge increase in light scattering was noticed. Though, beyond 0.25 mM of CTAB, the scattering of light was decreased and reached to the level of native proteins (Fig. 2A). From the scattering results, it was believed that low concentrations of CTAB promoted aggregation in ConA while at higher concentration aggregation was completely inhibited. The scattering of control samples (which contained ConA and different concentrations of CTAB at pH below two units of pI) shown no scattering. From the obtained results it was confirmed that the positively charged surfactant (CTAB) is interacting with ConA via electrostatic as well as hydrophobic interaction at pH 7.4 because ConA is negatively charged at this pH. Similarly, the CTAB was unable to interact with ConA electrostatically at pH 3.5, because both ConA as well as CTAB posses same charge. The CTAB induced aggregates scatter more light because increase in size due to formation of CTAB–ConA complex compared to ConA alone.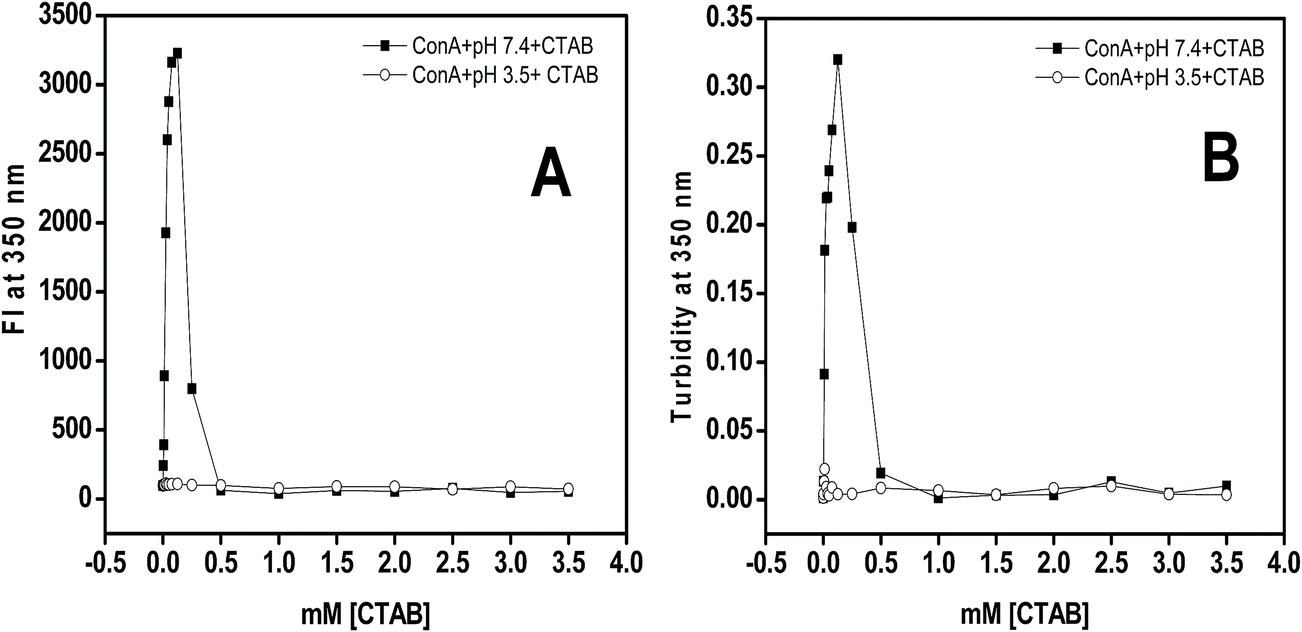 | ||
| Fig. 2 Rayleigh scattering of ConA (0.2 mg ml−1) with and without CTAB monitored as taking emission at 350 nm after excitation at same wavelength. (Panel A) ConA was incubated with different concentrations of CTAB (-■-) at pH two units above the pI (7.4) and ConA with the same concentration of CTAB (-○-) at pH two units below the pI (3.5). (Panel B) Turbidity measurements were performed on the samples containing ConA (0.2 mg ml−1) with and without different concentration of CTAB at pH 7.4 (-■-) and similar measurements were also done when ConA were incubated with different concentration of CTAB at pH 3.5 (-○-) as a control experiment. All the samples incubated overnight prior to measurements at room temperature. | ||
Turbidity
Usually turbidity of samples can be measured in the near UV range typically at 350 nm. It is noticed that the aggregated samples become more turbid and optical density increased with respect to the turbidity of the solution. We have investigated the effect of CTAB on ConA lectin proteins at two different pHs (7.4 and 3.5) by taking optical density at 350 nm. The Fig. 2B depicts the optical density at 350 nm of ConA lectin protein in the presence of CTAB (0 to 3.5 mM) in buffer of pH above and below two units of pI. From the obtained results it was interpreted that the protein samples in the presence of 0.0125 to 0.25 mM of CTAB at pH 7.4 exhibit a significantly increased amount of turbidity while at higher concentration beyond 0.25 mM the turbidity was marvelously decreased and it matched with the turbidity of native samples. At pH 3.5 it was found that the protein samples were not turbid in the whole range (0.0–3.5 mM) of CTAB concentrations. Turbidity results revealed that CTAB has the potential to induce aggregation of ConA lectin proteins when proteins were at pH above two units of pI while below two units of the pI the CTAB was ineffective to do so.From the Rayleigh scattering and turbidity results it was confirmed that the low concentration of CTAB promoted aggregation in ConA proteins at neutral pH. The possible mechanism of aggregation induction by CTAB could be the ConA contains net negative charges when it was incubated at pH two units above the pI i.e. (7.4) because the anionic amino acids are deprotonated and become –COO– while –NH groups are in un-charged. This is the best situation for positively charged surfactant (CTAB) to interact with ConA via electrostatically and facilitate aggregation same as SDS did earlier.25 The head of CTAB interact with negatively charged glutamate and aspartate residues of ConA and neutralize the total net negative charges and simultaneously break all solute–solvent interaction by hydrophobic tail. As a result, ConA become aggregated with the help of solute–solute interactions and devoid of solute–solvent interaction.
ThT dye binding study
From the above two observations, it was confirmed that ConA proteins become aggregated in the presence of very low concentrations of CTAB at pH two units above pI. Therefore, it is needed to confirm whether these aggregated samples were having ordered aggregates or unordered aggregates. For this, we have performed ThT dye binding assay to confirm the structures of the aggregates formed in the present case. ThT, a benzothiazole dye; usually binds and forms a highly fluorescent complex with amyloid and amyloid-like fibrils.45 ThT binds various fibrils such as exposed β-sheet edges, an extended β-sheet surface, as well the laminated “steric zipper” interface between the β-sheets and cross β-sheet architecture.46 The ThT (5 μM) fluorescence spectra of aggregated samples (ConA lectin proteins at pH above two units of pI and 0.025, 0.025, 0.125 of CTAB) and non-aggregated samples (pH above two units of pI alone, ConA at pH 3.5 with and without same concentration of CTAB) were shown in Fig. 3A. A huge increase in ThT fluorescence intensity was noticed in aggregated samples, whereas in non-aggregated samples, the ThT fluorescence intensity was negligible and almost equal to the intensity of protein without CTAB. The ThT dye binding results revealed that ConA form amyloid fibril in the presence of 0.0125 to 0.25 mM of CTAB. However, at higher concentration fibril formation was not taking place. ThT fluorescence results suggest that CTAB induced aggregates have amyloid fibril-like structures when it was incubated with pH two units above the pI.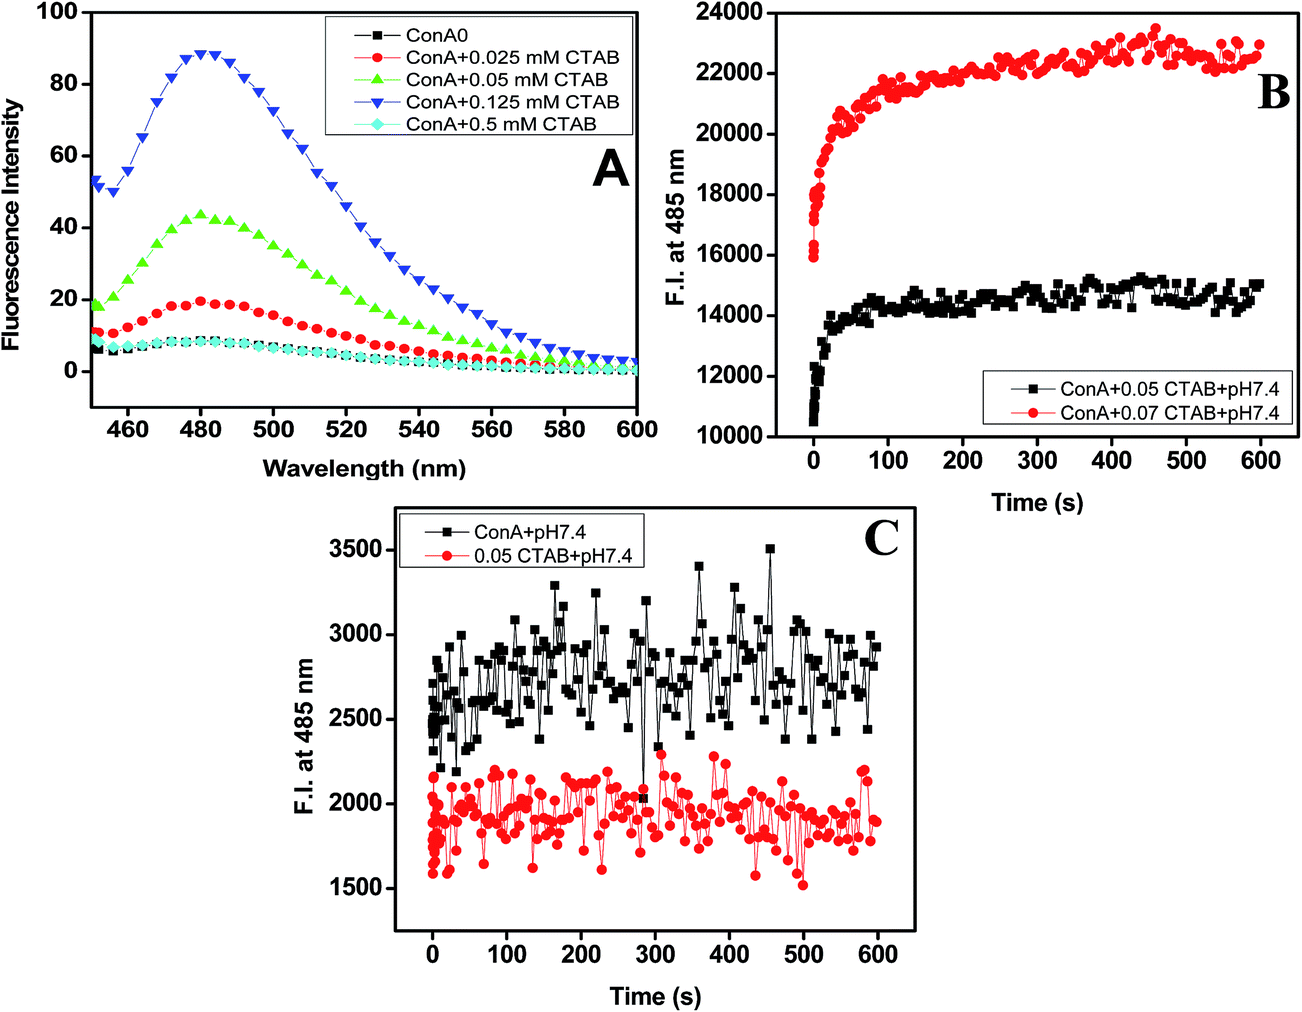 | ||
Fig. 3 ThT (5 μM) fluorescence emission spectra, upon binding to the ConA proteins (0.2 mg ml−1). (Panel A) ConA (0.2 mg ml−1) was incubated with 0 ( ), 0.02 mM ( ), 0.02 mM ( ), 0.05 mM ( ), 0.05 mM ( ), 0.125 mM ( ), 0.125 mM ( ) and 0.5 mM ( ) and 0.5 mM ( ) of CTAB at pH 7.4. Prior to measurements, all samples were incubated overnight with CTAB in 20 mM buffers at pH 7.4. ThT (5 μM) was added in every samples 30 min before measurement, in the dark. Kinetics of CTAB-induced amyloid fibril formation, measured by checking increase in ThT fluorescence intensity with time. (Panel B) The red and black trace shows ThT fluorescence intensity at pH two units above the pI in the presence of 0.05 mM ( ) of CTAB at pH 7.4. Prior to measurements, all samples were incubated overnight with CTAB in 20 mM buffers at pH 7.4. ThT (5 μM) was added in every samples 30 min before measurement, in the dark. Kinetics of CTAB-induced amyloid fibril formation, measured by checking increase in ThT fluorescence intensity with time. (Panel B) The red and black trace shows ThT fluorescence intensity at pH two units above the pI in the presence of 0.05 mM ( ) and 0.07 mM ( ) and 0.07 mM ( ) of CTAB. (Panel C) In a control, the ConA alone and 0.05 mM CTAB without ConA at pH 7.4. ) of CTAB. (Panel C) In a control, the ConA alone and 0.05 mM CTAB without ConA at pH 7.4. | ||
ThT kinetics results
To examine the reactivity of CTAB into amyloid fibril formation processes. We have used the well-known and established ThT kinetics method. ThT kinetics study was routinely used to detect the rate of amyloid fibril formation in proteins.47,48 The Fig. 3B and C have shown the kinetics of amyloid fibril formation in ConA via CTAB at both pH below and above two units of their pI. The ConA was first incubated with ThT and then 0.05, 0.07 mM CTAB was added, followed by fluorescence intensity measurements at 485 nm with time in seconds. The ThT fluorescence intensity starts increasing immediately after mixing and reach saturation within 20 seconds. This result suggests that the CTAB enhanced amyloid fibril formation pathway without the formation of a nucleus. This type of ThT kinetics was also noticed in our previously published work.49 We have found that lysozyme form amyloid in the presence of 0.2 mM of SDS and no lag phase was detected. It means amyloid fibril formation by SDS is not nucleation dependent.49 The similar, ThT kinetics study was also carried out in control samples ((i) ConA without CTAB + ThT and (ii) 0.05 mM CTAB + ThT only) the ThT fluorescence intensity was not changed much throughout the measurements. The ThT kinetics results it is confirmed that CTAB is promoting amyloid fibril formation without the formation of a nucleus. Amyloid fibril formation is nucleation-dependent, but sometimes various intrinsic and extrinsic factors are involved in influencing the length of the lag phase.50,51 The known extrinsic factors are the membrane, salts, surfactants, pH, temperature and proteins can shorten or extended the lag phase of amyloid fibril formation under in vitro condition.52,53 In this study, CTAB is acting as an extrinsic probe to reduce or abolished the lag phase of amyloid fibril formation.Intrinsic fluorescence results
Intrinsic fluorescence measurements give an idea about the position of aromatic amino acid residues, specifically tyrosine (Tyr), tryptophan (Trp) and phenylalanine (Phe). The differences in the fluorescence spectra achieved by exciting the ConA at 295 nm have been pointed to the presence of tryptophan residues. The fluorescence intensity and the wavelength maximum are sensitive to protein conformation, these two factors are very important to probing protein folding and/or unfolding and aggregation processes.54 The fluorescence spectra of ConA without CTAB and in the presence of increasing concentrations of CTAB recorded after the excitation wavelength of 295 nm are shown in Fig. 4A and B. ConA displays a strong fluorescence emission peak at 340 nm without CTAB at pH 7.4 which is similar to published work.55 The fluorescence intensity drops after adding very low CTAB (0.025, 0.025, 0.125 mM) concentration and being escorted by a blue shift of the maximum emission wavelength from 340 nm to 333 nm while in the presence of higher concentration of CTAB, both fluorescence intensity and wavelength maximum were increased and wavelength maximum were reached to wavelength maximum of native proteins. The observed changes suggest the movement of the Trp residues to a more hydrophobic environment that can be attributed to internalization of the fluorophore towards the protein hydrophobic core due to protein aggregation.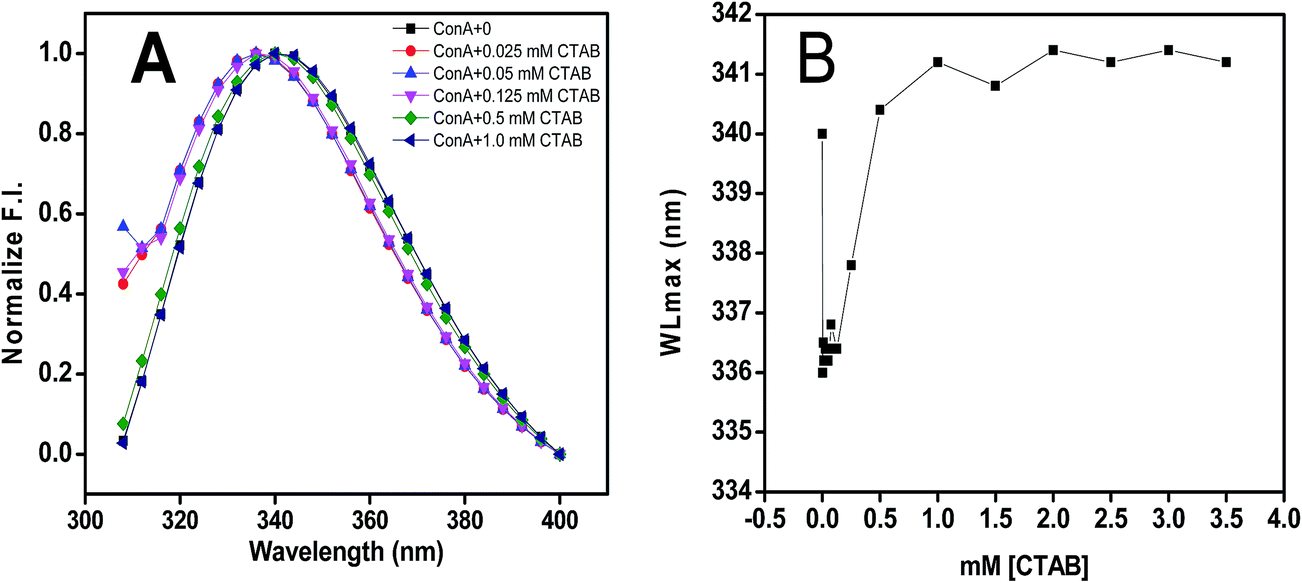 | ||
Fig. 4 The effect of CTAB on the tertiary structural conformation of ConA was measured by intrinsic fluorescence spectroscopy. (Panel A) Intrinsic fluorescence spectra of ConA at pH 7.4 without CTAB ( ), with 0.025 mM ( ), with 0.025 mM ( ), 0.05 mM ( ), 0.05 mM ( ), 0.125 mM ( ), 0.125 mM ( ), 0.5 mM ( ), 0.5 mM ( ) and 1.0 mM ( ) and 1.0 mM ( ) of CTAB concentration. (Panel B) Change in intrinsic fluorescence maxima is plotted with respect to CTAB in mM at pH 7.4. Prior to measurements all the samples were incubated overnight at pH 7.4 in 20 mM phosphate buffers. ) of CTAB concentration. (Panel B) Change in intrinsic fluorescence maxima is plotted with respect to CTAB in mM at pH 7.4. Prior to measurements all the samples were incubated overnight at pH 7.4 in 20 mM phosphate buffers. | ||
Extrinsic fluorescence
ANS is one of the excellent and highly exploited extrinsic fluorophore to check the exposure of hydrophobic patches of protein and tell us the organization of tertiary structures. ANS is also used to examine the exposure of hydrophobic patches during protein unfolding and aggregation. Generally, ANS interacted to the solvent exposed hydrophobic patches on protein, the fluorescence intensity increases with the blue shift of the wavelength maximum. ANS is also used to detect the amyloid structures of proteins.56 The extrinsic fluorescence spectra of ConA without CTAB shown insignificant binding while in the presence of 0.012 to 0.5 mM of CTAB continuous increase in fluorescence intensity with blue shift in wavelength maximum, shown in Fig. 5A and B. This kind of spectral change was noticed when proteins become partially unfolded or aggregated. ANS results have also confirmed that CTAB is having a strong propensity to encourage ConA to form amyloid fibril formation. To overrule the interaction between ANS and CTAB, we performed the same measurements on samples containing CTAB and ANS only as a control and we did not notice an increase in fluorescence intensity (Fig. 5C). This measurements showed that CTAB and ANS do not have any affinity to each other.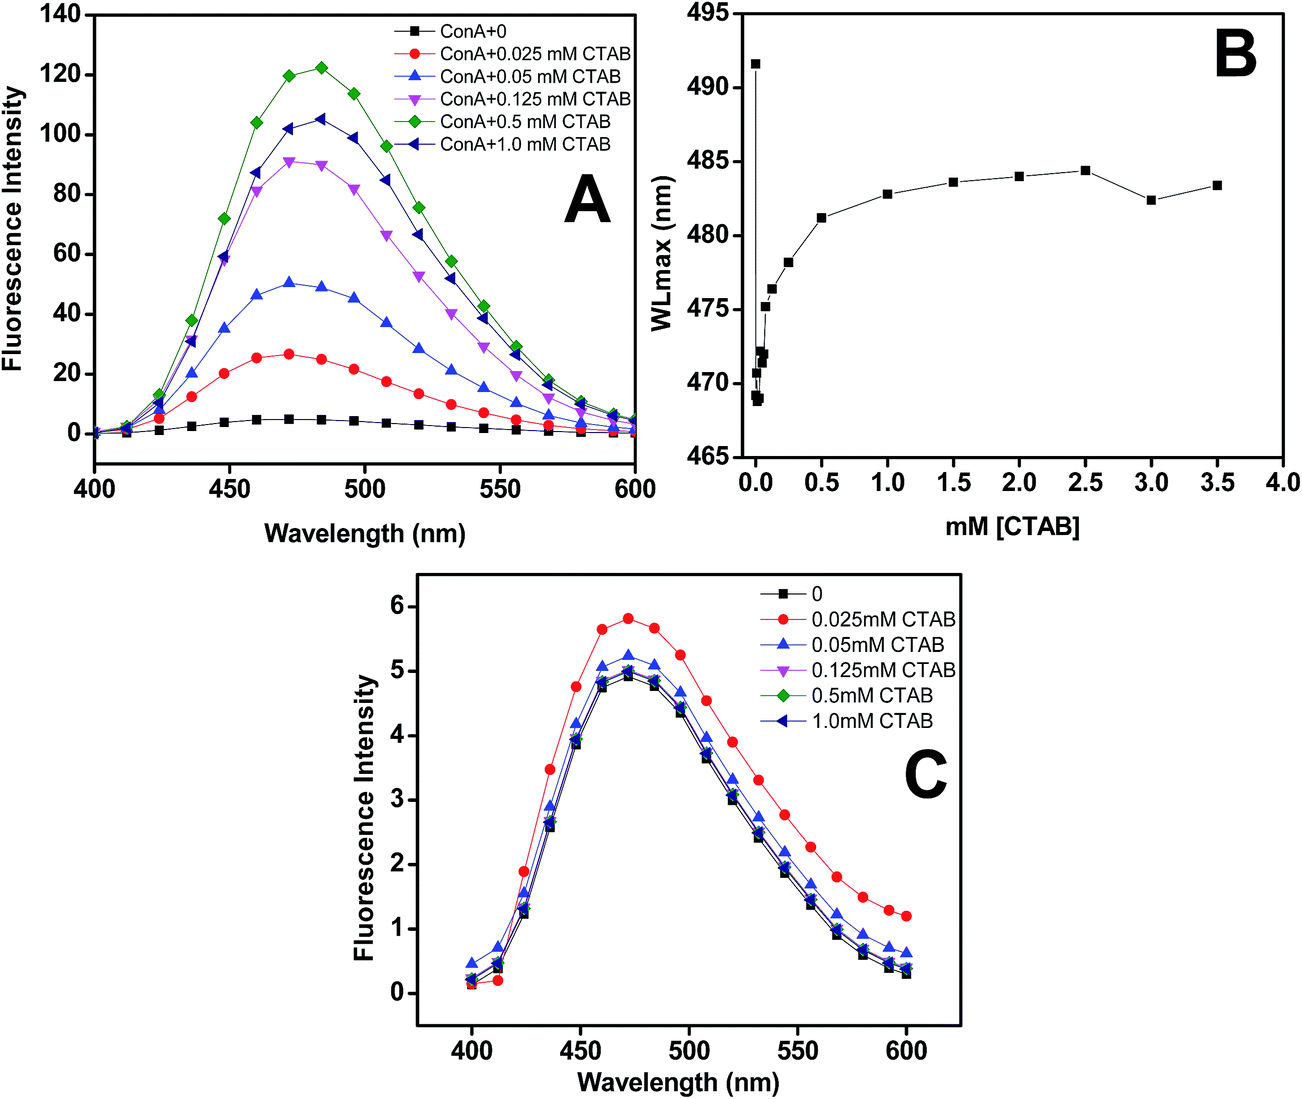 | ||
Fig. 5 Extrinsic fluorescence spectra of samples containing ConA (Panel A) and without ConA (Panel C) with different concentrations of CTAB from 0 ( ), 0.025 mM ( ), 0.025 mM ( ), 0.05 mM ( ), 0.05 mM ( ), 0.125 mM ( ), 0.125 mM ( ), 0.5 mM ( ), 0.5 mM ( ) to 1.0 mM ( ) to 1.0 mM ( ) at physiological pH. Extrinsic fluorescence maxima of ConA was plotted against different concentration CTAB in mM at physiological pH (Panel B). All the extrinsic fluorescence measurements were performed after overnight incubation in 20 mM phosphate buffer pH of 7.4. The ConA concentration (0.2 mg ml−1) was fixed throughout the measurement. ) at physiological pH. Extrinsic fluorescence maxima of ConA was plotted against different concentration CTAB in mM at physiological pH (Panel B). All the extrinsic fluorescence measurements were performed after overnight incubation in 20 mM phosphate buffer pH of 7.4. The ConA concentration (0.2 mg ml−1) was fixed throughout the measurement. | ||
Far-UV circular dichroism (CD) measurements
Far-UV CD spectroscopy study was performed to determine the change in secondary structural contents of proteins. The change in the secondary structure of ConA was measured at above pH two units of pI, with and without 0, 0.025, 0.05, 0.125, 0.5 and 1.0 mM CTAB shown in Fig. 6A. The normalized CD spectra were also shown in Fig. 6B to distinguish the far-UV CD minima shift. Far-UV CD spectra of ConA at pH 7.4 exhibited single minimum at 218 nm which is characteristic features of β-sheet structure. The minimum of ConA at 218 nm, transformed into a single minimum at 223–225 nm in the presence of 0.025, 0.05 and 0.125 mM of CTAB. The minimum position was red shifted and centered in the range of 223–225 nm which is not a characteristic feature of β-sheet structures. The minimum centered in the range of 223–225 nm could be a peak of cross β-sheet structures. This kind of far UC CD minimum was also found in the case of SDS-induced aggregates in hyperthermophilic proteins57 (paper is communicated in biochemistry 2015). At higher concentrations, particularly 0.5 and 1.0 mM of CTAB, the ConA turn into α-helical structures because of intrachain hydrogen bonding among ConA subunits. When negatively charged center of proteins was saturated by binding to the CTAB molecules, the cationic amino acids arginine and lysine residues which are in neutral form, are available to interact with CTAB via hydrogen bonding. Surfactant-induced helical structures were also seen in other proteins also.58,59 | ||
Fig. 6 Secondary structural transition was measured in response to different concentrations of CTAB. (Panel A) Far-UV CD spectra of ConA proteins (0.2 mg ml−1) was incubated with 0 ( ), 0.02 mM ( ), 0.02 mM ( ), 0.05 mM ( ), 0.05 mM ( ), 0.125 mM ( ), 0.125 mM ( ), 0.5 mM ( ), 0.5 mM ( ) and ( ) and ( ) of CTAB at pH 7.4. (Panel B) Normalized spectra of aggregated samples were plotted. All the samples which were containing ConA and different concentration of CTAB were incubated overnight. ) of CTAB at pH 7.4. (Panel B) Normalized spectra of aggregated samples were plotted. All the samples which were containing ConA and different concentration of CTAB were incubated overnight. | ||
Characterization of secondary structural transition by FTIR measurements
CTAB induced secondary structural transformation was measured by FTIR spectroscopy also. FTIR spectra tell the organization of secondary structure in proteins. FTIR peak in the region of 1600 to 1700 cm−1 is due to the to the amide I band and that is specific for several secondary structure conformations of the proteins. Amide I peak in the region from 1613–1643 cm−1 reveals β-sheet structures, however, peak in the range of 1644 and 1662 cm−1 gives information about α-helical content of proteins. Fig. 7 displays the FTIR spectra of ConA which was incubated at neutral pH and various CTAB concentrations, i.e., (i) ConA without CTAB (ii) ConA + 0.025 mM CTAB and (iii) ConA + 2.0 mM CTAB. In the absence of CTAB the amide I peak was found at around ∼1636 cm−1. The shape and peak position of the amide I band is suggested that the ConA is rich in β-sheet structure. The similar FTIR peak was also found when ConA was incubated at neutral pH.60 After adding 0.025 mM CTAB, the amide I peak position was shifted to ∼1628 cm−1 which is corresponding to the cross β-sheet structures. This kind of FTIR spectral transition suggests that the protein forms amyloid like structures which is also supported by other studies. The Aβ40 proteins form amyloid like aggregates and their FTIR spectra was showing a peak at around ∼1628 cm−1 which is corresponding to cross β-sheet structures of protein.61 The aggregated ConA showed noticeable shoulder around 1620 cm−1 which is conforming that the ConA is typical aggregates of β-sheets.60 We further investigated the effect of higher CTAB concentrations on ConA conformation at the same pH. The FTIR spectra of ConA in the presence of 2.0 mM CTAB was obtained and the amide I peak position was shifted at ∼1655 cm−1 which is corresponding to the α-helix of protein. The obtained FTIR results revealed that low concentrations of CTAB are inducing cross β-sheet amyloid structures, however, higher concentrations is inducing α-helical structures in ConA protein. The FITR results are in corroboration of the CD results.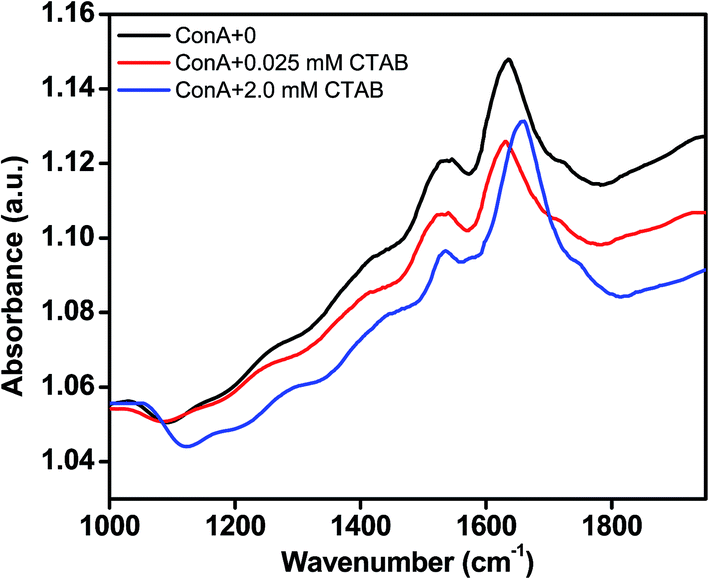 | ||
Fig. 7 FTIR measurement was done to investigate the secondary structural transition in ConA protein: the FTIR spectrum of native ConA at pH 7.4 ( ), amyloid ConA (ConA + 0.025 mM CTAB + pH 7.4) ( ), amyloid ConA (ConA + 0.025 mM CTAB + pH 7.4) ( ) and alpha helical ConA (ConA + 2.0 mM CTAB + pH 7.4) ( ) and alpha helical ConA (ConA + 2.0 mM CTAB + pH 7.4) ( ). The ConA (2.0 mg ml−1) was fixed in all the conditions and buffer strength was 20 mM. All the samples were incubated overnight prior to scan. ). The ConA (2.0 mg ml−1) was fixed in all the conditions and buffer strength was 20 mM. All the samples were incubated overnight prior to scan. | ||
Detection of morphology by TEM
To evaluate the morphology of CTAB induced amyloid fibril of ConA was studied by TEM which is highly used microscopy technique to distinguish the morphology of amyloid and non-amyloid structures. It is reported that amyloid fibril shape is very diverse ranges from worm-like, rod-like, ribbon-like and long straight fibril.62,63 From our spectroscopic observations, it is confirmed that the ConA protein formed amyloid-like structures in the presence of low amount of CTAB at pH above two units of protein pI. Therefore, we have taken TEM images under these experimental conditions (Fig. 8A and B). The ConA proteins form long straight fibril at both concentrations of CTAB at physiological pH. TEM results confirmed that CTAB is inducing long straight fibril in glycoproteins (ConA) at physiological pH. Vetri et al. is also reported that ConA form amyloid like structure at 40 °C at pH 8.9 which is confirmed by AFM39 This is believed that long-straight fibril formation is nucleus-dependent and generated after prolong incubation even in days and months. But CTAB shortens that time of incubation. CTAB is accelerating the fibril formation process, and long straight fibrils are formed within one day.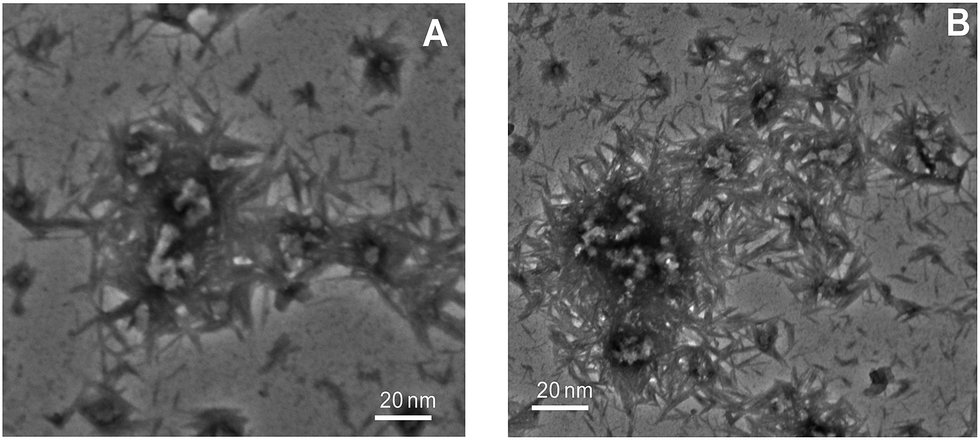 | ||
| Fig. 8 TEM image was taken to confirm morphology of CTAB induced aggregates: (Panel A) TEM image of ConA with 0.025 mM of CTAB incubated for overnight. (Panel B) TEM image of ConA with 0.05 mM of CTAB at pH 7.4 and incubated overnight. | ||
Discussion
Proteins have more propensity to form amyloid-like fibril when it was present in partially altered or unfolded conformation as compression to well fold or organized forms. Various factors have been investigated which are promoting amyloid fibril formation under in vitro. The known key factors are pH, temperature, ionic strength and surfactants. Due to the exposure of these condition protein, native conformations transformed into partially unfolded intermediate. Such partially unfolded intermediates can experience conformational rearrangements induced by reformation of definite noncovalent intermolecular interactions, e.g., hydrogen bonding, electrostatic interactions, hydrophobic contacts that consequently guide to oligomerization and amyloid fibril formation. The oligomerization and congregation of proteins, fibril formation kinetics, and the overall stability of the fibrils are considerably persuaded by the amino acid sequence and the environmental conditions. The surfactant is one of the most commonly exploited ligand used for amyloid fibril formation. Surfactants and lipids already suggested a lot of studies the mechanism of protein aggregation. The electrostatic interaction of α-synuclein with anionic phospholipid has already shown to accelerate the α-synuclein aggregation.64 Similarly anionic surfactant (SDS) is also promoting amyloid fibril formation in amyloid-beta (1–42) even at very low concentration.65 Apart from anionic surfactants, very less or no reports are available about cationic surfactant-induced amyloid fibril formation of plant lectin. In this study, we have conducted a series of experiments to characterize the cationic surfactant-induced amyloid fibril formation in ConA lectin protein. ConA is well folded at physiological pH and present in the tetrameric form, and its aspartic acids and glutamic acid residues are negatively charged at this pH. Each subunit of ConA contains almost net negative (−5) charges at pH 7.4 calculated by PROTEIN CALCULATOR v3.3 software. This is the best states for oppositely charged surfactants or cationic surfactant (CTAB) to interact electrostatically with ConA proteins and stimulate amyloid fibril formation pathways. It is reported that electrostatic interaction is critical in the amyloid fibril formation in α-synuclein proteins with lipid or surfactants.66 In this study, we have used several spectroscopic techniques to characterize amyloid fibril in the presence of CTAB at pH 7.4. The spectroscopic data are presented in Table 1.| CTAB (mM) | Turbidity at 350 nm | Rayleigh scattering at 350/350 nm | ||
|---|---|---|---|---|
| pH two units above pI | pH two units below pI | pH two units above pI | pH two units below pI | |
| 0.0 | 0.0012 | 0.0014 | 95.94 | 97.94 |
| 0.0125 | 0.1813 | 0.0221 | 890.9 | 102.07 |
| 0.025 | 0.2192 | 0.0091 | 1926 | 110.09 |
| 0.0375 | 0.2201 | 0.0043 | 2601 | 103.9 |
| 0.05 | 0.2392 | 0.003 | 2877 | 105.09 |
| 0.075 | 0.2689 | 0.0089 | 3162 | 106.8 |
| 0.125 | 0.3201 | 0.0039 | 3227 | 107.89 |
| 0.25 | 0.198 | 0.0042 | 798.8 | 99.93 |
Turbidity and Rayleigh scattering results revealed that ConA form bigger size aggregates in the presence of 0.0125 to 0.25 mM of CTAB while at higher concentration no aggregation was observed and the turbidity and scattering is almost negligible at pH 7.4 (Table 1). The turbidity of wild-type apomyoglobin was found huge when incubated with heparin at low pH, and this observation was also confirmed that heparin-induced bigger size aggregates in wild-type apomyoglobin at acidic pH67 Both turbidity and scattering was not found when ConA was incubated with the same concentration (0.0125 to 0.25 mM) of CTAB at pH 3.5 because of electrostatic repulsion. A similar observation was also found in our previous published work.68 Serum albumin form amyloid in the presence of low concentrations of SDS, SDBS, and AOT at pH below two units of their pI while at pH two units above their pI (7.4) all surfactants are unable to induce amyloid-like structures.68 The ThT kinetics data were suggested that ConA form amyloid without forming nuclei. The lack of lag phase of ThT kinetics has depended on the CTAB concentration. At low concentration, no lag phase was observed and amyloid fibril was formed very fast. We also performed the same kinetics experiments in the presence of higher concentration of CTAB the amyloid fibril was not formed which is confirmed by poor ThT binding. This is an interesting observation, at low concentrations of CTAB no ‘lag’ phase was captured, but in the same time rise in ThT fluorescence showing that it is following downhill non-nucleation-dependent polymerization, or isodesmic polymerization. Similar kind of ThT kinetics was also found in Aβ2M proteins when it was interacted with different concentrations (1.0 and 5.0 mM) of negatively charged lipids i.e., laurate and myristate.69 Further, we checked that the exposure of surface hydrophobicity of CTAB induced ConA aggregates. We used ANS as an extrinsic fluorophore, which has a strong affinity towards surface hydrophobicity of proteins. In the absence of CTAB, ANS did not have any affinity for ConA while in the presence of 0.0125 to 0.25 mM of CTAB high binding was found to increase in fluorescence intensity. Similarly, it has been found that lysozyme was incubated at 65 °C for 12 h which resulted in high ANS binding with an increase in fluorescence intensity due to high surface hydrophobicity as an outcome of amyloid fibrillization.70 From the CD measurements, it was seen that α-helical and β-sheet protein converted into the β-conformation when proteins form amyloid fibril. The same kind of conversion was also observed in ConA when it was incubated with the low concentrations of CTAB at pH 7.4. The β-sheet structure of ConA transformed into cross β-sheet structure when it exposed to low concentrations of CTAB which is confirmed by far-UV CD measurements. The far-UV CD spectrum minima at 218 at native condition of ConA was shifted in the range of 222–225 nm which is not characteristic features of β-sheet. This kind of peak of aggregated samples could be a cross β-sheet structures which are generated in amyloid fibril formation. Similarly, this type of CD spectrum was also found when YHKB protein was incubated at pH 5.5 in the presence of 30% TFE. The CD spectrum of YHKB showing two peaks one at 208 and 222 nm at zero hours, after the sometimes (5 to 30 minutes) the spectrum peak, was shifted towards higher wavelength (222–225 nm) which could be a amyloid specific signal. In the same paper, they have performed an X-ray diffraction study of YHKB and it is shown high reflection around 4.6 Å which is specific features of cross β-sheet structures.71 We further performed FTIR measurements to investigate the cross β-sheet structure formation by CTAB. FTIR spectrum of both native and aggregates are showing a peak in amide 1 region. The ConA without CTAB (native) showing peak at ∼1436 cm−1 and with CTAB (0.025 mM) (aggregated) at ∼1428 cm−1 which is confirmed that aggregated samples are containing cross β-sheet structures. Similarly, at higher concentrations (2.0 mM CTAB) the β-sheet structures of ConA transformed into α-helix and FTIR peak was shifted to ∼1655 cm−1. From ThT fluorescence, far-UV CD and FTIR experiments, it was confirmed that CTAB induced aggregates have an amyloid-like structure. On the other side, it is also known that ThT has the affinity to bind to the oligomers of proteins and showed high fluorescence intensity. To overcome this experimental limitation, we performed TEM experiments to characterize the morphology of aggregates. TEM images have shown that small fibrils were formed in the presence of 0.02 and 0.05 mM CTAB at pH 7.4 (Fig. 8 A and B). Similar kind of amyloid structure was also formed in β 1–40 human acyl phosphate when these were incubated with heparin sulphate.72
In this study, we have summarized our data in Fig. 9, the ConA contains net negative charge at pH 7.4 because the aspartic and glutamic acid residues are released its H+ in solution and become negatively charged while positively charged residues are neutral in same pH. Meantime, we have added appropriated concentration of CTAB whose positively charged head binds to neutralize the negatively charged residues and then hydrophobic tail repel water molecules around the proteins. This happens due to neutralization of charges and repulsion of water molecules around the protein, losing the solute–solvent interaction which leads to amyloid fibril formation. Similarly, we conducted the same experiments at pH two units below the pI, where arginine, lysine, and histidine residues are protonated and generate net positive charge while negatively charged residues are uncharged. A similar concentration of CTAB was unable to induce amyloid or to unfold to ConA because of strong electrostatic repulsion between CTAB and ConA because both are containing same sign of charges.
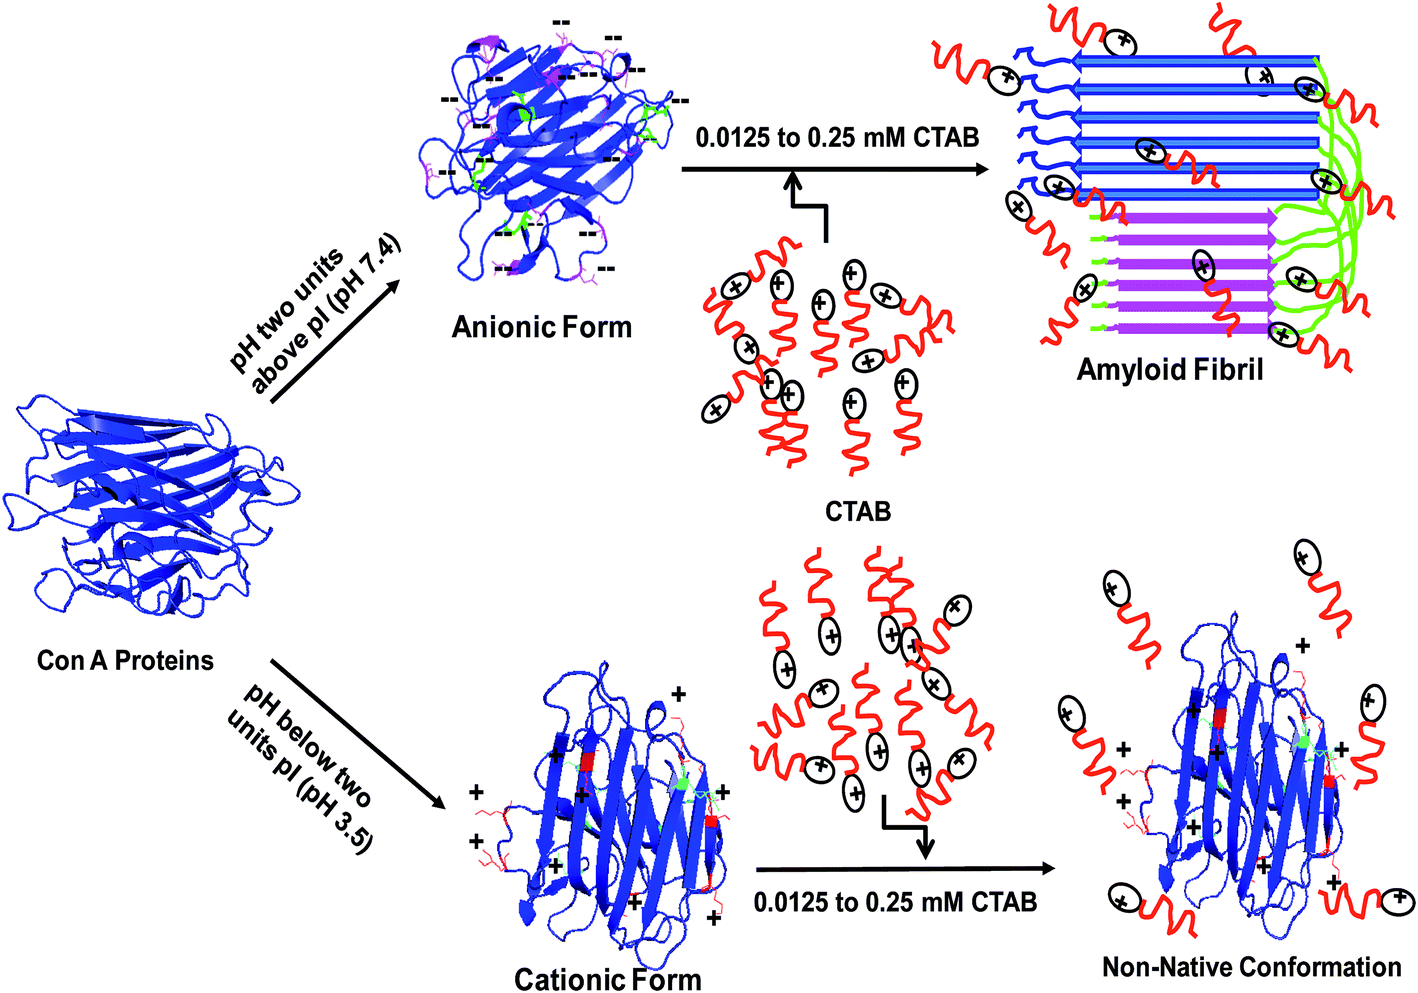 | ||
| Fig. 9 A schematic representation of CTAB induced amyloid fibril formation in ConA protein and possible mode of interaction between protein and cationic surfactant at two different pH. | ||
Conclusions
Rayleigh's scattering, turbidity, tryptophan fluorescence, ANS binding, ThT dye binding, far-UV CD and TEM studied, reflected that CTAB is accelerating amyloid-like structure in ConA protein at pH 7.4. The results of the present work demonstrated that ConA forms mature amyloid-like structure when it was incubated with low concentrations of cationic surfactant (CTAB) at physiological pH. During fibrillation, the mode of interaction between negatively charged ConA and positively charged CTAB was electrostatics as well as hydrophobic at physiological pH. Similarly, CTAB and ConA interacted with each other only by hydrophobic interaction at pH 3.5 where ConA contained net positive charge. CTAB mediated amyloid fibril formation was primarily invoked by electrostatic interaction of CTAB and ConA and then hydrophobic interaction. From the present study, it is now confirmed that CTAB induced amyloid-like structure in ConA when it was incubated at pH two units above the actual protein pI.Abbreviations
| ConA | Conacanvalin A |
| CTAB | Cetyltrimethylammonium bromide |
| ThT | Thioflavin T |
| ANS | 8-Anilino-1-naphthalene-sulfonate |
| CMC | Critical micelle concentration |
Acknowledgements
The authors extend their appreciation to the deanship of scientific research at KSU for funding the work through the research group project number: RGP-215.References
- V. N. Uversky, J. Biomol. Struct. Dyn., 2003, 21, 211–234 CAS.
- C. Chakraborty, S. Nandi and S. Jana, Curr. Pharm. Biotechnol., 2005, 6, 167–177 CAS.
- C. M. Dobson, Nature, 2003, 426, 884–890 CrossRef CAS PubMed.
- M. Sunde and C. C. F. Blake, Adv. Protein Chem., 1997, 50, 123–159 CrossRef CAS PubMed.
- V. N. Uversky and A. L. Fink, Biochim. Biophys. Acta, 2004, 1698, 131–153 CrossRef CAS PubMed.
- F. Piccirilli, S. Mangialardo, P. Postorino, L. Baldassarre, S. Lupi and A. Perucchi, Soft Matter, 2012, 8, 11863–11870 RSC.
- J. S. Schreck and J. M. Yuan, J. Phys. Chem. B, 2013, 117(21), 6574–6583 CrossRef CAS PubMed.
- F. Chiti and C. M. Dobson, Annu. Rev. Biochem., 2006, 75, 333–366 CrossRef CAS PubMed.
- S. R. Paik, D. Lee, H. J. Cho, E. N. Lee and C. S. Chang, FEBS Lett., 2003, 537(1–3), 63–67 CrossRef CAS PubMed.
- C. M. Dobson, Trends Biochem. Sci., 1999, 24, 329–332 CrossRef CAS PubMed.
- J. Jayamani, G. Shanmugam and E. R. A. Singam, RSC Adv., 2014, 4, 62326–62336 RSC.
- M. Calamai, F. Chiti and C. M. Dobson, Biophys. J., 2005, 89(6), 4201–4210 CrossRef CAS PubMed.
- J. K. Das, S. S. Mall, A. Bej and S. Mukherjee, Angew. Chem., Int. Ed. Engl., 2014, 53(47), 12781–12784 CrossRef CAS PubMed.
- J. M. Khan, A. Qadeer, E. Ahmad, R. Ashraf, B. Bhushan, S. K. Chaturvedi, G. Rabbani and R. H. Khan, PLoS One, 2013, 8(4), e62428 CAS.
- K. Singh, M. Shandilya, S. Kundu and A. M. Kayastha, PLoS One, 2015, 10(6), e0129203 Search PubMed.
- M. R. Krebs, D. K. Wilkins, E. W. Chung, M. C. Pitkeathly, A. K. Chamberlain, J. Zurdo, C. V. Robinson and C. M. Dobson, J. Mol. Biol., 2000, 300, 541–549 CrossRef CAS PubMed.
- G. Moraitakis and J. M. Goodfellow, Biophys. J., 2003, 84, 2149–2158 CrossRef CAS PubMed.
- Z. Hu, X. Wang, W. Wang, Z. Zhang, H. Gao and Y. Mao, Phys. Chem. Chem. Phys., 2015, 17(35), 22711–22720 RSC.
- S. S. Wang, Y. T. Hung, W. S. Wen, K. C. Lin and G. Y. Chen, Biochim. Biophys. Acta, 2011, 1811(5), 301–313 CrossRef CAS PubMed.
- W. Wang, Int. J. Pharmacol., 2005, 289(1–2), 1–30 CrossRef CAS PubMed.
- Y. Li, M. Cao and Y. Wang, J. Phys. Chem. B, 2006, 110(36), 18040–18045 CrossRef CAS PubMed.
- A. Abelein, J. D. Kaspersen, S. B. Nielsen, G. V. Jensen, G. Christiansen, J. S. Pedersen, J. Danielsson, D. E. Otzen and A. Gräslund, J. Biol. Chem., 2013, 288(32), 23518–23528 CrossRef CAS PubMed.
- E. K. Kumar and N. P. Prabhu, Phys. Chem. Chem. Phys., 2014, 16(43), 24076–24088 RSC.
- A. Andreola, V. Bellotti, S. Giorgetti, P. Mangione, L. Obici, M. Stoppini, J. Torres, E. Monzani, G. Merlini and M. Sunde, J. Biol. Chem., 2003, 278, 2444–2451 CrossRef CAS PubMed.
- Y. L. Chiang, Y. C. Chang, I. C. Chiang, H. M. Mak, I. S. Hwang and Y. L. Shih, PLoS One, 2015, 10(11), e0142506 Search PubMed.
- Y. Hagihara, D. P. Hong, M. Hoshino, K. Enjyoji, H. Kato and Y. Goto, Biochemistry, 2002, 41, 1020–1026 CrossRef CAS PubMed.
- T. A. Pertinhez, M. Bouchard, R. A. Smith, C. M. Dobson and L. J. Smith, FEBS Lett., 2002, 529, 193–197 CrossRef CAS PubMed.
- M. F. Ahmad, T. Ramakrishna, B. Raman and C. M. Rao, J. Mol. Biol., 2006, 364(5), 1061–1072 CrossRef CAS PubMed.
- J. M. Khan, A. Qadeer, S. K. Chaturvedi, E. Ahmad, S. A. Rehman, S. Gourinath and R. H. Khan, PLoS One, 2012, 7(1), e29694 CAS.
- A. V. Few, R. H. Ottewill and H. C. Parreira, Biochim. Biophys. Acta, 1955, 18(1), 136–137 CrossRef CAS.
- M. A. Mir, J. M. Khan, R. H. Khan, G. M. Rather and A. A. Dar, Colloids Surf., B, 2010, 77(1), 54–59 CrossRef CAS PubMed.
- G. R. Betton, Int. J. Cancer, 1976, 18(5), 687–696 CrossRef CAS PubMed.
- L. Bhattacharyya, S. H. Koenig, R. D. Brown and C. F. Brewer, J. Biol. Chem., 1991, 266, 9835–9840 CAS.
- A. Chatterjee and D. K. Mandal, Int. J. Biol. Macromol., 2005, 35, 103–109 CrossRef CAS PubMed.
- S. Sinha, N. Mitra, G. Kumar, K. Bajaj and A. Surolia, Biophys. J., 2005, 88(2), 1300–1310 CrossRef CAS PubMed.
- N. Mitra, V. R. Srinivas, T. N. Ramya, N. Ahmad, G. B. Reddy and A. Surolia, Biochemistry, 2002, 41, 9256–9263 CrossRef CAS PubMed.
- J. Emsley, H. E. White, B. P. O'Hara, G. Oliva, N. Srinivasan, I. J. Tickle, T. L. Blundell, M. B. Pepys and S. P. Wood, Nature, 1994, 367(6461), 338–345 CrossRef CAS PubMed.
- V. Vetri, C. Canale, A. Relini, F. Librizzi, V. Militello, A. Gliozzi and M. Leone, Biophys. Chem., 2007, 125(1), 184–190 CrossRef CAS PubMed.
- R. Carrotta, V. Vetri, F. Librizzi, V. Martorana, V. Militello and M. Leone, J. Phys. Chem. B, 2011, 115(12), 2691–2698 CrossRef CAS PubMed.
- V. Vetri, F. Librizzi, V. Militello and M. Leone, Eur. Biophys. J., 2007, 36(7), 733–741 CrossRef CAS PubMed.
- R. Carrotta, S. Vilasi, F. Librizzi, V. Martorana, D. Bulone and P. L. San Biagio, J. Phys. Chem. B, 2012, 116(50), 14700–14707 CrossRef CAS PubMed.
- C. E. MacPhee and C. M. Dobson, J. Mol. Biol., 2000, 297(5), 1203–1215 CrossRef CAS PubMed.
- M. Necula, C. N. Chirita and J. Kuret, J. Biol. Chem., 2003, 278, 46674–46680 CrossRef CAS PubMed.
- M. M. Gessel, C. Wu, H. Li, G. Bitan, J. E. Shea and M. T. Bowers, Biochemistry, 2012, 51, 108–117 CrossRef CAS PubMed.
- S. K. Chaturvedi, J. M. Khan, M. K. Siddiqui, P. Alam and R. H. Khan, Int. J. Biol. Macromol., 2016, 83, 315–325 CrossRef CAS PubMed.
- C. Wu, Z. Wang, H. Lei, Y. Duan, M. T. Bowers and J. E. Shea, J. Mol. Biol., 2008, 384, 718–729 CrossRef CAS PubMed.
- M. Biancalana and S. Koide, Biochim. Biophys. Acta, 2010, 1804(7), 1405–1412 CrossRef CAS PubMed.
- S. I. Cohen, S. Linse, L. M. Luheshi, E. Hellstrand, D. A. White, L. Rajah, D. E. Otzen, M. Vendruscolo, C. M. Dobson and T. P. Knowles, Proc. Natl. Acad. Sci. U. S. A., 2013, 110(24), 9758–9763 CrossRef CAS PubMed.
- J. M. Khan, S. K. Chaturvedi, S. K. Rahman, M. Ishtikhar, A. Qadeer, E. Ahmad and R. H. Khan, Soft Matter, 2014, 10(15), 2591–2599 RSC.
- V. Betts, M. A. Leissring, G. Dolios, R. Wang, D. J. Selkoe and D. M. Walsh, Neurobiol. Dis., 2008, 31(3), 442–450 CrossRef CAS PubMed.
- W. Hoyer, D. Cherny, V. Subramaniam and T. M. Jovin, Biochemistry, 2004, 43(51), 16233–16242 CrossRef CAS PubMed.
- M. Grey, S. Linse, H. Nilsson, P. Brundin and E. Sparr, J. Parkinson's Dis., 2011, 1(4), 359–371 CAS.
- P. J. Marek, V. Patsalo, D. F. Green and D. P. Raleigh, Biochemistry, 2012, 51(43), 8478–8490 CrossRef CAS PubMed.
- S. K. Mehta, Bhawna, K. K. Bhasin and A. Kumar, J. Colloid Interface Sci., 2008, 323, 426–434 CrossRef CAS PubMed.
- F. Naseem and R. H. Khan, Int. J. Biol. Macromol., 2008, 42(2), 158–165 CrossRef CAS PubMed.
- S. K. Chaturvedi, P. Alam, J. M. Khan, M. K. Siddiqui, P. Kalaiarasan, N. Subbarao, Z. Ahmad and R. H. Khan, Int. J. Biol. Macromol., 2015, 80, 375–384 CrossRef CAS PubMed.
- J. M. Khan, P. Sharma, K. Arora, N. Kishor, P. Kaila and P. Guptasarma, Biochemistry, 2016 Search PubMed , under review.
- S. Rodziewicz-Motowidło, J. Puszczyk, A. S. Kołodziejczyk, E. Sikorska, A. Skwierawska, M. Oleszczuk and Z. Grzonka, Biopolymers, 2007, 87(1), 23–39 CrossRef PubMed.
- E. Ahmad, A. Naeem, S. Javed, S. Yadav and R. H. Khan, J. Biochem., 2007, 142(3), 307–315 CrossRef CAS PubMed.
- F. Piccirilli, G. Schirò, V. Vetri, S. Lupi, A. Perucchi and V. Militello, Biophys. Chem., 2015, 199, 17–24 CrossRef CAS PubMed.
- T. M. Doran, E. A. Anderson, S. E. Latchney, L. A. Opanashuk and B. L. Nilsson, J. Mol. Biol., 2012, 421(2–3), 315–328 CrossRef CAS PubMed.
- H. A. Lashuel, S. R. Labrenz, L. Woo, L. C. Serpell and J. W. Kelly, J. Am. Chem. Soc., 2000, 122(22), 5262–5277 CrossRef CAS PubMed.
- W. F. Xue, S. W. Homans and S. E. Radford, Protein Eng., Des. Sel., 2009, 22(8), 489–496 CrossRef CAS PubMed.
- G. Comellas, L. R. Lemkau, D. H. Zhou, J. M. George and C. M. Rienstra, J. Am. Chem. Soc., 2012, 134(11), 5090–5099 CrossRef CAS PubMed.
- V. Rangachari, B. D. Moore, D. K. Reed, L. K. Sonoda, A. W. Bridges, E. Conboy, D. Hartigan and T. L. Rosenberry, Biochemistry, 2007, 46(43), 12451–12462 CrossRef CAS PubMed.
- M. Grey, C. J. Dunning, R. Gaspar, C. Grey, P. Brundin, E. Sparr and S. Linse, J. Biol. Chem., 2015, 290(5), 2969–2982 CrossRef CAS PubMed.
- S. Vilasi, R. Sarcina, R. Maritato, A. De Simone, G. Irace and I. Sirangelo, PLoS One, 2011, 6(7), e22076 CAS.
- J. M. Khan, S. A. Abdulrehman, F. K. Zaidi, S. Gourinath and R. H. Khan, Phys. Chem. Chem. Phys., 2014, 16(11), 5150–5161 RSC.
- K. Hasegawa, S. Tsutsumi-Yasuhara, T. Ookoshi, Y. Ohhashi, H. Kimura, N. Takahashi, H. Yoshida, R. Miyazaki, Y. Goto and H. Naiki, Biochem. J., 2008, 416(2), 307–315 CrossRef CAS PubMed.
- S. K. Chaturvedi, N. Zaidi, P. Alam, J. M. Khan, A. Qadeer, I. A. Siddique, S. Asmat, Y. Zaidi and R. H. Khan, PLoS One, 2015, 10(8), e0136528 Search PubMed.
- H. Ramshini, C. Parrini, A. Relini, M. Zampagni, B. Mannini, A. Pesce, A. A. Saboury, M. Nemat-Gorgani and F. Chiti, PLoS One, 2011, 6(1), e16075 CAS.
- N. Motamedi-Shad, E. Monsellier, S. Torrassa, A. Relini and F. Chiti, J. Biol. Chem., 2009, 284(43), 29921–29934 CrossRef CAS PubMed.
| This journal is © The Royal Society of Chemistry 2016 |