DOI:
10.1039/C6RA03698H
(Paper)
RSC Adv., 2016,
6, 32228-32233
Fast and reversible functionalization of a single nanopore based on layer-by-layer polyelectrolyte self-assembly for tuning current rectification and designing sensors†
Received
9th February 2016
, Accepted 16th March 2016
First published on 17th March 2016
Abstract
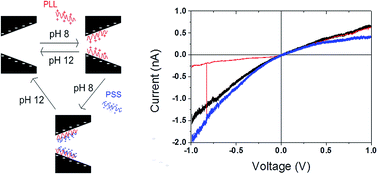
Single track-etched nanopores offer an opportunity to develop different nano-devices such as, ionic diodes or biosensors. Here we report an original approach to functionalize conical nanopores based on layer-by-layer self-assembly of poly-L-lysine and poly(styrene sulfonate). Our results show the possibility to modulate the current rectification properties and to reduce the tip diameter of the nanopore. This strategy permits a fast (less than 1 minute) and reversible functionalization of the nanopore. Based on this, we demonstrate applications in order to detect differences in polyanion (poly(styrene sulfonate), chondroitin sulfate and ssDNA) and avidin using PLL grafted with specific functions (mPEG-biotin).
Introduction
Single solid state nanopore technology offers an opportunity to develop different nano-devices such as, ionic diodes1–3 or biosensors.4–8 This technology is directly inspired by biological nanopores such as α-hemolysin and its analogues9–12 as well as ion channels.13 Compared to biological nanopores, solid-state ones can be considered for a larger range of applications due to their long lifetime. Apart from nanopores drilled in an SiN thin layer, which are the most promising for single macromolecule detection, especially DNA,14 ones obtained by the track-etching technique are particularly interesting for mimicking ion channels or ligand-gate response.7 Indeed, they can be produced in different polymer materials (polyethylene terephthalate (PET), polycarbonate (PC), polyimide (PI), Kapton and polytetrafluoroethylene (PTFE)). Regarding the chemical etching conditions, nanopores can be obtained with different shapes such as conical or cylindrical.15 Conically shaped nanopores are particularly interesting since the current–voltage (I–V) curve exhibits a more or less important current rectification.2,16–21 This “ionic diode” effect is dependent on the nanopore tip diameter22,23 and on the density of surface charges.24,25 Typically for PET, the surface charges are induced by –COOH groups negatively charged at a pH higher than 3.5. In this case, the ionic transport through the nanopore is lowered when a positive voltage is applied to its base side. In order to tune the ion current rectification, nanopores were chemically functionalized. The grafting of amine groups allows the current rectification to inverse, by changing the surface charges. To do this, different strategies were considered. As an example, functionalization using an electrostatic interaction was reported for the surfactant CTAB.26 The most used method, involves the activation of –COOH groups by 1-ethyl-3-(-3-dimethylaminopropyl) carbodiimide. This has been employed to graft ethylene diamine,2,19,27 amine-terminated polymer brushes28 or polyimide.29 These experiments require from several hours to one day, depending on whether the functionalization is expected only at the entrance or along the nanopore. Based on this concept, several examples of sensors30–33 or nanovalves34–36 were reported. However, the main problem of chemical functionalization is their non-reversibility. Thus, a conical nanopore can be used only once as a sensor and an “in situ” modulation of ionic transport properties during an experiment cannot be considered. This substantially limits the interest of these nanopores for sensing applications.
By using the electrostatic interactions of the carboxyl groups on the nanopore surface wall with amine groups of polycations such as, poly(allylamine) or poly-L-lysine, a reversible functionalization can be considered. The deposition, layer-by-layer (LBL) of polyelectrolytes is commonly used to modify surface properties of membranes37,38 as well as nanoparticles.39 For single nanopores only LBL of poly(allylamine) (PAH) and poly(styrene sulfonate) (PSS) have been reported.40 However, this concept can be extended (i) to modulate “in situ” the ionic transport properties and (ii) to perform reversible functionalization of the nanopore.
This work aims to propose a fast and reversible functionalization of single nanopores which allows a change to its ionic transport properties. To do it, we considered PET conical nanopore functionalization with poly-L-lysine (PLL) and poly(styrene sulfonate) (PSS). PLL was chosen since it is a weak polycation which is partially charged at neutral pH.41 We have studied, first, PLL and PLL/PSS LBL adsorption onto a nanopore, and their influence on its ionic transport properties as well as the reversibility of the functionalization. Then PLL and PLL-g-PEG-biotin adsorption was also investigated in order to apply this concept in nanopore sensing.
Material and methods
Material
Poly(ethylene terephthalate) (PET) film (thickness 13 μm, biaxial orientation) was purchased from Goodfellow (ES301061). Sodium chloride (S9888), sodium hydroxide (30603), ethylenediaminetetraacetic acid (EDTA) (E5513), poly-L-lysine hydrobromide (PLL) Mw 30–70 kD (P2636), poly(sodium 4-styrene sulfonate) (PSS) Mw 70 kD (243051) poly(ethylene glycol) (N-hydroxysuccinimide 5-pentanoate) ether 2-(biotinylamino)ethane (NHS-mPEG-biotin) Mn = 3800 g mol−1 (757799), avidin from egg white (A9275), sodium tetraborate (221732), trizma hydrochloride (T3253) and CAPS (C2632) were purchased from Sigma-Aldrich. Potassium chloride (POCL-00A) was purchased from LabKem. Ultra-pure water was produced from a Q-grad®-1 Milli-Q system (Millipore). Succinimidyl mPEG (NHS-mPEG) Mn = 2000 g mol−1 (PG1-SC-2k-1) was purchased from Tebu bio.
Preparation of buffer and polyelectrolyte solutions
The solutions for the pH response measurements were made as follows: the buffer solution of pH 8 used for polyelectrolyte adsorption, to rinse and for I–V measurements contains NaCl 100 mM, Tris 5 mM and EDTA 1 mM pH 8. The buffer solution of pH 12 used for PLL and PLL/PSS bilayer desorption contains KCl 100 mM and CAPS 10 mM. The final pH of the solutions was adjusted with HCl and NaOH solutions using a pH meter (Hanna HI 221 pH meter, pH electrode HI 1131). PLL and PSS stock solutions were obtained by direct dissolution in water with a final concentration of 1 mg mL−1.
PLL-g-[(mPEG)12x-(PEG-biotin)x] synthesis
The synthesis of grafted copolymer PLL-g-[(mPEG)12x-(PEG-biotin)x] was adapted from the protocol described by Elbert and Hubbel.42 PLL (40 mg mL −1) was dissolved in sodium tetraborate buffer (50 mM pH 8.5). The solution was filtered and sterilized. Then the solution was directly added to solid NHS-mPEG and NHS-PEG-biotin (12
:
1). The mixture was stirred for 6 h at room temperature. Then the unreactive polymers were removed by dialysis against 1 L (24 h) buffer NaCl 100 mM, Tris 5 mM and EDTA 1 mM pH 8 and stored at −20 °C.
Current–voltage measurements
Electrical measurements were performed using a patch-clamp amplifier (EPC10 HEKA electronics, Germany). The current is measured by Ag/AgCl, 1 M KCl electrodes connected to the cell chamber by agar–agar bridges. A single nanopore was mounted in Teflon cell containing an electrolyte solution. One electrode was plugged to the working end of the amplifier (trans chamber, base) and the other electrode connected to the ground (cis chamber, tip). For I–V curves, trace currents were recorded as a function of time under ramp voltages from −1 V to 1 V (60 s). All current traces were recorded at a frequency of 20 kHz.
Track-etching nanopores and characterization
Single tracks were produced by Xe irradiation (8.98 MeV u−1) of PET film (13 μm) (GANIL, SME line, Caen, France). Activation of the track was performed by UV exposition for 24 h per side, (Fisher bioblock; VL215.MC, λ = 312 nm) before the chemical etching process. The etching of the conical nanopore was performed under dissymmetric conditions. The PET foil is mounted in a chemical cell in Teflon. On one side of the cell, there is the etchant solution (9 M NaOH), and on the other side the stopping solution (1 M KCl and 1 M of acetic acid). The time is recorded as soon as the etching solution is inserted. A 1 V potential is applied across the membrane, the reference electrode is in the stopping solution and the working electrode in the etchant solution. When the current rises, there is a breakthrough. When it reaches hundreds of pA, the etching process is stopped, and the NaOH solution is replaced by the stopping one.
The tip diameter dt of the conical nanopore was obtained from the dependence of the conductance G measured in the linear zone of the I–V curve using eqn (1):
where
κ is the ionic conductivity of the solution,
L is the nanopore length (13 μm) and
db is calculated from the total etching time
t using the relationship
db = 2.5
t (the factor 2.5 was determined in our experimental set up using multipore track-etched membranes).
Results and discussion
Single nanopores were fabricated by a track-etching method on PET film. In order to obtain a conical shape, the etching was performed under dissymmetrical conditions. The nanopores used for this study have a tip diameter (dt) around 11 ± 2 nm (Table 1). After chemical etching, PET nanopores exhibit a negative surface charge due to carboxylate groups. Thus, I–V curves recorded at pH 8 (NaCl 500 mM, Tris 5 mM, and EDTA 1 mM) exhibit a current rectification. The latter can be quantified by a rectification factor (f(rec)) calculated from |I(−1 V)|/|I(1 V)|. According to our experimental conditions, for a negatively charged nanopore, the rectification factor is greater than 1 (Fig. 1 and SI-1†). This current rectification has been interpreted by the formation of the depletion zone inside the nanopore.24 It depends on the nanopore properties such as the surface charge density and the opening angle as well as the salt concentration.
Table 1 Diameters of conical nanopores
Nanopore |
Tip (nm) |
Base (nm) |
NP-1 |
10 |
525 |
NP-2 |
12.3 |
323 |
NP-3 |
13.5 |
570 |
NP-4 |
10.2 |
650 |
 |
| Fig. 1 PLL adsorption on the conical nanopore NP-1: (a) illustration of the experimental protocol, (b) typical current trace recorded during PLL loading at pH 8, NaCl 500 mM, Tris 5 mM, and EDTA 1 mM, −1 V (here for NP-1). (c) I–V curve, before (black) and after PLL (red) loading. Evolution of the rectification factor (with PLL red circle, without PLL black square) (d) and conductance (e) for each cycle of PLL adsorption/desorption. The conductance was measured after PLL removal, on the linear zone of the I–V curve (between −75 mv to 75 mV). | |
The nanopore functionalization was performed by adding 16 μL of PLL solution (1 mg mL−1) directly on the tip side of the cell chamber containing 1.6 mL of buffer solution at pH 8 (NaCl 500 mM, Tris 5 mM, and EDTA 1 mM) (Fig. 1a). A voltage of −1 V was applied in order to favor the PLL entrance and to monitor the current during the functionalization. Indeed, since the current rectification is strongly dependent on both the nanopore surface charge and angle, it becomes possible to characterize the PLL adsorption on the nanopore during the functionalization process. For all the nanopores, a decrease of the current is observed for a time between 35 to 60 seconds after the PLL addition at the tip side (Fig. 1b). This time does not seem particularly dependent on the nanopore tip diameter. After the current stabilization, typically 2 minutes after the PLL addition, the cell is rinsed with the buffer solution at pH 8 to remove the excess of PLL. The I–V curve exhibits an inversion of current rectification for all nanopores with f(rec) < 1 (Fig. 1c and SI-1†). This inversion of current rectification indicates a surface charge inversion of the nanopore induced by the PLL adsorption. Basically, it comes from an excess of positive charges from the PLL which blocks the cation transport under a negative voltage. Regarding the short time required to obtain the inversion of the current rectification, we cannot consider full functionalization along the nanopore length. Thus, the PLL should be located only at the nanopore entrance. Indeed, the inversion of the current rectification is also observed even if the amine groups are located only at the nanopore entrance.29 Interestingly, the current at positive voltage is not strongly impacted by the PLL addition as opposed to the negative voltage. This can be assigned to the functionalization of only the nanopore entrance. Moreover, it has been shown that a bipolar nanopore induces a higher rectification degree compared to a unipolar nanopore with similar surface charge densities on the pore walls.18
Since PLL is a weak polyelectrolyte, we have attempted to remove it by breaking its electrostatic interactions with the nanopore. In order to do that, the buffer solution at pH 8 was replaced by a buffer solution at pH 12 (KCl 100 mM, and CAPS 10 mM). After 5 min, the cell was rinsed and filled with the buffer solution at pH8. The I–V curve recorded after the desorption process is similar to the one before PLL adsorption. In order to evaluate the reversibility of PLL functionalization, the adsorption/desorption cycle was repeated 9 times on the same nanopore. The I–V curves are recorded after each cycle with and without PLL (Fig. SI-2†). The results show that the number of cycles does not have a strong influence on the ionic transport properties. Indeed, the rectification factors are between 0.17 ± 0.4 and 4.8 ± 1.2 after PLL adsorption and desorption respectively (Fig. 1d). The nanopore conductivity after PLL desorption is also constant 4.6 ± 0.6 nS (Fig. 1e). This means that the nanopore is not clogging during the adsorption/desorption process due to the PLL which stays at the nanopore entrance. Thus at this stage we have proven that PLL adsorption is suitable as a reversible method to modify the ionic transport properties of nanopores.
To go further in our investigation, a second functionalization with PSS after PLL adsorption was considered. Basically, we proceeded as follows: after PLL adsorption and rinse, 16 μL PSS (1 mg mL−1) was added directly to the tip side under 1 V. A voltage is applied to facilitate the polymer entrance in the nanopore. The current trace (Fig. 2) shows a decrease of current after several seconds (typically from 15 s to 60 s). This current decrease suggests the adsorption of negatively charged PSS onto positively charged PLL. After 2 minutes, when the current is stable, the cell is rinsed with buffer solution (pH 8) to remove the excess of PSS. The I–V curves recorded after PSS adsorption exhibit an inversion of the current rectification. The latter increases from 0.5 to 4 and from 0.3 to 3 for the nanopores reported in Fig. 2. Interestingly, the current rectification is more pronounced after PSS addition (3 and 6 for NP-3 and NP-2) than for the raw nanopore (1.5 and 3). This result suggests the successful adsorption of PSS on the PLL layer. The difference in rectification factor can be assigned to the different charge densities of the PSS layer and PET.
 |
| Fig. 2 PLL-PSS bilayer adsorption on NP3 (a) illustration of the experimental protocol, (b) a typical current trace recorded during the PSS loading at pH 8; NaCl 500 mM; Tris 5 mM; EDTA 1 mM, and 1 V (c) I–V curves before (black), after PLL (red) and after PSS (blue) insertion, for NP-3. (d) Reversibility of PLL-PSS functionalization for NP-2 (from I–V curves Fig. SI-3†), evolution of the rectification factor (without PLL/PSS black square, with PLL red circle, with PLL/PSS bilayer blue triangle) and conductance for each cycle of PLL/PSS adsorption/desorption (the conductance was measured after the PLL/PSS removal on a linear zone of the I–V curve between −75 mv to 75 mV). (e) Rectification factor obtained after polyanion loading (NP-2). | |
In order to confirm the PSS loading as well as to evaluate the reversibility of PLL/PSS bilayer adsorption, the cell was filled with buffer solution at pH 12 for 3 minutes. Then, it was rinsed with buffer solution at pH 8. In the example in Fig. SI-3,† the I–V curves for 3 cycles of PLL/PSS bilayer adsorption/desorption after each step (PLL adsorption, PSS adsorption and PLL/PSS desorption) are reported. First of all, we observe that after treatment at pH 12, the I–V curve is similar to the one before PLL/PSS adsorption. Thus, this result indicates the reversibility of PLL/PSS bilayer adsorption. In addition, the conductance after each PLL/PSS bilayer adsorption/desorption cycle is constant (Fig. 2). This shows that the diameter at the nanopore entrance is not modified by successive cycles of PLL/PSS bilayer adsorption/desorption. In addition the results show quasi-constant values of f(rec) at each step: 0.4 ± 0.1 after PLL adsorption, 4 ± 0.2 after PSS adsorption and 3 ± 0.2 after rinse at pH 12 (Fig. 2). This suggests that the adsorption process of PLL and PSS is not affected by the previous PLL/PSS bilayer, and thus confirms the complete reversibility of the functionalization. To go further in our investigation and demonstrate the potentialities of this strategy of functionalization, we have considered sensing applications. Similar experiments were conducted with different polyanions (PSS Mn = 70 kD and 1000 kD, chondroitin sulfate and ssDNA) using the same nanopore after PLL adsorption. As expected, when polyanions were added, the rectification factors show a charge inversion of the nanopore. More interestingly the f(rec) value (Fig. 2e) is dependent on the nature of the polyanion or on its molecular weight for PSS. Thus nanopores decorated with PLL could be used for polyanion detection as well as to modulate the current rectification properties.
Since the formation of one PLL/PSS bilayer inside a nanopore is now proved, multilayer functionalization of nanopores was considered. Starting from a nanopore with a dtip = 10 nm and dbase = 650 nm, PLL and PSS were alternatively introduced in the nanopore. At each step the I–V dependence was recorded at pH 8 after rinsing to remove the excess of polyelectrolytes. The current rectification and the conductance G, extracted from the I–V linear part (−0.1 V to 0.1 V) are reported in Fig. 3. As expected the current rectification is inversed with each adsorbed layer of PLL and PSS. The decrease of conductance indicates a decrease of the tip nanopore diameter induced by successive PLL-PSS bilayer adsorption. Another interesting point is the evolution of the current rectification with the number of layers. Indeed it decreases after PSS and PLL adsorption. This means that the density of the negatively charged surface of the nanopore, after PSS adsorption, decreases as opposed to the density of the positively charged surface after PLL adsorption. Thus using this method to design conical nanopores can be considered since it is possible to modify the tip diameter as well as the density of the surface charges of the nanopore. More generally, both LBL growth and the surface charge depend on the organization of polyelectrolytes (coil or linear). This parameter is connected with the strength of the polyelectrolyte, the concentration and the salt used during the adsorption process, the pH or the temperature.43 However, the diameter size after LBL functionalization cannot be deduced from the conductance since it requires knowing the surface charge of the nanopore as well as the ionic transport inside the LBL.
 |
| Fig. 3 LBL PLL/PSS deposition on NP-4. I–V curve after PLL (red) and PSS (blue) loading (a) (PLL/PSS)1 and (b) (PLL/PSS)8. Evolution of the factor of rectification (after PLL red circle and after PSS blue triangle) (c) and conductance (d) for each layer of PLL/PSS. The conductance was measured after PSS addition on linear zone of the I–V curve (between −75 mV to 75 mV). | |
Beside the modulation of the ionic diode properties and the detection of polyanions, we have considered a functionalization of the nanopore using PLL grafted with a specific function (mPEG-biotin) in order to detect avidin. This system was chosen as a proof of concept since it is a base for developing many kinds of biosensors. The nanopore functionalization was performed by adding PLL-g-[(mPEG)12x-(PEG-biotin)x] (denoted PLL-g-mPEG-biotin) in the tip side of the nanopore under a voltage of 1 V (10 minutes). The I–V curve shows a decrease of both the current rectification, 0.89 (1.8 for raw nanopore) and the conductance due to the steric volume of PEG (Fig. 4). In addition the current rectification for PLL-g-mPEG-biotin is less pronounced than for PLL. This is correlated with a lower surface charge of PLL-g-mPEG-biotin due to the mPEG-biotin grafting. After that, 16 μL avidin (1 mg mL−1) is added on the tip side under a voltage of −200 mV for 6 minutes. After rinsing, the I–V curve (Fig. SI-5†) exhibits a decrease of both conductance and current rectification (0.6). The latter can be interpreted by an increase of positive surface charge at the nanopore entrance provided by the global positive charge of avidin at pH 8. The functionalization of the nanopore is removed by rinsing it with a solution at pH 12, and the nanopore can be functionalized again.
 |
| Fig. 4 PLL-g-PEG-biotin functionalization of NP-2 and avidin sensing (a) I–V curve (pH 8; NaCl 500 mM; Tris 5 mM; EDTA 1 mM) before (black), after PLL-g-PEG-biotin (green) and after avidin (orange). (b) Rectification factor obtained for raw nanopore (black), after functionalization by PLL adsorption (red) or PLL-g-PEG-biotin (green) and avidin addition (orange). | |
Conclusions
To sum up, we have demonstrated that PLL is suitable to tune a nanopore, since this functionalization: (i) requires a simple addition of polyelectrolyte on the tip side of the cell and the functionalization is achieved after less than a minute (ii) it can be monitored to control if the functionalization is achieved, and (iii) it is totally reversible at pH 12 without alteration of the nanopore. We have also shown that PLL and PLL/PSS LBL are suitable to modulate the ionic selectivity of a conical nanopore. In addition PLL and PLL-g-PEG-biotin can be used also to design sensors where the nanopore could be re-used. We expect that the polyelectrolyte adsorption onto an asymmetric nanopore can lead to a large variety of new switchable nanofluidic diodes with further applications in different technological areas such as biosensing, or drug delivery. Finally, the advantage of track-etched nanopores is easy upscaling to multipore membranes. Thus, it becomes possible to extend this method in order to design large surface membranes for ionic separation or biosensing.
Acknowledgements
M. Lepoitevin has a PhD fellowship from the French government. This work was supported in part by European Institute of Membrane in health project (PS2-2014) and by the French Research Program ANR-BLANC, Project TRANSION (ANR-2012-BS08-0023). Single tracks have been produced in GANIL.
Notes and references
- Z. Siwy, E. Heins, C. C. Harrell, P. Kohli and C. R. Martin, J. Am. Chem. Soc., 2004, 126, 10850–10851 CrossRef CAS PubMed.
- I. Vlassiouk and Z. S. Siwy, Nano Lett., 2007, 7, 552–556 CrossRef CAS PubMed.
- Z. S. Siwy and S. Howorka, Chem. Soc. Rev., 2010, 39, 1115–1132 RSC.
- S. Howorka and Z. Siwy, Chem. Soc. Rev., 2009, 38, 2360–2384 RSC.
- D. Branton, D. W. Deamer, A. Marziali, H. Bayley, S. A. Benner, T. Butler, M. Di Ventra, S. Garaj, A. Hibbs, X. H. Huang, S. B. Jovanovich, P. S. Krstic, S. Lindsay, X. S. S. Ling, C. H. Mastrangelo, A. Meller, J. S. Oliver, Y. V. Pershin, J. M. Ramsey, R. Riehn, G. V. Soni, V. Tabard-Cossa, M. Wanunu, M. Wiggin and J. A. Schloss, Nat. Biotechnol., 2008, 26, 1146–1153 CrossRef CAS PubMed.
- M. Wanunu, Phys. Life Rev., 2012, 9, 125–158 CrossRef PubMed.
- M. Lepoitevin, M. Bechelany, J. M. Janot and S. Balme, Sci. Lett. J., 2015, 4, 188 Search PubMed.
- S. Cabello-Aguillar, A. Abou-Chaaya, M. Bechelany, C. Pochat-Bohatier, E. Balanzat, J. M. Janot, P. Miele and S. Balme, Soft Matter, 2014, 10, 8413–8419 RSC.
- J. J. Kasianowicz, E. Brandin, D. Branton and D. W. Deamer, Proc. Natl. Acad. Sci. U. S. A., 1996, 93, 13770–13773 CrossRef CAS.
- J. Clarke, H. C. Wu, L. Jayasinghe, A. Patel, S. Reid and H. Bayley, Nat. Nanotechnol., 2009, 4, 265–270 CrossRef CAS PubMed.
- D. Wendell, P. Jing, J. Geng, V. Subramaniam, T. J. Lee, C. Montemagno and P. X. Guo, Nat. Nanotechnol., 2009, 4, 765–772 CrossRef CAS PubMed.
- E. A. Manrao, I. M. Derrington, A. H. Laszlo, K. W. Langford, M. K. Hopper, N. Gillgren, M. Pavlenok, M. Niederweis and J. H. Gundlach, Nat. Biotechnol., 2012, 30, 349–353 CrossRef CAS PubMed.
- S. Balme, J. M. Janot, L. Berardo, F. Henn, D. Bonhenry, S. Kraszewski, F. Picaud and C. Ramseyer, Nano Lett., 2011, 11, 712–716 CrossRef CAS PubMed.
- C. Dekker, Nat. Nanotechnol., 2007, 2, 209–215 CrossRef CAS PubMed.
- P. Apel, Radiat. Meas., 2001, 34, 559–566 CrossRef CAS.
- M. Ali, P. Ramirez, S. Mafe, R. Neumann and W. Ensinger, ACS Nano, 2009, 3, 603–608 CrossRef CAS PubMed.
- M. Ali, P. Ramirez, H. Q. Nguyen, S. Nasir, J. Cervera, S. Mafe and W. Ensinger, ACS Nano, 2012, 6, 3631–3640 CrossRef CAS PubMed.
- E. B. Kalman, I. Vlassiouk and Z. S. Siwy, Adv. Mater., 2008, 20, 293–297 CrossRef CAS.
- K. P. Singh and M. Kumar, J. Appl. Phys., 2011, 110, 084322 CrossRef.
- Y. Ai, M. K. Zhang, S. W. Joo, M. A. Cheney and S. Z. Qian, J. Phys. Chem. C, 2010, 114, 3883–3890 CAS.
- R. Karnik, C. H. Duan, K. Castelino, H. Daiguji and A. Majumdar, Nano Lett., 2007, 7, 547–551 CrossRef CAS PubMed.
- P. Y. Apel, I. V. Blonskaya, O. L. Orelovitch, P. Ramirez and B. A. Sartowska, Nanotechnology, 2011, 22, 175302 CrossRef PubMed.
- M. L. Kovarik, K. M. Zhou and S. C. Jacobson, J. Phys. Chem. B, 2009, 113, 15960–15966 CrossRef CAS PubMed.
- D. Constantin and Z. S. Siwy, Phys. Rev. E: Stat., Nonlinear, Soft Matter Phys., 2007, 76, 041202 CrossRef PubMed.
- G. Nguyen, I. Vlassiouk and Z. S. Siwy, Nanotechnology, 2010, 21, 265301 CrossRef PubMed.
- L. Wang, Y. Yan, Y. B. Xie, L. Chen, J. M. Xue, S. Yan and Y. G. Wang, Phys. Chem. Chem. Phys., 2011, 13, 576–581 RSC.
- M. Ali, V. Bayer, B. Schiedt, R. Neumann and W. Ensinger, Nanotechnology, 2008, 19, 485711 CrossRef PubMed.
- S. Nasir, M. Ali and W. Ensinger, Nanotechnology, 2012, 23, 225502 CrossRef PubMed.
- M. Ali, B. Schiedt, K. Healy, R. Neumann and A. Ensinger, Nanotechnology, 2008, 19, 085713 CrossRef CAS PubMed.
- M. Ali, S. Nasir, I. Ahmed, L. Fruk and W. Ensinger, Chem. Commun., 2013, 49, 8770–8772 RSC.
- M. Ali, S. Nasir, Q. H. Nguyen, J. K. Sahoo, M. N. Tahir, W. Tremel and W. Ensinger, J. Am. Chem. Soc., 2011, 133, 17307–17314 CrossRef CAS PubMed.
- M. Ali, P. Ramirez, M. N. Tahir, S. Mafe, Z. Siwy, R. Neumann, W. Tremel and W. Ensinger, Nanoscale, 2011, 3, 1894–1903 RSC.
- M. Ali, B. Schiedt, R. Neumann and W. Ensinger, Macromol. Biosci., 2010, 10, 28–32 CrossRef CAS PubMed.
- A. Alcaraz, P. Ramirez, E. Garcia-Gimenez, M. L. Lopez, A. Andrio and V. M. Aguilella, J. Phys. Chem. B, 2006, 110, 21205–21209 CrossRef CAS PubMed.
- S. F. Buchsbaum, G. Nguyen, S. Howorka and Z. S. Siwy, J. Am. Chem. Soc., 2014, 136, 9902–9905 CrossRef CAS PubMed.
- M. Lepoitevin, G. Nguyen, M. Bechelany, E. Balanzat, J. M. Janot and S. Balme, Chem. Commun., 2015, 51, 5994–5997 RSC.
- D. Menne, J. Kamp, J. E. Wong and M. Wessling, J. Membr. Sci., 2016, 499, 396–405 CrossRef CAS.
- W. Q. Jin, A. Toutianoush and B. Tieke, Langmuir, 2003, 19, 2550–2553 CrossRef CAS.
- Z. H. Lu, M. D. Prouty, Z. H. Guo, V. O. Golub, C. S. S. R. Kumar and Y. M. Lvov, Langmuir, 2005, 21, 2042–2050 CrossRef CAS PubMed.
- M. Ali, B. Yameen, J. Cervera, P. Ramirez, R. Neumann, W. Ensinger, W. Knoll and O. Azzaroni, J. Am. Chem. Soc., 2010, 132, 8338–8348 CrossRef CAS PubMed.
- S. E. Burke and C. J. Barrett, Biomacromolecules, 2003, 4, 1773–1783 CrossRef CAS PubMed.
- D. L. Elbert and J. A. Hubbell, Chem. Biol., 1998, 5, 177–183 CrossRef CAS PubMed.
-
B. Seantier and A. Deratani, in Ionic interactions in natural and synthetic macromolecules, ed. A. Ciferri and A. Pecrico, Wiley, Hoboken, New Jersey, 1st edn, 2012 Search PubMed.
Footnote |
† Electronic supplementary information (ESI) available: Additional current–voltage response. See DOI: 10.1039/c6ra03698h |
|
This journal is © The Royal Society of Chemistry 2016 |
Click here to see how this site uses Cookies. View our privacy policy here.