DOI:
10.1039/C6RA03662G
(Paper)
RSC Adv., 2016,
6, 42836-42844
Glycine modified graphene oxide as a novel sorbent for preconcentration of chromium, copper, and zinc ions from water samples prior to energy dispersive X-ray fluorescence spectrometric determination
Received
9th February 2016
, Accepted 18th April 2016
First published on 20th April 2016
Abstract
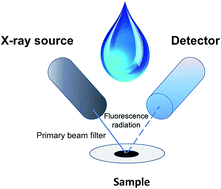
A novel and selective sorbent for micro-solid phase extraction was synthesized by chemical functionalization of graphene oxide with glycine. The structure of this nanomaterial, referred to as GO-Gly, was confirmed by Fourier transform infrared spectroscopy, X-ray photoelectron spectroscopy, and scanning electron microscopy. GO-Gly was used for preconcentration of chromium, zinc, and copper ions from water samples prior to their determination by energy dispersive X-ray fluorescence spectrometry (EDXRF). The proposed procedure is based on dispersion of micro amounts of GO-Gly in aqueous samples. After adsorption of metal ions on its surface, samples were filtered under vacuum and then membrane filters were directly submitted to energy dispersive X-ray fluorescence spectrometric measurements. In order to obtain optimal preconcentration conditions, some parameters affecting sorption process, such as pH, amount of GO-Gly, sorption times, and sample volume, were examined. Under optimal conditions the calibration curves were linear in a 1–150 ng mL−1 range with recoveries higher than 97%. The obtained detection limits for Cr(III), Zn(II), and Cu(II) determinations are 0.15, 0.07, and 0.08 ng mL−1, respectively. A relative standard deviation of the proposed procedure (at a 10 ng mL−1 level for n = 10) is lower than 2.3%. The proposed method was successfully applied for determination of Cr(III), Zn(II), and Cu(II) ions in water samples.
Introduction
Environmental analysis is a matter of a great concern due to increasing awareness of the negative impact of pollution on human health and proper functioning of ecosystems. Intensive development of industry, agriculture, and other human activities introduce into the environment many harmful species such as pesticides, polycyclic aromatic hydrocarbons, and heavy metal ions. Since heavy metals are not biodegradable and can be accumulated in living organisms, their concentrations in environmental samples should be monitored.1 Due to the fact that metal ions are usually present at trace and ultratrace levels, and because of matrix effects present in environmental samples, a separation and/or preconcentration step is usually recommended prior to determination.2,3
Among the most popular sample pretreatment procedures, solid-phase extraction (SPE), and its miniaturized version solid phase microextraction (SPME), are the most favourable due to the variety of available sorbents, simplicity, low consumption of organic solvents, rapid phase separation, high enrichment factor, the ability to handle large sample volumes, and the opportunity to couple with different analytical techniques in the form of off- and on-line systems.4,5 In SPE-based methods the proper choice of an adsorbent is of crucial importance. Until recently the most frequently used sorbents were ion-exchange and chelate resins, silica gels, polyurethane foams, and activated charcoal.6 Moreover, different types of nanosorbents including graphene oxide (GO) are increasingly popular in SPE and SPME mainly due to their large surface area and sorption capacity, chemical stability, and excellent efficiency.7–10 Since the GO surface is unselective, competitive adsorption hampering determination of analytes can occur. In order to improve its selectivity, introduction of other molecules, metal nanoparticles, or a variety of functional groups onto its surface is usually performed.11–14 Such modifications can be performed in two ways, namely covalent and noncovalent. In the case of covalent functionalization a GO surface is modified by the formation of chemical bonding while in the noncovalent mode van der Waals forces, hydrogen bonding, and π–π stacking interactions are applied.11–14 It is noteworthy that covalent modification seems to be a more useful strategy since sorbents prepared by the noncovalent method are more unstable.7 Covalent modification allows obtaining sorbents of desired properties which are more stable and can be used many times. Novel GO-based adsorbents are usually more selective and have found an application in preconcentration of different metal ions i.e. Pb(II),15–22 Cu(II),16,17,20,22–25 Co(II),17,26 Fe(II),20 Mn(II),27 Hg(II),22,28 Zn(II),20 Cd(II),17,22,26,29 Au(III),30 Pd(II),30 Cr(III),20 Cr(VI),31 As(III), and As(V).17,32
Practical usage of GO-based adsorbents in classical SPE and SPME may be difficult due to the fact that the nanometric sized particles can escape from the cartridges. Furthermore, aggregation of planar sheets reduces the active surface area, produces a back-pressure on the extraction devices, and may cause a blockage of cartridges leading to an extraction failure.33 Such limitations can be overcome by dispersive solid phase extraction (DSPE). Since the first usage of DSPE as a clean-up technique,34 it has found wide application as an effective extraction technique. In DSPE, a small amount of adsorbent (in mg range) is directly dispersed in a sample solution. It allows nearly instantaneous analyte–sorbent interaction which shortens the time required to establish equilibrium state. After the extraction process, phases can be easily separated by centrifugation or filtration. The adsorbed analytes can be measured directly or after previous elution or desorption from the adsorbent surface. Taking into account the high sorption capacity of nanomaterials, the amount of sorbent used for the preconcentration step can be reduced to a μg range. This fact allowed miniaturization of DSPE which is known in the literature as a dispersive micro solid-phase extraction (DMSPE). Due to the fact that energy dispersive X-ray fluorescence spectrometry (EDXRF) operates most efficiently on thin solid targets, a combination of DMSPE with EDXRF seems to be a powerful tool in trace and ultratrace analysis.
In this work the covalent functionalization of graphene oxide with glycine was applied to synthesise a novel nanosorbent, referred as GO-Gly. Glycine was introduced onto the graphene oxide surface by nucleophilic substitution. The obtained nanosorbent is more selective than GO and enables quantitative adsorption of Cr(III), Zn(II), and Cu(II) ions from aqueous samples. GO-Gly was applied as a solid sorbent in DMSPE for preconcentration of selected heavy metal ions from water samples prior to their determination by EDXRF. In order to obtain optimal preconcentration conditions, some parameters affecting sorption process, such as pH, amount of GO-Gly, sorption times, and sample volume, were carefully examined. The developed method was successfully applied to determination of Cr(III), Zn(II), and Cu(II) ions in water samples.
Experimental
Instrumentation
The measurements were performed using an Epsilon 3 EDXRF spectrometer (PANalytical, Almelo, The Netherlands) with a Rh target X-ray tube, 50 μm Be window and a maximum power of 9 W. The spectrometer is equipped with a thermoelectrically cooled silicon drift detector (SDD) with 8 μm Be window and a resolution of 135 eV at 5.9 keV. The X-ray tube was operated at 30 kV and 0.300 mA. Spectra were collected in atmospheric conditions using a 100 μm Ag primary beam filter with a counting time 300 s.
Measurements were also carried out using SpecroFMS16a spectrometer with excitation in the ICP plasma (Spectro Analytical Instruments) and application of the following operating parameters: plasma power – 1.4 kW, coolant gas – Ar, 12 L min−1, auxiliary gas – Ar, 1 L min−1, nebulizer gas – Ar, 1 L min−1, nebulizer pressure – 3.2 bar, nebulizer – cross-flow type, and sample uptake rate – 2 mL min−1; wavelengths: Cr – 284.3 nm, Mn – 257.6 nm, Co – 230.8 nm, Ni – 231.6 nm, Cu – 327.4 nm, Zn – 213.9 nm, and Pb – 228.8 nm.
The pH measurements were conducted using a PHS-3E pH-meter (Chemland) equipped with a combination glass electrode.
The chemical structure of GO-Gly was confirmed by Fourier-transform infrared spectroscopy (FT-IR), X-ray photoelectron spectroscopy (XPS), and scanning electron microscopy (SEM). The FT-IR spectra were recorded using a FT-IR Nicolet Magna 560 spectrometer with KBr pellets. XPS analysis was performed with a PHI 5600 Physical Electronic Spectrometer using monochromated Al Kα radiation, at vacuum pressure of 5 × 10⁻¹⁰ mbar, 15 kV, and 15 mA. The energy resolution was 0.1 eV. All photoelectron spectra were calibrated against the peaks of Au 4f7/2 at 83.98 eV, Ag 3d5/2 at 368.27 eV, and Cu 2p3/2 at 932.67 eV of binding energy. The test of the surfaces of the crystal was carried out at a take-off angle of 45°. The GO and GO-Gly surface image was obtained on a JEOL-5410 SEM equipped with an energy dispersion X-ray spectrometer (EDS with Si(Li) X-ray detector). The vacuum in the measuring chamber was 10−4 to 10−5 Pa.
Reagents and solutions
All reagents were of analytical grade and used without any further purification. High purity water obtained from a Milli-Q system (Millipore, Molsheim, France) was used during the experiments. Stock solutions (1 mg mL−1 of Cr(III), Co(II), Mn(II), Ni(II), Cu(II), Zn(II), and Pb(II)), nitric acid (65%, Suprapur®) and ammonium hydroxide solution (25%, Suprapur®) were purchased from Merck (Darmstadt, Germany, www.merck.com). Salts used for interferences studies, glycine, potassium permanganate, sulphuric acid, and ethanol were purchased from POCh (Gliwice, Poland, www.poch.com.pl). Thionyl chloride was purchased from Acros Organics. Tetrahydrofuran (THF) and N,N-dimethylformamide (DMF) were purchased from Chempur (Piekary Śląskie, Poland). Graphite powder was purchased from Sigma-Aldrich (St. Louis, USA, www.sigmaaldrich.com). The pH of the analyzed solutions was adjusted with 0.1 mol L−1 HNO3 and 0.1 mol L−1 NH3·H2O. The suspension of modified graphene oxide (500 μg mL−1) was prepared using high purity water. The GO-Gly suspension was sonicated for 15 min each time before use in order to obtain a homogeneous suspension.
Synthesis of graphene oxide
Graphene oxide was synthetized using modified Hummers' method.35 3 g of graphite powder was mixed with 1.5 g of NaNO3 and 69 mL of H2SO4. After cooling the mixture to 0 °C in an ice bath, 9 g of KMnO4 was added in small portions, in order to keep the reaction temperature below 20 °C. The obtained mixture was warmed to 35 °C and stirred for 12 h. Then, the mixture was cooled to room temperature and poured into beaker filled with 400 mL of ice and 3 mL of 30% H2O2. The obtained solid phase was separated from the reaction mixture by centrifugation at 5000 rpm. In order to remove manganese ions the final product was purified with 10% HCl and water. Each time, the product was redispersed by sonication and collected by centrifugation. The final product was dried at 70 °C.
Synthesis of glycine methyl ester hydrochloride
Glycine (7.51 g) was dissolved in dry methanol (100 mL) under Ar atmosphere. The stirred solution was cooled in an ice bath and treated dropwise with 18.5 mL of freshly distilled SOCl2. When SOCl2 addition was completed, the cooling bath was removed and stirring was continued at room temperature overnight. The volatiles were removed under vacuum and the oily residue was mixed with diethyl ether (50 mL). The separated solid was filtered and dried under vacuum to obtain a white solid (10.55 g, 84%). The structure of glycine methyl ester hydrochloride was confirmed by 1H NMR analysis (400 MHz, D2O) – δ: 3.88 (s, 2H), 3.78 (s, 3H), and 13C NMR (101 MHz, D2O) – δ: 168.7, 53.4, 40.1.
Synthesis of GO-Gly
A mixture of 1 g of GO, 160 mL of SOCl2, and 5 mL of THF was stirred at 70 °C under argon atmosphere for 24 h. After that, an excess of SOCl2 was removed under reduced pressure at 50 °C. The obtained product was mixed with 10 g of glycine methyl ester hydrochloride in THF (100 mL) under Ar atmosphere at 70 °C for 48 h. The obtained solid phase was separated by centrifugation and washed 15 times with ethanol in order to remove the residual glycine methyl ester hydrochloride; each time, the product was redispersed by sonication and collected by centrifugation. After drying at 60 °C hydrolysis was performed using 2 mol L−1 HCl (80 mL). The suspension was stirred under Ar atmosphere at 50 °C for 10 h. The synthetized GO-Gly was centrifuged, washed with water to neutral pH, and dried at 70 °C. The chemical structure of GO-Gly was confirmed by Fourier-transform infrared spectroscopy (FT-IR), X-ray photoelectron spectroscopy (XPS), and scanning electron microscopy (SEM).
Preconcentration procedure
The preconcentration procedure was as follows: 0.5 mL of GO-Gly suspension at a concentration of 500 μg mL−1 was added to 20–50 mL of aqueous sample. The pH of the sample was adjusted to 6 using 0.1 mol L−1 NH3·H2O. Then, the solution was stirred at 700 rpm for 10 min. The analysed sample was filtered on a membrane filter under vacuum using a 5 mm diameter filtration assembly. The membrane filter with loaded GO-Gly and adsorbed metal ions was dried under air conditions and afterwards directly measured using the EDXRF spectrometer. The blank sample was prepared in the same way as described above, but high-purity water was added instead of the analysed solution. Calibration samples were prepared using the described DMSPE procedure with a series of standard solutions containing different amounts of Cr(III), Zn(II), and Cu(II) ions.
Sample preparation
Water samples for determination of Cr(III), Zn(II), and Cu(II) ions were collected in the Upper Silesia region, Poland. Before analysis samples were filtered through a Millipore cellulose acetate membrane (0.45 μm) and, after acidification with HNO3, stored at 4 °C.
Results and discussion
Characterization of synthesized GO-Gly
Synthesis of GO-Gly is based on the nucleophilic substitution of glycine to graphene oxide nanoparticles. In the first step, glycine was transformed into glycine methyl ester hydrochloride in order to protect the C-terminal end and the N-terminal end of the amino acid. The obtained product, activated in situ, was used for the formation of amido binding between glycine and GO. The scheme of GO-Gly synthesis is given in Fig. 1.
 |
| Fig. 1 The synthesis scheme of GO-Gly. | |
The synthesized GO-Gly was characterized by Fourier transform infrared spectroscopy, X-ray photoelectron spectroscopy, and scanning electron microscopy.
The FTIR spectra of GO and GO-Gly are presented in Fig. 2. The IR spectrum of GO shows a very broad and intense band between 3700–2000 cm−1 (O–H stretching vibrations) and the peaks at 1728 cm−1 (stretching vibrations from C
O), 1614 cm−1 (C
C skeletal vibrations), 1362 cm−1 (C–O carboxy vibrations), 1224 cm−1 and 1050 cm−1 (C–O epoxy and alkoxy stretching, respectively). The successful modification GO with glycine was confirmed by the presence of a broad absorption band between 1300 and 800 cm−1 attributed to the C–N and C–O stretching vibrations. Moreover, two new peaks at 1557 cm−1 and 1460 cm−1 are due to the N–H and C–H bending vibrations, respectively. The band at 3425 cm−1 is assigned to the N–H stretching vibrations associated with C–H stretching (2924 cm−1 and 2851 cm−1). The stretching vibrations from C
O (1698 cm−1) and C
C (1650 cm−1) bonds are still observed. The peak at 670 cm−1 is assigned to N–H waging.
 |
| Fig. 2 IR spectra of (blue) GO and (red) GO-Gly samples, measured at 293 K by the KBr pellet technique in the range of 4000–400 cm−1. | |
The synthesized GO and GO-Gly was characterized by SEM (1000× magnification) in Fig. 3. The wrinkled structure of GO-Gly shows a larger surface for a single element and high extractive capacity.
 |
| Fig. 3 SEM image of (a) GO-Gly and (b) GO. | |
The synthesized GO and GO-Gly were also characterized by XPS. Fig. 4 shows the high-resolution C 1s and O 1s spectra of GO and GO-Gly. The C 1s spectrum of GO reveals five peaks at 284.8, 285.9, 286.7, 288.1, and 289.5 eV assigned to C–C/C–H, C–OH, C–O–C, C
O, and O–C
O. The C 1s spectrum of GO-Gly was deconvoluted also into five peaks at 284.6 (C–C/C–H), 286 (C–N/C–OH), 287.1 (C–O–C), 289.1 (C
O), and 290.4 eV(O–C
O/N–C
O). Despite a smaller electronegativity difference between carbon and nitrogen compared to carbon and oxygen, the peaks for C–N/C–OH and O–C
O/N–C
O are observed at different binding energy (compared with C–OH and O–C
O in GO). The O 1s spectrum of GO shows the three peaks at 531.2, 532.4, and 534.8 eV assigned to O–C
O, C
O, and C–OH. The O 1s of GO-Gly reveals four peaks at 530.2, 531.2, 533.5, and 534.7 eV assigned to O–C
O, C
O, N–O, and C–OH.
 |
| Fig. 4 The high-resolution O 1s and C 1s spectra for graphene oxide and glycine-modified graphene oxide. | |
The significant changes of shape and intensity at the maximum position of C 1s peaks correspond to successful modification of GO-Gly material. Both C 1s and O 1s deconvoluted lines indicate the successful modification of GO-Gly by demonstrated new peaks (C–N, N–C–O in carbon line and N–O in oxygen line) assigned to surface groups.14,17,19
Optimisation of adsorption process
Glycine is the simplest amino carboxylic acid which can act as a bidentate ligand. It forms stable 5-membered chelate complexes with metal ions via the amino N and the carboxylate O atom donors. It was expected that the presence of donating atoms in the glycine structure could influence the selectivity of a modified GO surface towards different metal species. The existence was expected to influence the affinity of metal species for sorption sites on the surface of chemically functionalised graphene oxide nanoparticles. Therefore, in order to examine adsorption capacity of GO-Gly toward metal ions, some parameters that affect the sorption process such as sample pH, amount of GO-Gly, sample volume, and sorption time on the quantitative recoveries of the analyte ions were examined. All parameters that influenced the sorption process on GO-Gly nanoparticles were optimized independently and in all cases three replicates were carried out. The optimization was performed for 5 μg of the studied metal ions in 50 mL volume samples. In all cases recovery was determined by the ICP-OES technique after the DMSPE procedure.
Effect of sample pH
Sample pH is considered to be one of the most important parameter affecting the sorption process. It influences the charge generated on the GO-Gly surface as well as the type of metal species present in aqueous solution. It should be noted here that under acidic conditions an excess of protons present in the solution can protonate binding sites, and as a consequence the positive charge generated on a GO-Gly surface causes electrostatic repulsion between GO-Gly nanoparticles and metal species. Furthermore, at low pH the competition between protons and metal cations for the same sorption site occurs, which results in decreasing its sorption ability. With increase of sample pH, the ionisation of the oxygen- and nitrogen-containing functional groups present on the surface of GO-Gly occurs. The negative charge generated on its surface enhances the sorption capacity towards metal ions. The adsorption mechanism involves chelation via lone electron pairs present in oxygen and nitrogen functional groups rather than electrostatic interaction.
The effect of sample pH on the adsorption of Cr(III), Co(II), Mn(II), Ni(II), Cu(II), Zn(II), and Pb(II) ions on GO-Gly nanoparticles was investigated over the pH range 1–10. The sample pH was adjusted to desired value using ammonium hydroxide and nitric acid solutions. As demonstrated in Fig. 5a, the recoveries of examined metal increase with the increase of sample pH. For Cr(III), Cu(II), and Zn(II) ions recoveries higher than 95% were obtained at pH 6. Further increase of sample pH did not affect their adsorption percentage. In the case of the remaining metal ions, namely Ni(II), Co(II), Mn(II), and Pb(II), recoveries increased in neutral and basic solutions, and at pH 10 reached values close to, or higher than 40%. This can be explained by coprecipitation of appropriate hydroxides which usually occurred at 8–10 pH range, depending on the metal and its concentration.
 |
| Fig. 5 The influence of (a) pH (sample volume 50 mL, metal ions concentration 100 ng mL−1, sorbent mass 250 μg, sorption time 10 min, n = 3), (b) amount of GO-Gly (sample volume 50 mL, pH = 6, metal ions concentration 100 ng mL−1, sorption time 10 min, n = 3), (c) sorption time (sample volume 50 mL, pH = 6, metal ions concentration 100 ng mL−1, sorbent mass 250 μg, n = 3), and (d) sample volume (pH = 6, metal ions concentration 100 ng mL−1, sorbent mass 250 μg, stirring time 10 min, n = 3) on the recovery of Cr, Mn, Co, Ni, Cu, Zn, and Pb by the DMSPE–EDXRF procedure. | |
It should be noted here that Cr(III), as a hard acid, shows a strong tendency to form complexes with a variety of organic ligands containing oxygen, nitrogen, or sulphur donor atoms. On the other hand Cu(II) and Zn(II), as borderline acids, form chelate complexes via oxygen or nitrogen donor atoms present in organic ligands. Such affinity of Cr(III), Cu(II), and Zn(II) ions increases solubility of their hydrolysed species in aqueous samples. Such behaviour, and the fact that at pH values lower than 8 Cr(III), Cu(II), and Zn(II) ions are present in aqueous solutions as positively charged Cr3+, Cr(OH)2+, Cr(OH)2+, Cu2+, Cu(OH)+, Zn2+, and Zn(OH)+, prompted further experiments to be carried out at pH 6.
Effect of GO-Gly mass
The adsorption efficiency and further EDXRF measurements depend on the mass of GO-Gly. It is well-known that EDXRF is dedicated mainly to solid samples analysis. Moreover, the most preferable samples are those which are present in the form of thin solid targets, because in such samples matrix correction is not required or can be neglected.36 For that reason, a compromise between the high adsorption percentage and sample thickness should be taken into consideration when the adsorbent mass is optimised. The effect of GO-Gly amount on the Cr(III), Cu(II), and Zn(II) recoveries was studied within a 100–500 μg range. Quantitative introduction of such small amounts of sorbent into aqueous samples was possible, since GO-Gly hydrophilic properties allow obtaining stable water suspensions. As was shown in Fig. 5b with the increase of GO-Gly mass, the recoveries of the studied metals increase up to 250 μg reaching values of ca. 98%, and then remain constant. Hence, 250 μg of GO-Gly was selected for further studies.
Effect of sorption time
The contact time between GO-Gly nanoparticles and metal ions is another significant parameter to be optimised in order to obtain high adsorption percentage. It is well known that mass transfer between sorbent and solution is promoted by sample stirring. In such a simple way the equilibrium state can be achieved faster. Moreover, large surface area and excellent dispersibility of GO-Gly in water samples was expected to influence the sorption time. Therefore, the effect of stirring time on the Cr(III), Cu(II), and Zn(II) recoveries was examined in a 5–40 min range at room temperature. The obtained results presented in Fig. 5c show that the highest adsorption percentage for all tested metals was obtained after 10 min of stirring. Further increase of the contact time did not have an effect on their adsorption percentage The short time required to obtain equilibrium state can be explained by quick homogeneous dispersion of GO-Gly in the whole sample which increases the contact area between sorbent surfaces and studied metal ions. Hence, a stirring time of 10 minutes was chosen for subsequent studies.
Effect of sample volume
Sample volume may considerably affect the sorption process, especially at higher volumes. On the other hand, larger sample volumes increase sample preparation time due to an extended filtration step. In order to examine the effect of sample volume on the recoveries of analytes, series of sample solutions containing Cr(III), Cu(II), and Zn(II) ions in volumes ranging between 20 and 150 mL were prepared at the following experimental conditions: pH = 6, metal ions concentration 100 ng mL−1, sorbent mass 250 μg, and stirring time 10 min. As can be seen in Fig. 5d, the quantitative recoveries (>95%) were obtained for sample volumes up to 75 mL using 250 μg of GO-Gly. Taking into account time required for sample filtration, 50 mL volume was used in further studies.
Analytical characteristics of the method
In order to obtain calibration curves, a series of reference samples containing various amounts of Cr(III), Cu(II), and Zn(II) ions were prepared according to the recommended procedure. The linear relationship between analyte concentration and fluorescence radiation intensity, confirmed by correlation coefficients better than 0.997, was achieved over a 1 to 150 ng mL−1 range. Detection limits for Cr(III), Zn(II), and Cu(II), calculated from the equation: DL = (3/k)(B/t)1/2, where k is the count sensitivity [s−1 μg−1], B is the count rate of blank sample [counts s−1], and t is the counting time (300 s), were 0.15, 0.07, and 0.08 ng mL−1, respectively. As can be seen in Table 1, such low DLs are comparable or in many cases better than those obtained by extensively used FAAS and ICP-OES, even after a preconcentration procedure. On the other hand, lower DLs can be achieved by ICP-MS but this technique is too expensive to be used for routine analysis. Moreover, in the case of salinity samples or samples with a complicated matrix, a preconcentration step is still needed because of chemical and spectral disturbances.
Table 1 Comparison of the presented method with recently published procedures based on solid-phase extraction and determination of Cr(III), Cu(II), and Zn(II) ions
Technique |
Sorbent (its mass) |
Ion |
Instrument |
LOD, μg L−1 |
Linearity range, μg L−1 |
Matrix |
Ref. |
SPE |
Fe3O4–ethylenediamine (29 mg) |
Cr(III) |
FAAS |
0.5 |
1.5–150 |
Agriculture samples |
37 |
Zn(II) |
0.2 |
0.6–120 |
DSPE |
Silica-coated Fe3O4 modified with salicylic acid (0.11 g) |
Cr(III) |
FAAS |
0.15 |
0.44–640 |
Environmental, biological, pharmaceutical and metal alloy samples |
38 |
Cu(II) |
0.22 |
0.73–400 |
SPE |
Amine-functionalized graphene oxide (100 mg) |
Cu(II) |
FAAS |
0.05 |
0.1–100 |
Water and food samples |
39 |
Zn(II) |
0.10 |
0.5–150 |
SPE |
Yeast immobilized on TiO2 nanoparticles (300 mg) |
Cr(III) |
ICP-OES |
0.17 |
Up to 500 |
Water samples |
40 |
Cu(II) |
0.45 |
Up to 500 |
Zn(II) |
0.10 |
Up to 500 |
SPE |
Sulfur-nanoparticle-loaded alumina (500 mg) |
Cu(II) |
FAAS |
0.24 |
0.5–40 |
Water samples |
41 |
Zn(II) |
0.21 |
0.5–20 |
SPE |
TiO2 immobilized on silica gel (50 mg) |
Cr(III) |
ICP-OES |
0.036 |
— |
Water samples |
42 |
Cu(II) |
0.021 |
DSPE |
Fe3O4@SiO2@TiO2 nanoparticles (40 mg) |
Cr(III) |
ICP-MS |
0.0026 |
— |
Water samples |
43 |
Cu(II) |
0.0023 |
DSPE |
Fe3O4@3-(trimethoxysilyl)-1-propantiol modified with 2-amino-5-mercapto-1,3,4-thiadiazole (50 mg) |
Cu(II) |
ICP-OES |
0.13 |
— |
Water samples |
44 |
Zn(II) |
0.11 |
SPE |
Nanometer sized ZrO2 (50 mg) |
Cr(III) |
ICP-OES |
0.058 |
— |
Water, food, and human hair samples |
45 |
Cu(II) |
0.024 |
Zn(II) |
0.002 |
SPE |
p-Toluene–sulfonylamide-modified silica gel (300 mg) |
Cr(III) |
ICP-OES |
0.61 |
— |
Food samples |
46 |
Cu(II) |
0.19 |
Zn(II) |
0.21 |
SPE |
SDS coated Sepabeads SP70 modified with 4-((E)-3-phenylallylidene)amino benzenethiol (500 mg) |
Cr(III) |
FAAS |
2.6 |
20–650 |
Soil, lettuce and tobacco leaves, mint water, and liver samples |
47 |
Cu(II) |
1.9 |
10–800 |
Zn(II) |
1.6 |
10–180 |
SPE |
Hybrid SiO2/TiO2–NH2 (400 mg) |
Cu(II) |
FAAS |
0.24 |
5–800 |
Food and water samples |
48 |
Zn(II) |
0.13 |
5–800 |
DSPE |
Multiwalled carbon nanotubes modified with ethylenediamine-N,N-diacetic acid (15 mg) |
Cr(III) |
FAAS |
0.15 |
0.5–10 |
Food samples |
49 |
Cu(II) |
0.14 |
0.5–5 |
DMSPE |
Graphene oxide modified with glycine (250 μg) |
Cr(III) |
EDXRF |
0.15 |
1–150 |
Water samples |
This work |
Cu(II) |
0.07 |
1–150 |
Zn(II) |
0.08 |
1–150 |
The enrichment factors, calculated as ratio of sensitivity of the DMSPE–EDXRF procedure to sensitivity of the direct EDXRF analysis, are 1575, 890, and 810 for Cr, Cu, and Zn, respectively. The total uncertainty of EDXRF determination of Cr(III), Cu(II), and Zn(II) ions by the proposed procedure depends on the errors associated with both preconcentration and measurement steps including counting statistics. The relative standard deviation (RSD), describing total precision of the developed method, obtained for ten replicates containing 10 and 100 ng mL−1 of analyte ions did not exceed 2.3 and 1.5%, respectively. Considering all steps preceding EDXRF determination, as well as uncertainty of measurements, the proposed method can be considered as highly precise. The analytical figures of merit of the proposed method based on the dispersive micro-solid phase extraction on GO-Gly as a solid sorbent are summarized in Table 2.
Table 2 Analytical characteristics of the DMSPE–EDXRF procedure for simultaneous determination of Cr, Cu, and Zn ions (sample volume 50 mL, n = 6)
Parameter |
Analytical feature |
Cr |
Cu |
Zn |
Linear range, ng mL−1 |
1–150 |
1–150 |
1–150 |
Correlation coefficient, R2 |
0.9989 |
0.9983 |
0.9976 |
Detection limit, ng mL−1 |
0.15 |
0.07 |
0.08 |
RSD, % |
|
|
|
For 10 ng mL−1 |
1.9 |
2.1 |
2.3 |
For 100 ng mL−1 |
1.2 |
1.5 |
1.5 |
Enrichment factor |
1575 |
890 |
810 |
Recovery, % |
98 ± 3 |
99 ± 4 |
97 ± 4 |
Effect of coexisting ions
The competition between analyte species and metal ions that normally exists in water samples may disturb sorption efficiency. Therefore, the effect of the typical coexisting ions present in surface waters on the recoveries of the studied metal ions was investigated. For this purpose, a series of sample solutions containing 100 ng mL−1 of analyte ions and different amounts of potentially interfering ions were prepared according to the recommended procedure. A variation of more than 5% in the analyte ions recoveries was considered a critical value. The influence of coexisting ions on determinations of Cr(III), Cu(II), and Zn(II) by the proposed procedure is summarized in Table 3. The results show that commonly encountered concomitant ions such as alkali and alkaline earth cations, and a large number of anions do not interfere at high concentrations, while some of the transition metal ions can interfere at ratios higher than 100-fold. Since the ratio of coexisting ions to analyte ions in natural waters is much lower than the ratio examined in the experiment, the proposed procedure can be applied for determination of Cr(III), Cu(II), and Zn(II) ions in surface waters.
Table 3 Tolerance limits of interfering ions in the determination of 50 ng mL−1 Ni, Cu, and Zn (sample volume 50 mL, n = 3)
Interference species |
Added as |
Analyte to interferent ratio |
Recovery, % |
Cr(II) |
Cu(II) |
Zn(II) |
Na+ |
NaCl |
1 : 1000 |
95 ± 2 |
96 ± 2 |
96 ± 3 |
K+ |
KNO3 |
1 : 1000 |
98 ± 4 |
97 ± 3 |
98 ± 3 |
Mg2+ |
MgCl2 |
1 : 1000 |
99 ± 3 |
98 ± 3 |
99 ± 4 |
NO3− |
KNO3 |
1 : 1000 |
96 ± 2 |
97 ± 3 |
96 ± 2 |
Cl− |
NaCl |
1 : 1000 |
98 ± 3 |
95 ± 2 |
95 ± 4 |
Ca2+ |
CaCl2 |
1 : 500 |
97 ± 4 |
98 ± 4 |
95 ± 3 |
Al3+ |
Al2(SO4)3 |
1 : 500 |
96 ± 3 |
98 ± 2 |
97 ± 4 |
SO42− |
Na2SO4 |
1 : 500 |
99 ± 3 |
96 ± 3 |
96 ± 3 |
CO32− |
Na2CO3 |
1 : 500 |
96 ± 3 |
95 ± 2 |
98 ± 4 |
HCO3− |
NaHCO3 |
1 : 500 |
96 ± 2 |
96 ± 3 |
97 ± 3 |
PO43− |
Na3PO4 |
1 : 500 |
97 ± 4 |
96 ± 3 |
98 ± 4 |
HPO42− |
Na2HPO4 |
1 : 500 |
98 ± 4 |
97 ± 4 |
96 ± 3 |
Mn2+ |
MnCl2 |
1 : 100 |
96 ± 2 |
96 ± 3 |
97 ± 3 |
Pb2+ |
Pb(NO3)2 |
1 : 100 |
98 ± 2 |
95 ± 3 |
98 ± 2 |
Fe3+ |
FeCl3 |
1 : 100 |
96 ± 3 |
97 ± 3 |
95 ± 4 |
Ni2+ |
Ni(NO3)2 |
1 : 100 |
98 ± 3 |
97 ± 3 |
97 ± 3 |
Co2+ |
Co(NO3)2 |
1 : 100 |
96 ± 2 |
97 ± 2 |
98 ± 3 |
Application to analysis of water samples
The proposed DMSPE/EDXRF method was applied for the determination of Cr(III), Cu(II), and Zn(II) ions in water samples. Waters were collected in the Silesian region in Poland. Reliability of the developed procedure was examined using samples spiked with a known concentration of the determined elements. The obtained results are shown in Table 4. The recoveries in the range of 95–102% were satisfactory and confirmed the usefulness of the developed procedure.
Table 4 Analysis of surface waters by the proposed method (n = 6)
Sample |
Element |
Spiked, ng mL−1 |
Determined, ng mL−1 |
Recovery, % |
Tap water |
Cr |
0 |
<DL |
— |
10 |
9.6 ± 0.3 |
96 |
20 |
19.6 ± 0.6 |
98 |
Cu |
0 |
<DL |
— |
10 |
9.6 ± 0.3 |
96 |
20 |
19.8 ± 0.5 |
99 |
Zn |
0 |
<DL |
— |
10 |
10.1 ± 0.4 |
101 |
20 |
19.5 ± 0.6 |
98 |
River water 1 |
Cr |
0 |
5.3 ± 0.4 |
— |
10 |
14.8 ± 0.7 |
97 |
20 |
25.5 ± 0.9 |
101 |
Cu |
0 |
6.8 ± 0.5 |
— |
10 |
16.5 ± 0.8 |
98 |
20 |
26.3 ± 0.7 |
98 |
Zn |
0 |
8.8 ± 0.4 |
— |
10 |
18.3 ± 0.5 |
97 |
20 |
29.1 ± 0.7 |
101 |
River water 2 |
Cr |
0 |
6.6 ± 0.5 |
— |
10 |
15.9 ± 0.8 |
96 |
20 |
25.8 ± 0.7 |
97 |
Cu |
0 |
5.5 ± 0.4 |
— |
10 |
14.7 ± 0.8 |
95 |
20 |
25.9 ± 0.7 |
102 |
Zn |
0 |
9.8 ± 0.6 |
— |
10 |
19.2 ± 0.7 |
97 |
20 |
29.3 ± 0.6 |
98 |
Estuarine water |
Cr |
0 |
4.8 ± 0.3 |
— |
10 |
14.5 ± 0.7 |
98 |
20 |
24.2 ± 0.9 |
98 |
Cu |
0 |
7.5 ± 0.07 |
— |
10 |
17.8 ± 0.8 |
102 |
20 |
27.1 ± 0.6 |
98 |
Zn |
0 |
10.3 ± 0.8 |
— |
10 |
20.6 ± 0.8 |
101 |
20 |
30.1 ± 0.5 |
99 |
Lake water |
Cr |
0 |
5.2 ± 0.3 |
— |
10 |
15.5 ± 0.8 |
102 |
20 |
24.4 ± 0.6 |
97 |
Cu |
0 |
8.3 ± 0.5 |
— |
10 |
17.5 ± 0.7 |
96 |
20 |
27.5 ± 0.8 |
97 |
Zn |
0 |
6.1 ± 0.8 |
— |
10 |
15.7 ± 0.06 |
98 |
20 |
25.3 ± 0.06 |
97 |
Conclusions
A novel sorbent was synthesized by covalent modification of graphene oxide with glycine. The experiments show that GO-Gly is more selective than GO and can quantitatively adsorb Cr(III), Cu(II), and Zn(II) ions from aqueous samples. A large surface area and excellent dispersibility of GO-Gly in water samples is ideal for the development of an effective preconcentration procedure prior to EDXRF determination of analyte ions. The proposed procedure based on combination of DMSPE with EDXRF offers wide linearity, excellent detection limits along with good recoveries, and precisions which can be obtained in an easy and cost-effective way. The DMSPE–EDXRF procedure allows using only 250 μg of the sorbent to perform one experiment. It should be mentioned that in the case of a classical SPE an amount of 100–1000 mg of sorbent is usually required. Moreover, in comparison to preconcentration methods based on SPE and its variations, in which analytes should be transferred into solution prior to measurements, our procedure enables direct EDXRF measurement of metal ions collected on the filter. This approach resolves some commonly occurring problems connected with incomplete and/or irreproducible elution steps and the possibility of analyte loss. Furthermore, elimination of an elution step reduces the risk of sample contamination and analysis time.
References
- Waste Water-Treatment Technologies and Recent Analytical Developments, ed. F. S. García Einschlag and L. Carlos, InTech, 2013, DOI:10.5772/3443 (open access).
- K. Pyrzyńska and M. Trojanowicz, Crit. Rev. Anal. Chem., 1999, 29, 313–321 CrossRef.
- É. A. Souza-Silva, R. Jiang, A. Rodríguez-Lafuente, E. Gionfriddo and J. Pawliszyn, Trends Anal. Chem., 2015, 71, 224–235 CrossRef.
- V. Camel, Spectrochim. Acta, Part B, 2003, 58, 1177–1233 CrossRef.
- J. Li, Y.-B. Wang, K.-Y. Li, Y.-Q. Cao, S. Wu and L. Wu, Trends Anal. Chem., 2015, 72, 141–152 CrossRef CAS.
- R. Sitko, P. Janik, B. Zawisza, E. Talik, E. Marguí and I. Queralt, Anal. Chem., 2015, 87, 3535–3542 CrossRef CAS PubMed.
- B. Hu, M. He and B. Chen, Anal. Bioanal. Chem., 2015, 407, 2685–2710 CrossRef CAS PubMed.
- M. Trojanowicz, Trends Anal. Chem., 2006, 25, 480–489 CrossRef CAS.
- K. Pyrzyńska, Trends Anal. Chem., 2013, 43, 100–108 CrossRef.
- R. Sitko, B. Zawisza and E. Malicka, Trends Anal. Chem., 2013, 51, 33–43 CrossRef CAS.
- V. Georgakilas, M. Otyepka, A. B. Bourlinos, V. Chandra, N. Kim, K. C. Kemp, P. Hobza, R. Zboril and K. S. Kim, Chem. Rev., 2012, 112, 6156–6214 CrossRef CAS PubMed.
- C. N. R. Rao, A. K. Sood, K. S. Subrahmanyam and A. Govindaraj, Angew. Chem., Int. Ed., 2009, 48, 7752–7777 CrossRef CAS PubMed.
- J. Liu, J. Tang and J. J. Gooding, J. Mater. Chem., 2012, 22, 12435–12452 RSC.
- T. Kuila, S. Bose, A. K. Mishra, P. Khanra, N. H. Kim and J. H. Lee, Prog. Mater. Sci., 2012, 57, 1061–1105 CrossRef CAS.
- L. Fan, C. Luo, M. Sun, X. Li and H. Qiu, Colloids Surf., B, 2013, 103, 523–529 CrossRef CAS PubMed.
- I. E. Mejias Carpio, J. D. Mangadlao, H. N. Nguyen, R. C. Advincula and D. F. Rodrigues, Carbon, 2014, 77, 289–301 CrossRef CAS.
- R. Sitko, P. Janik, B. Zawisza, E. Talik, E. Margui and I. Queralt, Anal. Chem., 2015, 87, 3535–3542 CrossRef CAS PubMed.
- C. J. Madadrang, H. Y. Kim, G. Gao, N. Wang, J. Zhu, H. Feng, M. Gorring, M. L. Kasner and S. Hou, ACS Appl. Mater. Interfaces, 2012, 4, 1186–1193 CAS.
- R. Sitko, P. Janik, B. Feist, E. Talik and A. Gagor, ACS Appl. Mater. Interfaces, 2014, 6, 20144–20153 CAS.
- Y. Yuan, G. Zhang, Y. Li, G. Zhang, F. Zhang and X. Fan, Polym. Chem., 2013, 4, 2164–2167 RSC.
- R. K. Sharma, A. Puri, Y. Monga and A. Adholeya, J. Mater. Chem. A, 2014, 2, 12888–12898 CAS.
- F. Zhang, B. Wang, S. He and R. Man, J. Chem. Eng. Data, 2014, 59, 1719–1726 CrossRef CAS.
- J. Li, S. Zhang, C. Chen, G. Zhao, X. Yang, J. Li and X. Wang, ACS Appl. Mater. Interfaces, 2012, 4, 4991–5000 CAS.
- Y. Zhang, H. Chi, W. Zhang, Y. Sun, Q. Liang, Y. Gu and R. Jing, Nano-Micro Lett., 2014, 6, 80–87 CrossRef CAS.
- G. Liu, S. Gui, H. Zhou, F. Zeng, Y. Zhou and H. Ye, Dalton Trans., 2014, 43, 6977–6980 RSC.
- G. Zhao, J. Li, X. Ren, C. Chen and X. Wang, Environ. Sci. Technol., 2011, 45, 10454–10462 CrossRef CAS PubMed.
- H. Yan, H. Li, X. Tao, K. Li, H. Yang, A. Li, S. Xiao and R. Cheng, ACS Appl. Mater. Interfaces, 2014, 6, 9871–9880 CAS.
- J. Bao, Y. Fu and Z. Bao, Nanoscale Res. Lett., 2013, 8, 486–491 CrossRef PubMed.
- T. Yang, L.-H. Liu, J.-W. Liu, M.-L. Chen and J.-H. Wang, J. Mater. Chem., 2012, 22, 21909–21916 RSC.
- L. Liu, C. Li, C. Bao, Q. Jia, P. Xiao, X. Liu and Q. Zhang, Talanta, 2012, 93, 350–357 CrossRef CAS PubMed.
- L. Fan, C. Luo, M. Sun and H. Qiu, J. Mater. Chem., 2012, 22, 24577–24583 RSC.
- V. Chandra, J. Park, Y. Chun, J. W. Lee, I.-C. Hwang and K. S. Kim, ACS Nano, 2010, 4, 3979–3986 CrossRef CAS PubMed.
- X. Liang, S. Liu, S. Wang, Y. Guo and S. Jiang, J. Chromatogr. A, 2014, 1357, 53–67 CrossRef CAS PubMed.
- M. Anastassiades, S. J. Lehotay, D. Stajnbaher and F. J. Schenck, J. AOAC Int., 2003, 86, 412–431 CAS.
- D. C. Marcano, D. V. Kosynkin, J. M. Berlin, A. Sinitskii, Z. Sun, A. Slesarev, L. B. Alemany, W. Lu and J. M. Tour, ACS Nano, 2010, 4, 4806–4814 CrossRef CAS PubMed.
- R. Sitko, Spectrochim. Acta, Part B, 2009, 64, 1161–1172 CrossRef.
- M. Babazadeh, R. Hosseinzadeh-Khanmiri, J. Abolhasani, E. Ghorbani-Kalhor and A. Hassanpour, RSC Adv., 2015, 5, 19884–19892 RSC.
- M. R. Shishehbore, A. Afkhami and H. Bagheri, Chem. Cent. J., 2011, 5, 41–50 CrossRef CAS PubMed.
- M. Behbahani, N. A. G. Tapeh, M. Mahyari, A. R. Pourali, B. G. Amin and A. Shaabani, Environ. Monit. Assess., 2014, 186, 7245–7257 CrossRef CAS PubMed.
- S. Baytak, F. Zereen and Z. Arslan, Talanta, 2011, 84, 319–323 CrossRef CAS PubMed.
- K. Ghanemi, Y. Nikpour, O. Omidvar and A. Maryamabadi, Talanta, 2011, 85, 763–769 CrossRef CAS PubMed.
- Y. Liu, P. Liang and L. Guo, Talanta, 2005, 68, 25–30 CrossRef CAS PubMed.
- N. Zhang, H. Peng and B. Hu, Talanta, 2012, 94, 278–283 CrossRef CAS PubMed.
- M. H. Mashhadizadeh and Z. Karami, J. Hazard. Mater., 2011, 190, 1023–1029 CrossRef CAS PubMed.
- J. S. Suleiman, B. Hu, X. Pu, C. Huang and Z. Jiang, Microchim. Acta, 2007, 159, 379–385 CrossRef.
- Q. He, X. Chang, X. Huang and Z. Hu, Microchim. Acta, 2008, 160, 147–152 CrossRef CAS.
- M. Ghaedi, R. Shabani, M. Montazerozohori, A. Shokrollahi, A. Sahraiean, H. Hossainian and M. Soylak, Environ. Monit. Assess., 2011, 174, 171–186 CrossRef CAS PubMed.
- M. Rajabi, B. Barfi, A. Asghari, F. Najafi and R. Aran, Food Analytical Methods, 2015, 8, 815–824 CrossRef.
- M. A. Karimi, S. Z. Mohammadi, A. Hatefi-Mehrjardi, A. Mohadesi and J. Yarahmadi, J. Anal. Sci. Technol., 2015, 6, 25–35 CrossRef.
|
This journal is © The Royal Society of Chemistry 2016 |
Click here to see how this site uses Cookies. View our privacy policy here.