DOI:
10.1039/C6RA03604J
(Paper)
RSC Adv., 2016,
6, 31976-31987
Analysis of steady state and non-steady state corneal permeation of diclofenac
Received
8th February 2016
, Accepted 20th March 2016
First published on 24th March 2016
Abstract
The present study was undertaken for characterization of the steady state and non steady state corneal permeation kinetics of diclofenac potassium (DCP) using statistical moment theory. Hydrogel films containing DCP in a hydroxypropyl methylcellulose (HPMC) matrix were prepared by a casting method, and the steady state and non-steady state corneal permeation parameters of diclofenac were evaluated using statistical moment analysis. The correlation coefficient (r), coefficient of non-determination and standard error of estimate (SEE) results indicated a good Level “A” correlation between in vitro dissolution and ex vivo steady state permeation of DCP from all the hydrogel formulations. SEM, XRD and DSC studies suggested the inhibition of the crystal growth and partial amorphization of diclofenac in the film. One way analysis of variance (ANOVA) followed by Dunnett's test revealed that all the hydrogel films containing plasticizer (L2, L3 and L4) show very high significant difference of extent of permeation in non-steady state (EPN), extent of permeation in lag time (EPL), extent of permeation in steady state (EPS) and total amount permeated in 360 min (TAP) from the control film containing no plasticizer (L1) related to highly improved permeation. Marked anti-inflammatory activity has been observed after application of the hydrogel film. The binding configuration of DCP-HPMC using docking calculations indicated drug–excipient interaction at the molecular level. Steady state and non-steady state corneal permeation parameters have been evaluated successfully using statistical moment analysis, and highly improved permeation has been observed when compared to the parameters of the film with the control.
1. Introduction
Ocular drug delivery is the most common treatment for diseases and disorders of the cornea such as allergies, conjunctivitis, corneal infections, dry eye, glaucoma etc. However, the bioavailability of topically administered drugs is very poor due to low the permeability of the multi-layered cornea,1,2 rapid nasolacrimal drainage, and absorption into the conjunctiva. Himmelstein et al. and Miller et al. developed ocular physiological models.3,4 Efficiency of new topical agents has been predicted widely using pharmacokinetic and pharmacodynamic models. Absorption into the cornea and conjunctiva is usually described by a first-order process but the corneal permeation profile may not be always a first-order process. It depends on the formulation design of the delivery system.
A constant activity delivery system may not exhibit a steady-state penetration process through a biomembrane.5 An earlier study of amount of butylparaben permeation through guinea pig skin has shown an initial curved stage and then becomes a linear in the latter stage. The initial stage of permeation is called non-steady state condition while in the latter stage, the rate of permeation is constant and the system is called as steady state.6
Development of predictive capability of the event like molecular mass transport across the biological membranes demands keen analysis of its kinetics involved. The drug transport kinetics is influenced by the parameters like drug type, polymorphic form, crystallinity, particle size, solubility and the permeation enhancers in the dosage form.7,8 Drug transport kinetics as realized by mathematical models could have utmost significance with respect to optimization of formulations.9 Andrés-Guerrero et al. built a kinetic ocular model was, in order to predict dexamethasone concentrations in the rabbit eye.10 In the past many investigators11–17 have tested several mathematical models and semi-empirical equation including first-order, Higuchi, and Korsmeyer–Peppas models for model fitting purpose. First order kinetics of drug diffusion is concentration dependent and decrease exponentially with time. Higuchi model diffusion pattern from heterogeneous matrix system is directly proportional to the square root of time and involves tortuosity, which leads to Fickian diffusion. Korsmeyer–Peppas model, a semi empirical equation relates exponential diffusion of drug to the elapsed time. According to Fick's law, mass transfer across a bio-membrane is the reflection of the magnitude of concentration gradient. Flux of eluting species mainly depends on the thermodynamic drag created by the gradient difference between donor and receiver compartment. The whole phenomenon involving dissolution of drug molecule, followed by permeation of the dissolved species is the outcome of two individual steps such as non-steady state and steady state.18–20 Lag time is the predetermined time difference between the time of drug entry into the bio-barrier (non-steady state diffusion) and reach out latter for the steady state.21,22
It has been established by several researchers that drug transit is a stochastic phenomenon where cluster of active therapeutic agent is targeted to the specific biological site of action due to the chance of random scatter.23,24 Moment analysis is a preferred tool in the quiver of statistics for quantification of parameters in biological system. In chemical engineering statistical moment analysis has been employed for the depiction of diffusional behavior of chemical entities in liquid25 and diffusion in a tube.26 Statistical moment analysis, being a non-compartmental approach is well accepted in pharma sector as it permits a comprehensive pharmacokinetic analysis without resort to curve-fitting, computes, or tedious mathematical equations. Many pharmacokinetic parameters of prime significance such as volume of distribution, mean residence time, clearance and bioavailability can be estimated using statistical moment analysis without the complicated non-linear regression approach of compartmental analysis.27–29 Previously, numerous explorations were conceded to characterize corneal permeability mechanism and predicted drug delivery rates to the eye.30,31 Previously several models have been examined to explain drug transport kinetics32,33 and many investigators have characterized in vitro and in vivo correlation employing statistical moment analysis.34–36 Conventional model analysis is the usually applied tool in describing the bio-membrane permeation kinetics.37
The present report has described the mechanism of corneal permeation kinetics of diclofenac potassium (DCP) hydrogel film38 formulation incorporating with triethanolamine (TRE) as plasticizer using conventional mathematical models and statistical moment theory. Mean residence time for non-steady state (MRTN), mean residence time for steady state (MRTS) and mean residence time for permeation (MRTP) were determined statistically by the moment analysis of permeation data. The extent of permeation in non-steady state (EPN), extent of permeation in lag time (EPL), extent of permeation in steady state (EPS) and total amount permeated in 360 min (TAP) were quantified. The surface morphology was explored by scanning electron microscopy (SEM). The crystallinity study was done by X-ray diffractometry (XRD). Coefficient of determination (r2) and standard error of estimate (SEE) were evaluated for establishment of Level “A” correlation between in vitro dissolution and ex vivo steady state permeation at each time point. DCP-HPMC binding configuration was generated using docking calculation to study drug–excipient interaction at molecular level. Extensive literature review revealed that this type of characterization has very rarely been performed earlier.
2. Materials and methods
2.1. Materials
The active compound diclofenac potassium was purchased from Tejani Life care, Cuttack, India and hydroxypropyl methylcellulose (HPMC K15 M) and carrageenan were procured from Himedia Laboratories Pvt. Ltd, India. Triethanolamine was obtained from Merck Ltd, Mumbai, India. All other chemicals were of reagent grades as required.
2.2. Fabrication of hydrogel film for corneal permeation
Hydrogel films containing DCP in HPMC matrix were formulated by casting and solvent evaporation method.39–41 Accurately weighed DCP and TRE were dissolved in ethanol and added to the previously prepared homogeneous dispersion gel of HPMC under stirring. The obtained clear hydrogel mass was poured to Petri dish (Tarsons, diameter: 90 mm) and dried at 40 °C until constant weight. Formulated casting film is composed of DCP (376 mg) and HPMC (1133 mg) including TRE as plasticizer 0, 10, 20, or 30% wt/wt of polymer and the thickness of the film was measured at six points using micrometer gauze (Mitutoyo, Japan).
2.3.
In vitro drug release study
In vitro release study was carried out in 200 ml phosphate buffered saline, pH 7.4 as dissolution medium for 6 h using USP type II apparatus (Electrolab, dissolution tester USP, TDT06L, India). Many reports are available where phosphate buffered saline (pH 7.4, 200 ml) has been used as dissolution medium for in vitro dissolution study of ocular formulations using USP type II dissolution apparatus to simulate tear fluid.42–45 The United States Pharmacopeia also states: “When sink conditions are present, it is more likely that dissolution results will reflect the properties of the dosage form”. Accurately weighed strip of each film was cut and adhered to the glass slide with cyanoacrylate adhesive and placed inside the dissolution vessel. The dissolution was carried out at 34.0 ± 0.5 °C at agitation rate 50 rpm. Aliquots of media were withdrawn at predetermined time through 0.45 μm membrane filter and analyzed spectrophotometrically at 276 nm in triplicate.
2.4.
Ex vivo corneal permeation study
Fresh sheep eyes were collected from slaughter house within 1 h of its sacrifice. The cornea with attached 5–6 mm wide scleral ring was excised from the whole eye. After applying a properly cut piece of film on the center, the dissected cornea was mounted in the diffusion cell apparatus.46 The corneal epithelium was placed facing the donor compartment vertically with an effective area of 1.43 cm2 and the diffusion media (phosphate buffered saline, pH 7.4) was placed in the receptor compartment. The diffusion was continued for 6 h at 34 °C under constant stirring in triplicate. Withdrawn samples (10 ml) at regular intervals were filtered through a 0.45 μm membrane filter and recorded at 276 nm using UV-VIS spectrophotometer (JASCO V-630 spectrophotometer, Software: Spectra Manager).
2.5. Permeation kinetics and statistical moment analysis
Permeation kinetics through corneal tissue was evaluated using various mathematical models like first order, Higuchi, and Korsmeyer–Peppas model equations.12 The lag time of permeation, time required up to 50% permeation, permeation rate constant, permeation exponent (n) and coefficient of determination (r2) were estimated as per model regression equation. Further, estimated lag time of permeation, time required up to 50% permeation, permeation rate constant and permeation flux for steady state were also calculated from the x-intercept of the linear region of corneal permeation profile using regression analysis.47
Mean residence time for non-steady state (MRTN), mean residence time for steady state (MRTS) and mean residence time for permeation (MRTP) were determined statistically by the moment analysis of permeation data. The extent of permeation in non-steady state (EPN), extent of permeation in lag time (EPL), extent of permeation in steady state (EPS) and total amount permeated in 360 min (TAP) were quantified. The highest non-steady state and steady state parameters were elucidated from permeation profile according to Fick's law of diffusion. Following relations were employed for elucidation of MRTN, MRTS and MRTP using the first moment of amount of drug permeated vs. time curve.
| | | MRTN = AUMC(0–120)/AUC(0–120) | (1) |
| | | MRTS = AUMC(120–360)/AUC(120–360) | (2) |
| | | MRTP = AUMC(0–360)/AUC(0–360) | (3) |
where, AUMC is the area under the product of amount permeated and time (the first moment AUC)
versus time curve. AUMC
(0–120) was calculated from initial sampling time to sampling at 120 min and AUMC
(120–360) was derived from 120 min to last sampling time employing MATLAB 7.0 software. AUMC
(0–360) is the summation of AUMC
(0–120) and AUMC
(120–360). Extent of permeation in non-steady state (EPN), extent of permeation in lag time (EPL), extent of permeation in steady state (EPS) and total amount permeated up to 360 min (TAP) were evaluated from the amount permeation
vs. time profile to understand the effect of TRE on permeation threshold of the films.
One way analysis of variance (ANOVA) was applied to compare the effect of formulation variable on different steady and non steady state parameters such as EPN, EPL, EPS and TAP employing XLSTAT software.48 Two sided Dunnett's test was performed for pair wise comparison with the control (L1 containing 0% plasticizer) as L1 vs. L2 (10% plasticizer), L1 vs. L3 (20% plasticizer) and L1 vs. L4 (30% plasticizer).
Level “A” correlation between in vitro dissolution and ex vivo steady state permeation at each time point has been determined. The accuracy of predictions has been made with the regression line by determining standard error of estimate (SEE) which measures unexplained variation. Coefficient of determination (r2) and standard error of estimate (SEE) were evaluated for establishment of Level “A” correlation between in vitro dissolution and ex vivo steady state permeation at each time point.
2.6. Surface morphology and crystallinity of the film
Surface morphology of the films was investigated using scanning electron microscope (JSM-6390, JEOL, Tokyo, Japan). Prior to imaging the dried samples were mounted on metal stab for gold coating under applied vacuum. The photomicrographs were taken at different magnifications employing electron imaging operating at an accelerated voltage of 10 kV. The XRD pattern of pure diclofenac and the films were recorded using X-ray diffractometer (Model: Philips analytical X-ray with PC-APD, Diffraction Software). The voltage and current were 40 kV and 15 mA, respectively. Anode Material Cu, K-Alpha (radiation 1.5406 Å) was used as a source of X-rays. Measurements were undertaken at a scan speed of 1° min−1 for the scanning angle ranging from 10° to 60° (2θ). Differential scanning calorimetry (Universal V4.2E TA Instruments) was employed to analyze the thermal behavior and crystallinity of the pure drug and formulated films. Samples (about 2–3 mg) were weighed into an aluminum pan and scanning was carried out at a rate of 10 °C min−1 at temperatures between 30 °C and 330 °C, using a nitrogen gas purge at 50 ml min−1.
2.7. Conjunctival anti-inflammatory study
New Zealand albino male rabbits (three animals) weighing about 3 to 3.2 kg were employed for the conjunctival anti-inflammatory study. Approval for the use of animals in this study was obtained from the SOA University Animal Ethics Committee (SOA University, Odisha, India, Reg. no. 1171/C/08/CPCSEA). The inflammation was induced by subconjuctival injection of carrageenan. Prior to induction of inflammation the eye of the animal was anesthetized by Proparacaine Hydrochloride Ophthalmic Solution USP 0.5%. Then carrageenan (200 μl, 3% saline solution) was injected into the upper palpebral region of the anesthetized eye.49 Micro syringe (Dispo van 30G, India) fitted with 30 gauge needle was used to serve the purpose. One hour after carrageenan injection when inflammation was induced to the marked extent a small piece of the film (L4, about 3 mm/1.5 mm) was placed in the cul-de-sac and the anti inflammatory activity of the film has been recorded.
2.8. Conformational analysis by molecular modeling
In the film formulation diclofenac molecule remained in dispersed state in the HPMC matrix. The computer-aided molecular modeling approach was used for conformational analysis of drug–polymer complexation during dispersions. The molecular structures of drug and polymer were drawn and 3D molecular models were generated using MARVIN DRAW software (ChemAxon, Budapest, Europe). The drug–polymer complex was architecturally prepared by docking in the software AUTODOCK VINA.50 Further processing and visualization was performed in Open Babel 2.3.1 and Discovery studio 3.5 (Accelrys) software respectively. Only one repeat unit of HPMC was built for interaction due to the following reasons: (a) one repeat unit contained all different atom groups, (b) the calculation of a single repeat unit was economical.51
3. Results and discussion
3.1. Kinetics of permeation
All the formulated films (L1, L2, L3 and L4) have shown uniform thickness (244 ± 9, 245 ± 4, 242 ± 6 and 246 ± 5 μ respectively). Dissolution profile of diclofenac film formulations (Fig. 1) showed a steady increase in drug release with the increase in triethanolamine content in the film. When compared with the control film without TRE (L1), the film L2, L3 and L4 demonstrated a gradual increase in drug release. Fig. 2 depicts the amount of drug permeated from formulated films at 34 °C as a function of time. An increasing trend of amount permeation was observed with increasing TRE content in presence of HPMC. Amount permeation of different formulations was found in the following order as: L1 (control) < L2 < L3 < F4. Several mathematical models such as first order, Higuchi and Korsmeyer–Peppas model were examined for kinetic modeling of permeation data of diclofenac hydrogel formulation and data was tabulated in Table 1. After model fitting as per first order (r2 values 0.955 to 0.986) and Higuchi model (r2 values 0.916 to 0.970) estimated lag time of permeation (tf,lag, and th,lag respectively) was evaluated and reported in Table 1. Also depicted the estimated time required up to 50% permeation (tf,50%, th,50%, and tkp,50%) as per first order, Higuchi and Korsmeyer–Peppas (r2 values 0.967 to 0.990) equation respectively. kf and kh are the calculated permeation rate constant as per first order and Higuchi equation respectively. Permeation exponent estimated from Korsmeyer–Peppas equation (n values 2.16 to 2.93) indicates that permeation mechanism of all the hydrogel films are fully under diffusion control. Kinetic modeling of permeation data clearly confirmed the positive influence on the permeation as TRE increased in the formulation.
 |
| | Fig. 1 Dissolution profiles of diclofenac potassium film formulation. | |
 |
| | Fig. 2 Permeation profiles of diclofenac potassium film formulation across cornea at 34 °C. | |
Table 1 Kinetic modeling of permeation data of diclofenac film formulationa
| Film code |
First order |
Higuchi |
Korsmeyer–Peppas |
|
t
f,lag (min) |
t
f,50% (min) |
k
f (min−1) |
r
2
|
t
h,lag (min) |
t
h,50% (min) |
k
h (% rel−1/2) |
r
2
|
t
kp,50% (min) |
n
|
r
2
|
|
t
f,lag, and th,lag are the estimated lag time of permeation as per first order and Higuchi model respectively; tf,50%, th,50%, and tkp,50% are the estimated time required up to 50% permeation as per first order, Higuchi and Korsmeyer–Peppas equation respectively; kf and kh are the calculated permeation rate constant as per first order and Higuchi equation respectively; n is the permeation exponent estimated from Korsmeyer–Peppas equation.
|
| L1 |
53.0 |
579.6 |
0.0013 |
0.955 |
57.0 |
199.2 |
0.356 |
0.916 |
340.2 |
2.93 |
0.990 |
| L2 |
39.9 |
493.8 |
0.0016 |
0.986 |
37.8 |
176.4 |
0.389 |
0.945 |
315.0 |
2.16 |
0.967 |
| L3 |
37.4 |
450.6 |
0.0017 |
0.967 |
36.6 |
169.8 |
0.407 |
0.947 |
276.6 |
2.50 |
0.982 |
| L4 |
31.7 |
387.6 |
0.0025 |
0.974 |
32.4 |
139.8 |
0.521 |
0.970 |
226.8 |
2.17 |
0.980 |
It has been cleared from literature that though the permeation follows Korsmeyer–Peppas model kinetics, its rate is not only limited to drug diffusion but also to the factors like polymeric chain relaxation52 affected by plasticizer and surfactant effect by preservative. TRE as plasticizer, played important role in polymeric chain relaxation and flexibility and permitted easy ingress of drug molecule. Permeation of drug through a bio-membrane conventionally can be characterized by non steady state and steady state. Lag time is the transient component of permeation process, achieved from fixed time differentiation monitored between the time of corneal drug entry and the time at which the permeation rate reaches a steady state. The lag time (tss,lag) was estimated from the x-intercept of the linear region of permeation profile using regression analysis. Steady state permeation parameters of the film formulations are reported in Table 2. It was evident that the value of the lag time has been tagged on to a paradigm with respect to plasticizer concentration. Gradual reduction in tss,lag was observed as the plasticizer concentration increased. Triethanolamine, a hydrophilic plasticizer containing hydroxyl and amino functions in the film formulation decreased the lag time of permeation from 29.4 to 17.4 min when its concentration was varied from 0 to 30%. Fundamental relationship of Fick's first law used in the pharmaceutical diffusion process was applied for the estimation of tss50%, steady state rate constant (kss) and permeation flux (Jss). Parameters indicating improved permeation (tss50%, values 459.6 to 345.0 min; kss values 0.134 to 0.151 μg min−1 and Jss values 4.55 to 5.70 μg cm−2 min−1) were also resulted by the increased content of TRE in the film formulation. Since water, butanol, and glycerol are very small molecule and high hydrophilic compounds their permeability across the intact cornea is significantly larger53 than that of lomefloxacin hydrochloride and dexamethasone. Yasueda et al., (2007) performed diffusion experiment through rabbit intact cornea with test solution of 0.3% lomefloxacin hydrochloride (hydrophilic drug) in 2.6% glycerine (pH 5.0) and 0.008% dexamethasone (hydrophobic drug) in receptor buffer of pH 7.2 and flux value was found to be 0.011 and 0.1368 μg cm−2 min−1 respectively.54 They have also estimated the lag time of permeation as 48 and 60 min respectively. The results of present investigation have revealed the significant improvement of ocular permeability DCP.
Table 2 Corneal permeation parameters for steady statea
| Film code |
t
ss,lag (min) |
t
ss,50% (min) |
k
ss (μg min−1) |
J
ss (μg cm−2 min−1) |
r
2
|
|
t
ss,lag, tss,50%, kss and Jss are the estimated lag time of permeation, time required up to 50% permeation, permeation rate constant and permeation flux for steady state respectively.
|
| L1 |
29.4 |
459.6 |
0.134 |
4.55 |
0.994 |
| L2 |
21.6 |
379.2 |
0.136 |
5.15 |
0.992 |
| L3 |
19.2 |
366.6 |
0.146 |
5.34 |
0.965 |
| L4 |
17.4 |
345.0 |
0.151 |
5.70 |
0.990 |
Permeation parameters MRTN, MRTS and MRTP were estimated by the statistical moment analysis and depicted in Table 3. Increase in TRE from 0 to 30% lowered the MRTN from 106.2 to 94.2 min. Analogous reduction pattern in MRTS (273.6 to 261.0 min) and MRTP (269.4 to 248.4 min) was followed with the increase in TRE. Increased loading of TRE acted as the permeation booster and improved permeation by breaking the physiological barriers of the corneal tissue. Films with lower plasticizer concentration possessed higher retention values as a sign of permeation retardation. Extent of permeation in non-steady state (EPN), extent of permeation in lag time (EPL), extent of permeation in steady state (EPS) and total amount permeated in 360 min (TAP) were evaluated from the amount permeation vs. time profile (Table 3) to understand the effect of TRE on permeation threshold of the films.
Table 3 Steady state and non-steady state corneal permeation parameter using statistical moment analysisa
| Film code |
MRTN (min) |
MRTS (min) |
MRTP (min) |
EPN (μg) |
EPL (μg) |
EPS (μg) |
TAP (μg) |
|
MRTN = mean residence time for non-steady state MRTS = mean residence time for steady state MRTP = mean residence time for permeation EPN = extent of permeation in non-steady state EPL = extent of permeation in lag time EPS = extent of permeation in steady state TAP = total amount permeated in 360 min.
|
| L1 |
106.2 ± 8.23 |
273.6 ± 31.57 |
269.4 ± 12.53 |
228.0 ± 5.86 |
2.12 ± 0.12 |
1555.0 ± 13.58 |
1783.0 ± 26.83 |
| L2 |
100.2 ± 11.53 |
267.0 ± 31.45 |
259.2 ± 8.03 |
493.0 ± 5.39 |
4.36 ± 0.47 |
1769.0 ± 17.35 |
2262.0 ± 24.39 |
| L3 |
99.6 ± 24.12 |
265.2 ± 5.78 |
256.8 ± 14.31 |
669.0 ± 14.11 |
12.13 ± 0.26 |
1951.0 ± 7.59 |
2620.0 ± 13.48 |
| L4 |
94.2 ± 7.02 |
261.0 ± 13.75 |
248.4 ± 7.53 |
727.0 ± 12.82 |
14.95 ± 1.47 |
1980.0 ± 22.11 |
2707.0 ± 53.34 |
Fisher's F test was used here and the probability corresponding to the F values in the cases of all parameters are 0.0001. It means that we would take a 0.01% risk to conclude that the null hypothesis (no effect of the film formulation variable) is wrong. So it can be concluded with confidence that there is an effect of the film formulation on the magnitude of parameters. It also can be noted that the r values corresponding to different parameters are good (0.991, 0.997, 0.956 and 0.992). This means all the information offering a complementary explanation of the variations of the parameters that has been established. Further, Dunnett's test revealed that all the formulations are significantly different from the control (L1 containing 0% plasticizer) when comparison was made pair wise with the control as L1 vs. L2 (10% plasticizer), L1 vs. L3 (20% plasticizer) and L1 vs. L4 (30% plasticizer) with less than 0.09% risk (Table 4). Influence of TRE in the film (L1, L2, L3 and L4) on corneal permeation EPN, EPL, EPS and TAP has been shown in Fig. 3. Means chart of observed and predicted EPN, EPL, EPS and TAP of four formulations has also been presented in Fig. 4 to understand the limit of prediction.
Table 4 Dunnett two sided analysis of the differences between the control category L1 and the other catagories with a confidence interval of 95%
| |
Category |
Difference |
Standardized difference |
Critical value |
Critical difference |
Pr > Diff |
Significant |
| EPN |
L1 vs. L4 |
−499.333 |
−27.338 |
2.880 |
52.598 |
0.00001 |
Yes |
| L1 vs. L3 |
−441.000 |
−24.145 |
2.880 |
52.598 |
0.00001 |
Yes |
| L1 vs. L2 |
−265.333 |
−14.527 |
2.880 |
52.598 |
0.00001 |
Yes |
| EPL |
L1 vs. L4 |
−12.823 |
−46.667 |
2.880 |
0.791 |
0.00001 |
Yes |
| L1 vs. L3 |
−10.003 |
−36.405 |
2.880 |
0.791 |
0.00001 |
Yes |
| L1 vs. L2 |
−2.233 |
−8.128 |
2.880 |
0.791 |
0.00001 |
Yes |
| EPS |
L1 vs. L4 |
−425.000 |
−11.694 |
2.880 |
104.663 |
0.00001 |
Yes |
| L1 vs. L3 |
−396.333 |
−10.905 |
2.880 |
104.663 |
0.00001 |
Yes |
| L1 vs. L2 |
−214.333 |
−5.897 |
2.880 |
104.663 |
0.0009 |
Yes |
| TAP |
L1 vs. L4 |
−923.667 |
−27.500 |
2.880 |
96.723 |
0.00001 |
Yes |
| L1 vs. L3 |
−836.667 |
−24.910 |
2.880 |
96.723 |
0.00001 |
Yes |
| L1 vs. L2 |
−479.000 |
−14.261 |
2.880 |
96.723 |
0.00001 |
Yes |
 |
| | Fig. 3 Influence of film on EPN, EPL, EPS and TAP of corneal permeation. | |
 |
| | Fig. 4 Means chart of observed versus predicted EPN, EPL, EPS and TAP of four formulations. | |
The correlation coefficient and regression equation of in vitro dissolution and steady state ex vivo permeation (Fig. 5) have been tabulated in Table 5. In the present study correlation coefficient (0.9803–0.9990) of in vitro dissolution and steady state ex vivo permeation of the films indicated a good Level “A” correlation-ship between them. The good correlation-ship indicated batch to batch consistency in the ex vivo performance of the films by the use of such in vitro values.
 |
| | Fig. 5 Correlation of in vitro dissolution and steady state ex vivo permeation at the same time point. | |
Table 5 Level “A” correlation between in vitro dissolution and ex vivo steady state permeation
| Film code |
r
|
Regression equation |
Coefficient of non-determinationa (%) |
Standard error of estimate |
|
The coefficient of non-determination is the percent of variation which is unexplained by the regression equation.
|
| L1 |
0.9930 |
y = 1.606x − 5120 |
1.4 |
0.0683 |
| L2 |
0.9808 |
y = 1.981x − 6984 |
3.8 |
0.1125 |
| L3 |
0.9990 |
y = 1.997x − 6395 |
2.0 |
0.0258 |
| L4 |
0.9803 |
y = 2.052x − 7529 |
3.9 |
0.1140 |
3.2. Characterization of hydrogel film
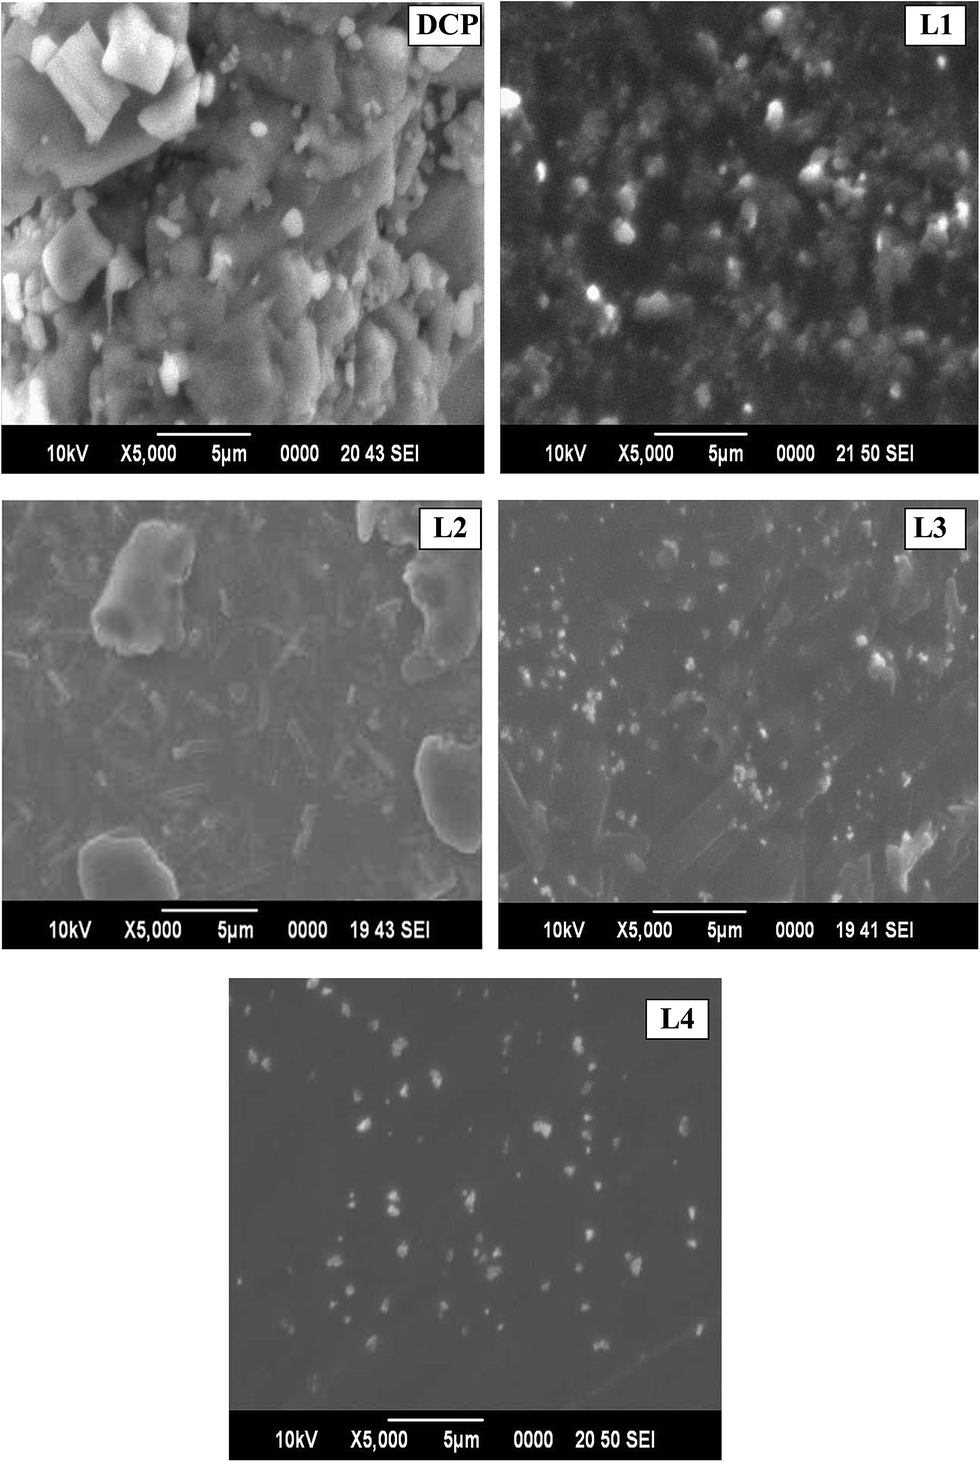
Photomicrograph of pure DCP contains distinct compact drug crystals in micron scale (Fig. 6). All the films were microporous and of uniform surface morphology due to homogeneous mixing of dug crystal in the polymer matrix of HPMC. Here, HPMC played a key role as drug crystal growth inhibitor and a habit modifier.55 Keen observation demonstrated that film without plasticizer (L1) presented a relatively irregular, rigid, packed and porous surface with embedded minute drug crystals. Films with plasticizer and preservatives exhibited a smoother and continuous surface (L2, L3 and L4). Crystals grown in the film in presence of TRE were found smaller than the crystals grown without TRE. The XRD spectra and DSC thermograms of the diclofenac potassium and drug loaded polymeric films were portrayed in Fig. 7(a) and (b). The characteristic peaks appearing at 13.25, 20.40, 21.07, 25.24, 26.17, 30.15 and 26.82 2θ values in the XRD pattern of diclofenac potassium clearly revealed the crystalline nature of the drug. The increase of the full width at half maximum (FWHM) of all the films with respect to DCP supported molecular dispersion of pure drug and polymer. Reduced intensity signals of L1 (without TRE) were attributable to the partial amorphization of the drug under the influence of HPMC only. The absence of prominent peaks in the diffractogram of other film formulations (L2, L3 and L4) confirmed the existence of the drug in microcrystalline form in the polymer matrix. It may be inferred from the study that a major portion of the drug incorporated existed as solid–solid solution in the polymer matrix where as the small remaining fraction has been crystallized in the microcrystalline and amorphous form in the polymeric matrices. The exothermic peak at 313.2 °C in DSC thermogram of pure drug is the outcome of drug decomposition without melting.56 In the films no endothermal or exothermal peaks for DCP are observed near 313.2 °C. This is possibly due to the transformation of drug from crystalline to amorphous or microcrystalline state. The molecular dispersion of diclofenac in polymeric matrix of HPMC is seemed to be protecting the drug from decomposition by formation of hydrogen bonding forming with the drug. Each film exhibited similar thermal behavior. The wide endothermic peaks at 70 to 100 °C correspond to moisture loss from HPMC in the films.57–59 The glass transition temperature can be used as a measurement for the mobility of the macromolecules and also give information about the molecular mobility of the drug and changes at its semi-crystalline state. Glass transition of DCP in the films was manifested through a small step-like formation in the range of 210 to 219 °C. DSC thermogram of 6-mercaptopurine-HPMC granules prepared by wet granulation technique showed a markedly reduced intensity of endothermic peak of drug indicating amorphization of drug.60 Panda et al.59 reported the disappearance of melting endotherm in the DSC thermogram of HPMC matrix film containing telmisartan suggesting possible molecular dispersion of drug in polymeric matrix. A decrease in the melting endothermic onset and a reduction of the melting enthalpy of diclofenac were reported in the DSC thermogram of diclofenac and HPMC physical mixture (1![[thin space (1/6-em)]](https://www.rsc.org/images/entities/char_2009.gif) :1) suggesting a probable eutectic formation between drug and polymer.61
:1) suggesting a probable eutectic formation between drug and polymer.61
 |
| | Fig. 6 Scanning electron micrographs of diclofenac potassium pure drug crystals (DCP) 5000×; and film formulations in HPMC matrix: (L1) 5000×; (L2) 5000×; (L3) 5000×; (L4) 5000×. | |
 |
| | Fig. 7 (a) XRD pattern and (b) DSC thermograms of pure drug (DCP) and film formulations. | |
3.3. Conjunctival anti-inflammatory study
Fig. 8(a)–(g) summarizes the stages of anti inflammatory study conducted. Signs of inflammation such as conjunctival swelling and redness were visible after one hour of the carrageenan injection and intensity of symptoms were increased gradually there after. Fig. 8(a) shows the carrageenan injection to upper palpebral region of eye. Normal rabbit eye before injection and inflammatory condition of the eye after 1 hour of injection (acute inflammation) have been shown in Fig. 8(b) and (c) respectively. Fig. 8(d) shows the film just after applying in the eye. After 1 hour of film application inflammation has been subsided partially and the film has been partially swelled and eroded (Fig. 8(e)). Two hour after film application inflammation subsided almost fully and residual film was left (Fig. 8(f)). Film dimension used for the study has presented in Fig. 8(g).
 |
| | Fig. 8 Conjunctival anti-inflammatory study: (a) carrageenan injection to upper palpebral region of eye; (b) normal rabbit eye before injection; (c) inflammatory condition of the eye after 1 hour of injection (acute inflammation); (d) just after applying hydrogel film in the eye; (e) after 1 hour of film application (inflammation subsided partially and the film has been partially swelled and eroded); (f) 2 hour after film application (inflammation subsided almost fully and residual film is left); (g) film dimension used for the study. | |
3.4. Conformational analysis by molecular modeling
Docking can explore the fitting of two molecules with a stable configuration and a favorable energy. The docked complexes of diclofenac with HPMC were selected in terms of the free energy of binding and the statistic information of the population of the complexes. The free energy of binding included intermolecular energy (vander Waals, H-bonding interactions, desolvation, and electrostatic energies) and torsional free energy. An advantage of this docking is that it supplies not only the possible physical interactions but also the possible complex configuration. Fig. 9(a) and (b) portrays the protein data bank structure of DCP and HPMC respectively. The study revealed that a definitive energy minimization was possible for drug and drug–polymer complex. The best docked DCP-HPMC (Fig. 9(c)) complex had a binding energy of −2.5 kcal mol−1. It has been confirmed that there is the possibility for formation of a complex between drug and polymer as evident from the energy-minimized structure of the drug–polymer complex. The drug molecule was able to bind with polymer at the free alkyl groups by formation of hydrogen bonding. The negative docking energy of the complex formation corresponds with solubility enhancement leading to a more stable nature of the drug–polymer complex.
 |
| | Fig. 9 (a) Pdb structure of DCP; (b) Pdb structure of HPMC; (c) docked structure of DCP and HPMC. | |
4. Conclusions
Kinetic modeling of corneal permeation data using conventional first order, Higuchi and Korsmeyer–Peppas equation clearly confirmed the positive influence on the permeation as TRE increased in the hydrogel films formulation. Statistical moment analysis could be utilized successfully for estimation of non steady state and steady state corneal permeation parameters MRTN, MRTS and MRTP. Highly improved values of EPN, EPL, EPS and TAP of the hydrogel formulations were observed when compared with the control film. Level “A” correlation between in vitro dissolution and ex vivo steady state permeation has been established to ensure batch-to-batch consistency in the biological performance of diclofenac potassium. Hydrogel formulation characterization by SEM and XRD suggested the inhibition of the crystal growth and partial amorphisation of diclofenac in the film. Anti inflammatory activity has been noticed after application of the hydrogel film distinctly. DCP-HPMC interaction at molecular level has been confirmed using binding configuration and docking calculation.
Conflicts of interest
Authors declare no conflicts of interest.
Acknowledgements
The authors are acknowledging gratefulness to the Department of Science & Technology, Ministry of Science & Technology, New Delhi, India, for providing INSPIRE fellowship to Mr Rajaram Mohapatra (IF 10199). The authors are also very much thankful to Prof. Manoj Ranjan Nayak, President, Siksha O Anusandhan University for providing other facilities and encouragement. Authors are also grateful to the editor and anonymous reviewers for their valuable comments and suggestions.
References
- P. W. J. Morrison, C. J. Connon and V. V. Khutoryanskiy, Mol. Pharmaceutics, 2013, 10, 756–762 CrossRef CAS PubMed.
-
V. V. Khutoryanskiy, Mucoadhesive materials and drug delivery systems, John wiley & Sons Ltd, London, 2014 Search PubMed.
- K. J. Himmelstein, I. Guvenir and T. F. Patton, J. Pharm. Sci., 1978, 67, 603–606 CrossRef CAS PubMed.
- S. C. Miller, K. J. Himmelstein and T. F. Patton, J. Pharmacokinet. Biopharm., 1981, 9, 653–677 CrossRef CAS PubMed.
- S. Pattnaik, K. Swain, J. V. Rao, V. Talla, K. B. Prusty and S. K. S. Ubudhi, RSC Adv., 2015, 5, 74720–74725 RSC.
- H. Komatsu and M. Suzuki, J. Pharm. Sci., 1979, 68, 596–598 CrossRef CAS PubMed.
- K. Tojo, Chem. Pharm. Bull., 2004, 52, 1290–1294 CrossRef CAS PubMed.
- S. Pattnaik, K. Swain, J. V. Rao, V. Talla, K. B. Prusty and S. K. Subudhi, RSC Adv., 2015, 5, 91960–91965 RSC.
- S. Dash, P. N. Murthy, L. Nath and P. Chowdhury, Acta Pol. Pharm., 2010, 67, 217–223 CAS.
- V. Andrés-Guerrero, M. Zong, E. Ramsay, B. Rojas, S. Sarkhel, B. Gallego, R. de Hoz, A. I. Ramírez, J. J. Salazar, A. Triviño, J. M. Ramírez, E. M. Del Amo, N. Cameron, B. de-Las-Heras, A. Urtti, G. Mihov, A. Dias and R. Herrero-Vanrell, J. Controlled Release, 2015, 211, 105–117 CrossRef PubMed.
- S. A. Abdel-Hameed, A. M. El-Kady and M. A. Marzouk, Mater. Sci. Eng., C, 2014, 44, 293–309 CrossRef CAS PubMed.
- A. Hadjitheodorou and K. George, Mater. Sci. Eng., C, 2014, 42, 681–690 CrossRef CAS PubMed.
- S. Mallick, B. K. Gupta and S. K. Ghoshal, Acta Pol. Pharm., 1999, 56, 289–295 CAS.
- S. Mallick, B. K. Gupta and S. K. Ghoshal, J. Sci. Ind. Res., 1999, 58, 1010–1016 CAS.
- S. Mallick, A. Sahu and K. Pal, Acta Pol. Pharm., 2004, 61, 21–30 CAS.
- D. Ramyadevi and K. S. Rajan, RSC Adv., 2015, 5, 12956–12973 RSC.
- É. A. Estracanholli, F. S. G. Praça, A. B. Cintra, M. B. Pierre and M. G. Lara, AAPS PharmSciTech, 2014, 15, 1468–1475 CrossRef PubMed.
- R. J. Scheuplein, J. Invest. Dermatol., 1967, 48, 79–88 CrossRef CAS PubMed.
- S. Mallick, S. Pattnaik, K. Swain and P. K. De, Drug Dev. Ind. Pharm., 2007, 33, 865–873 CrossRef CAS PubMed.
- S. Pattnaik, K. Swain, P. Choudhury, P. K. Acharya and S. Mallick, International Brazilian Journal of Urology, 2009, 35, 716–729 CrossRef PubMed.
- H. Tang, D. Blankschtein and R. Langer, J. Pharm. Sci., 2002, 91, 1891–1907 CrossRef CAS PubMed.
- R. Ash, J. Membr. Sci., 1996, 117, 79–108 CrossRef CAS.
- S. Riegelman and P. Collier, J. Pharmacokinet. Biopharm., 1980, 8, 509–534 CrossRef CAS PubMed.
- K. Yamaoka, T. Nakagawa and T. Uno, J. Pharmacokinet. Biopharm., 1978, 6, 547–558 CrossRef CAS PubMed.
-
Y. Kwon, Handbook of Essential Pharmacokinetics, Pharmacodynamics and Drug Metabolism for Industrial Scientists, Springer press, New York, 9th edn, 2002 Search PubMed.
- R. Aris, Proc.-R. Soc. Edinburgh, Sect. A: Math. Phys. Sci., 1956, 235, 67–77 CrossRef.
- Y. I. Kim, R. Pradhan, B. K. Paudel, J. Y. Choi, H. T. Im and J. O. Kim, Arch. Pharm. Sci. Res., 2015, 38, 2163–2171 CrossRef CAS PubMed.
- S. Mallick, B. K. Gupta and S. K. Ghosal, Acta Pol. Pharm., 2000, 57, 175–180 CAS.
- S. Mallick, B. K. Gupta and S. K. Ghosal, Indian J. Pharm. Sci., 2000, 62, 303–306 Search PubMed.
- M. Ahuja and D. C. Bhatt, RSC Adv., 2015, 5, 82363–82373 RSC.
- L. R. Schopf, A. M. Popov, E. M. Enlow, J. L. Bourassa, W. Z. Ong, P. Nowak and H. Chen, Translational vision science & technology, 2015, 4, 1–12 Search PubMed.
- L. R. Schopf, E. Enlow, A. Popov, J. L. Bourassa and H. Chen, Ophthalmology and Therapy, 2014, 3, 63–72 CrossRef PubMed.
- M. J. Coffey, H. H. Decory and S. S. Lane, Clin. Ophthalmol., 2013, 7, 299–312 CAS.
- S. Yamamura, F. Aida, Y. Momose and E. Fukuoka, Drug Dev. Ind. Pharm., 2000, 26, 1–6 CrossRef CAS PubMed.
- G. Schliecker, C. Schmidt, S. Fuchs, E. Ehinger, J. Sandow and T. Kissel, J. Controlled Release, 2004, 94, 25–37 CrossRef CAS PubMed.
- G. C. Athanassiou, D. M. Rekkas and N. H. Choulis, Int. J. Pharm., 1993, 90, 51–58 CrossRef CAS.
- A. Pedacchia and A. Adrover, Chem. Eng. Res. Des., 2014, 92, 2550–2556 CrossRef CAS.
- D. Das and S. Pal, RSC Adv., 2015, 5, 25014–25050 RSC.
- K. Swain, S. Pattnaik and S. Mallick, J. Drug Targeting, 2010, 18, 106–114 CrossRef CAS PubMed.
- K. Swain, S. Pattnaik, S. C. Sahu and S. Mallick, Lat. Am. J. Pharm., 2009, 28, 706–714 CAS.
- S. Pattnaik, K. Swain, A. Bindhani and S. Mallick, Drug Dev. Ind. Pharm., 2011, 37, 465–474 CrossRef CAS PubMed.
- M. Al-Ghabeish, X. Xu, Y. S. Krishnaiah, Z. Rahman, Y. Yang and M. A. Khan, Int. J. Pharm., 2015, 495, 783–791 CrossRef CAS PubMed.
- P. B. Deshpande, P. Dandagi, N. Udupa, S. V. Gopal, S. S. Jain and S. G. Vasanth, Pharm. Dev. Technol., 2010, 15, 369–378 CrossRef CAS PubMed.
- X. Xu, M. Al-Ghabeish, Z. Rahman, Y. S. Krishnaiah, F. Yerlikaya, Y. Yang, P. Manda, R. L. Hunt and M. A. Khan, Int. J. Pharm., 2015, 493, 412–425 CrossRef CAS PubMed.
- H. Kao, H. Lin, Y. Lo and S. Yu, J. Pharm. Pharmacol., 2006, 58, 179–186 CrossRef CAS PubMed.
- M. Rodriguez-Aller, D. Guillarme, M. E. Sanharawi, F. Behhar-Cohen, J. L. Veuthey and R. Gurny, J. Controlled Release, 2013, 170, 153–159 CrossRef CAS PubMed.
- S. D. Palma, L. I. Tartara, D. Quinteros, D. A. Allemandi, M. R. Longhi and G. E. Granero, J. Controlled Release, 2009, 138, 24–31 CrossRef CAS PubMed.
-
https://help.xlstat.com/customer/en/portal/articles/2062232runningaonewayanovafollowedbymultiplecomparisonstestswithxlstat?b_id=9283
.
- M. Kato, Y. Hagiwara, T. Oda, M. Imamura-Takai, H. Aono and M. Nakamura, J. Ocul. Pharmacol. Ther., 2011, 27, 353–360 CrossRef CAS PubMed.
- O. Trott and A. J. Olson, J. Comput. Chem., 2010, 31, 455–461 CAS.
- C. Li, J. X. Wang, Y. Le and J. F. Chen, Mol. Pharmaceutics, 2013, 10, 2362–2369 CrossRef CAS PubMed.
- M. G. A. Vieira, M. A. Silva, L. O. Santos and M. M. Beppu, Eur. Polym., 2011, 47, 254–263 CrossRef CAS.
- G. M. Grass and J. R. Robinson, J. Pharm. Sci., 1988, 77, 3–14 CrossRef CAS PubMed.
- S. Yasueda, M. Higashiyama, M. Yamaguchi, A. Isowaki and A. Ohtori, Drug Dev. Ind. Pharm., 2007, 33, 805–811 CrossRef CAS PubMed.
- S. L. Raghavan, A. Trividic, A. F. Davis and J. Hadgraft, Int. J. Pharm., 2001, 212, 213–221 CrossRef CAS PubMed.
- A. Fini, M. Garuti, G. Fazio, J. Alvarez-Fuentes and M. A. Holgado, J. Pharm. Sci., 2001, 90, 2049–2057 CrossRef CAS PubMed.
- J. L. Ford, Int. J. Pharm., 1999, 179, 209–228 CrossRef CAS PubMed.
- L. Perioli, V. Ambrogi, C. Pagano, E. Massetti and C. Rossi, Colloids Surf., B, 2011, 84, 413–420 CrossRef CAS PubMed.
- B. Panda, A. S. Parihar and S. Mallick, Int. J. Biol. Macromol., 2014, 67, 295–302 CrossRef CAS PubMed.
- R. Chowdhary, R. S. Pai and G. Singh, Int. J. Pharm. Invest., 2013, 3, 217–224 CrossRef PubMed.
- M. L. Vueba, L. A. E. B. Carvalho and M. E. Pina, Afr. J. Pharm. Pharmacol., 2013, 7, 83–97 CrossRef CAS.
|
| This journal is © The Royal Society of Chemistry 2016 |
Click here to see how this site uses Cookies. View our privacy policy here.