Pervaporation dehydration of an acetone/water mixture by hybrid membranes incorporated with sulfonated carbon molecular sieves

Chengyun Gaoabc, Minhua Zhangabc, Fusheng Panab, Lingtao Wangabc, Jiayou Liaoab, Teng Nieab, Jing Zhaoab, Keteng Caoab, Lei Zhana and Zhongyi Jiang*ab
aKey Laboratory for Green Chemical Technology of Ministry of Education, School of Chemical Engineering and Technology, Tianjin University, Tianjin, 300072, China. E-mail: zhyjiang@tju.edu.cn
bCollaborative Innovation Center of Chemical Science and Engineering (Tianjin), Tianjin, 300072, China
cR&D Center for Petrochemical Technology, Tianjin University, Tianjin, China 300072

Received 13th February 2016 , Accepted 28th May 2016

First published on 1st June 2016


Abstract

In this study, hybrid membranes incorporated with sulfonated carbon molecular sieves were fabricated and utilized for pervaporation dehydration of an acetone/water mixture. First, carbon molecular sieves (CMS) were synthesized via a hard template method, and sulfonated by concentrated H2SO4 to prepare sulfonated carbon molecular sieves (SCMS). The pore structure, surface properties and morphological features of CMS and SCMS were examined by XRD, FT-IR, TEM, EDX, nitrogen adsorption–desorption and HRTEM. The results showed that the obtained CMS had an ordered mesoporous structure with cylindrical channels and large surface area. After sulfonation, the surface properties of CMS changed from hydrophobic to hydrophilic. Then, SCMS with different contents were incorporated into a chitosan (CS) matrix to fabricate CS-SCMS hybrid membranes. The incorporation of SCMS can simultaneously create more water transportation pathways due to the ordered mesoporous structure and increase the number of hydrophilic sites due to the sulfonic acid groups within the membranes. When the content of SCMS was 2 wt%, an optimum separation performance with a separation factor of 832 and a permeation flux of 1.81 kg m−2 h−1 was acquired, which was increased by 2 times for the separation factor and 1.67 times for the permeation flux compared with those of the pure CS membrane. Meanwhile, the hybrid membrane showed good long-term stability.
1. Introduction

As an important organic compound, acetone is extensively used in paint, varnish and ink industries, moreover, it also acts as a raw material for the production of methyl methacrylate and bisphenol-A.1–4 The annual consumption of acetone is about 6 million tons.6Many industrial processes need to separate acetone and water to promote the reaction or recover the acetone solvent. Compared with other technologies, membrane-based pervaporation technology has the advantages of low-energy consumption, simplicity of operation, and environmental friendliness,7–11 which has been considered as an alternative energy-efficient technology to separate azeotropic mixtures, close boiling point liquids, isomeric or heat sensitive components, and remove low concentration pollutants from aqueous waste.12–18 Thus, pervaporation dehydration of acetone/water mixture has attracts more attentions in recent years, and it is imperative to explore novel and efficient pervaporation membrane to meet such application requirements.

Generally, the polymeric membrane exists the “trade-off” phenomenon between selectivity and permeability,20–24 which leads to polymeric membranes hardly obtain high flux and high water selectivity concurrently. It is an important option to overcome the trade-off effect by mixing inorganic particles in the membranes, which can disrupt the arrangement of polymer molecular chain and increase the chain spacing of the polymer. In general, the porous particles can provide high speed channel for transportation of water to obtain high flux than the nonporous particles. To improve the water selectivity of the membrane, the chosen porous materials were often modified by hydrophilic functional groups. However, many inorganic particles are difficult to be modified for lacking applicable reaction sites. Carbon molecular sieve possess the regular pores as well as superior kinetic selectivity between molecules with similar properties. Thus, carbon molecular sieve is easy to be modified by hydrophilic functional groups. Among various hydrophilic functional groups, the sulfonic acid groups have fairly high hydration energy of 47.3 kJ mol−1, which shows strong hydrophilic selectivity. Carbon molecular sieve can be simply modified by the sulfonic acid groups through the treatment of concentrated sulfuric acid.

In this study, the carbon molecular sieve was used to prepare the sulfonated carbon molecular sieve (SCMS), and the SCMS possess both porosity and high hydrophilic groups which could be beneficial to simultaneously increase water flux and selectivity. Moreover, chitosan (CS) was chosen as the polymeric matrix due to its high hydrophilic characteristics25–27 and excellent chemical-resistant properties. The as-prepared SCMS were doped into CS matrix to construct the hydrophilic channels within the hybrid membrane. Separation performance of the hybrid membranes was evaluated by pervaporation dehydration of acetone/water mixture. Effects of operation temperature and feed concentration on the separation performances were evaluated simultaneously.

2. Experimental

2.1 Materials

Chitosan (CS) with a viscosity of 400 mPa s, P123 and tetraethyl orthosilicate (TEOS) were purchased from Aladdin Reagent (Shanghai) Co. Ltd. Acetic acid (≥99.5 wt%). Glutaraldehyde (GA) (50 wt%), hydrochloric acid (36–38 wt%), sucrose, hydrofluoric acid (HF) (40 wt%), concentrated sulfuric acid (98 wt%) and absolute acetone (≥99.7 wt%) were obtained from Tianjin Kewei Ltd. (Tianjin, China). Polyacrylonitrile (PAN) ultrafiltration membrane with a molecular weight cut-off of 100[thin space (1/6-em)]000 was obtained from Shanghai MegaVision Membrane Engineering & Technology Co. Ltd. (Shanghai, China) and used as membrane substrates/supports. All the reagents were of analytical grade and used as received. Deionized water was used in all experiments.

2.2 Preparation of CMS and SCMS

CMS was prepared using SBA-15 as the hard template and sucrose as the carbon precursor. First, SBA-15 was prepared according to the literature.30 1 g of triblock copolymer P123 was dissolved in 35 mL 2 M HCl at 38 °C under stirring and the mixture was then aged at 120 °C for 24 h in a hydrothermal reactor. Subsequently, the solid product was filtered, washed at room temperature, and calcined in air for 5 h at 550 °C. Finally, mesoporous silica SBA-15 was obtained. Secondly, 1 g SBA-15 was added to an sucrose acidic solution (1.25 g sucrose, 0.14 g concentrated sulfuric acid and 5 g deionized water), dried at 373 K and calcinated at 433 K for 6 h. The as-prepared SBA-15, containing partly polymerized and carbonized sucrose, was once again immersed into sucrose acidic solution (0.8 g sucrose, 90 mg concentrated sulfuric acid and 5 g distilled water) and the mixture was kept at 873 K in N2 atmosphere and maintained for 6 h. The resultant C/SBA-15 composite was washed with 40% HF solution to remove the silica template. The CMS was obtained after filtration, washing and drying.33 Afterwards, the CMS was sulfonated using concentrated H2SO4 (1 g CMS of 20 mL 98% H2SO4) at 160 °C for 6 h. The resulting samples were rigorously washed with deionized water to remove the physically adsorbed substances.35 The sulfonated CMS was denoted as SCMS.

2.3 Membrane preparation

CMS particles of different concentrations (0, 0.5, 1, 2, 4 and 6 wt%) were added to deionized water and stirred for 2 days and sonicated for 30 minutes by cell rupture. 2.0 g CS powder and 2.0 g acetic acid were dissolved in the above solution under stirring at 30 °C for 4 hours. Then, 2.5 wt% GA (Glutaraldehyde) solution was added and stirred for 2 hours. After filtration and degassing, the casting solution was spin-coated on PAN membranes to obtain composite membranes. The obtained composite membranes were placed at room-temperature for 24 h to evaporate the residual solvent. The resulting membranes were designated as CS-SCMS-X/PAN, where X (varying from 0 to 6) represented the content of SCMS in CS-SCMS hybrid materials (wt%). The corresponding homogenous membranes were fabricated on glass plates instead of PAN membranes following the same procedure for comparison purpose and were denoted as CS-SCMS-X.

2.4 Characterization of CMS, SCMS and membranes

X-ray diffraction (XRD) patterns of CMS, SCMS and membrane were obtained by a D/MAX-2500 X-ray diffractometer (CuKα, 40 kV, 200 mA).

Fourier transform infrared (FT-IR) spectroscopy was recorded on a Nicolet 6700 spectrophotometer with scan range of 4000–600 cm−1.

The morphology of CMS and SCMS were observed by transmission electron microscopy (TEM, JEOL, Tecnai G2 F20).

Nitrogen adsorption–desorption isotherms were measured at 77 K using Micromeritics Tristar 3000. The CMS and SCMS were degassed at 475 K for 12 h prior to the measurement. The specific surface area was calculated by Brunauer–Emmett–Teller (BET) method. The total pore volume was estimated from the amount of N2 adsorbed at P/P0 = 0.99.

The cross-section and surface morphology of the membranes were observed by using field emission scanning electron microscope (FESEM, Nanosem 430). And the C, S, O elements content of SCMS particle were recorded by energy-dispersive X-ray spectroscopy (EDX) equipped on FESEM.

The cross-section and surface morphology of the membranes were observed by using field emission scanning electron microscope (FESEM, Nanosem 430).

The static contact angles of hybrid membranes were measured by contact angle goniometer (JC2000C, Powereach Co., Shanghai, China) using water as probe liquids for the investigation of the hydrophilic/hydrophobic property.

Thermogravimetric analysis (TGA, NETZSCH TG 209 F3) was used to understand the thermal properties of the membranes over the range of 40–800 °C with a heating rate of 10 °C min−1 under nitrogen flow.

2.5 Acid density analysis

The strong acid (–SO3H) density of SCMS was tested as follow. 0.1 g SCMS was placed in a conical flask, and mixed with 30 mL 0.6 M NaCl solution. The H+ existed in the form of –SO3H group was exchanged with Na+ by stirring for 2 h. Afterwards, the mixture was filtered and the obtained filtrate was titrated with 0.1001 mol L−1 NaOH standard solution using methyl red as indicator. The acid (–SO3H) density of was calculated as follows:
 
image file: c6ra03505a-t1.tif(1)
where D–SO3H is the acid (–SO3H) density (mol g−1) of SCMS particle; cOH is the concentration of the NaOH standard solution (mol L−1); V1 and V0 represent the volume of the NaOH standard solution consumed in the titration of SCMS particle and blank test (L), respectively; and mSOMC represent the mass of SCMS particles (g).

2.6 Swelling and adsorption studies

After fully dried in a vacuum oven, the homogeneous CS-SCMS-X membranes were weighed and then immersed into 95 wt% acetone aqueous solution at 50 °C for 48 h to achieve sorption equilibrium. Then the swollen membranes were weighed after carefully wiping off the liquid on the surface with tissue paper. All the experiments were repeated three times. The degree of swelling (DS, %) was calculated as follows:
 
image file: c6ra03505a-t2.tif(2)
where Ws and Wd are the mass of the swollen and dry membranes respectively.

2.7 Pervaporation experiment

The pervaporation experiment was carried out for dehydration of acetone–water mixture. The experiment apparatus used in this study was shown in Fig. 1. The membrane was installed in the cell and the effective area was 25.6 cm2. The feed solution was pumped across the membranes surface at a flow rate of 60 L h−1 under ambient pressure. On the permeate side of the membrane, a vacuum pump was utilized to keep the pressure blow 0.3 kPa. The permeate vapor was collected in a liquid nitrogen cold trap which was replaced every half an hour after the establishment of steady state. The permeation flux (J, kg (m2 h)−1) was obtained as follows:
 
image file: c6ra03505a-t3.tif(3)
where Q (g) is the mass of the permeate collected in the cold trap during the operation time t (h) and A (m2) is the effective membrane area.

image file: c6ra03505a-f1.tif
Fig. 1 Schematic diagram of pervaporation experiment device. 1-Electrical heater; 2-thermocouple; 3-tank; 4-metering pump; 5-rotor flow meter; 6-membrane cell; 7-collection tube of penetrating fluid; 8-cold trap; 9-dryer; 10-buffer tank; 11-vacuum pump.

The compositions of feed and permeate solutions were analyzed by gas chromatography (GC, HP4890, USA) equipped with a thermal conductivity detector (TCD) and a column packed with GDX103 (Tianjin Chemical Reagent Co., China). The temperatures for the injector, detector and oven were set at 220, 250 and 180 °C, respectively. The separation factor (α) was calculated via the following equation:

 
image file: c6ra03505a-t4.tif(4)
where P and F represent the mass fractions of water (with the subscript W) or acetone (with the subscript A) in the permeate and feed solutions, respectively.

3. Results and discussion

3.1 Characterization of CMS and SCMS particles

The chemical and physical structure of CMS and SCMS were analyzed by XRD, FT-IR, TEM, N2-adsorption–desorption, EDX and HRTEM (ESI Fig. S1–S7). The result showed that the –SO3H group had been uniformly distributed within the pore wall of SCMS after sulfonation (see ESI Fig. S1–S3), and the acid exchange capacity of SCMS was tested to be 2.32 H+ mmol g−1 by titration method as described in Section 2.3 (see ESI Table S1). In addition, SCMS retained the long-range ordered mesoporous structure of CMS after sulfonation (see ESI Fig. S4 and S5), and the surface area, pore volume and pore diameter of SCMS gradually decreased comparing with that of CMS due to grafting of the –SO3H group (see ESI Fig. S6 and S7 and Table S2).

3.2 Characterization of membrane

3.2.1 Morphology of membrane. The dispersion of SCMS particles in the hybrid membranes was observed by SEM (Fig. 2). As shown in Fig. 2, the SCMS showed good adhesion with the polymer (CS) and interfacial voids were absent. Overall, the SCMS was well dispersed in the membrane. However, when the particle loading increased up to 4 wt%, some particle aggregation could be observed in CS-SCMS-4/PAN and CS-SCMS-6/PAN membranes, while no obvious voids were observed, which indicated that it possessed good compatibility between the SCMS particles and CS polymer matrix.
image file: c6ra03505a-f2.tif
Fig. 2 The surface morphology of CS/PAN and CS-SCMS-X/PAN hybrid membranes.

The cross-sectional morphology of the membranes was measured by FESEM. Fig. 3 demonstrated that the active layer with thickness of ∼350 nm was tightly adhered to the porous PAN layer.


image file: c6ra03505a-f3.tif
Fig. 3 The cross-section morphology of CS/PAN and CS-SCMS-X/PAN.
3.2.2 Chemical and physical structures of hybrid membranes. The influence of SCMS on physicochemical properties of the membranes was investigated using FT-IR as shown in Fig. 4. According to the spectra, the major vibrational fingerprints associated with CS membrane could be found in all the membranes. The bands appearing at around 3340 cm−1 was ascribed to the stretching vibration of –OH, which was overlapped by the stretching vibration of N–H; the bands at ∼1620 cm−1 and 1520 cm−1 were assigned to amide I and amide II functional groups respectively. After the incorporation of SCMS particles, the absorption intensities of the stretching vibration of –OH became weaker. It indicated that the intramolecular or intermolecular of hydrogen-bonding between –OH groups in CS had been broken.
image file: c6ra03505a-f4.tif
Fig. 4 FT-IR spectra of CS and CS-SCMS-X hybrid membranes.

The X-ray diffraction was measured to examine the crystallinity of membranes. The effect of the content of SCMS on the crystallinity of CS-SCMS was shown in Fig. 5. The diffraction pattern of pure CS membrane exhibited two type peaks at around 2θ = 12 and 17°, and a broad peak at around 23°. For SCMS particles, there existed the typical diffraction peak at about 23° which was coincident with that of CS. For CS-SCMS hybrid membranes, it showed the same peaks with that of CS. In addition, the intensity of the diffraction peak of CS-SCMS hybrid membrane increased as the content of SCMS increased. For direct comparison, the weight-averaged crystallinity was calculated using the method in previous literature.38 As listed in Table 1, the crystallinity of membrane increased with the increasing content of SCMS. The reasons may be ascribed to the following two factors: firstly, CS chains were distributed by SCMS particles which led to the decrease of crystallinity;39 secondly, the particle of SCMS was crystalline solid, which could also enhance the crystallinity of hybrid membrane with the increasing content of CSMS. When the second factor contributed more than the first factor, the crystallinity of the hybrid membranes increased with increasing the content of SCMS.


image file: c6ra03505a-f5.tif
Fig. 5 XRD patterns of SCMS particle, pure CS membrane and CS-SCMS-X hybrid membranes.
Table 1 Crystallinity of CS and CS-SCMS-X hybrid membranes
Membrane CS CS-SCMS-0.5 CS-SCMS-1 CS-SCMS-2 CS-SCMS-4 CS-SCMS-6
Crystallinity (%) 6.7 6.97 7.3 8.65 9.42 10.60


Thermogravimetric analysis (TGA) was used to evaluate the thermal chemical and physical properties of pure CS membrane and CS-SCMS hybrid membranes, the results were presented in Fig. 6(A). It could be clearly observed that there were three degradation stages for the pure CS membrane and CS-SCMS hybrid membranes. Usually, the second degradation stage was used to evaluate the thermal stability of the membrane. In the second stage as shown in Fig. 6(B), when the degradation reached 52 wt%, the resistance temperature of pure CS membrane, CS-SCMS-0.5 and CS-SCMS-1 hybrid membrane were 243 °C, while the resistance temperature of CS-SCMS-2, CS-SCMS-4 and CS-SCMS-6 were 280, 290 and 305 °C, respectively. It indicated that the thermal resistance was enhanced when the content of SCMS was high, which was attributed to electrostatic interaction of ion pair between –SO3of SCMS and –NH3+ of CS. The SCMS particles served as physical crosslinking sites and elevated the thermal stability of the hybrid membranes.40


image file: c6ra03505a-f6.tif
Fig. 6 TGA cures of pure CS membrane and CS-SCMS-X hybrid membranes.
3.2.3 Hydrophilicity and swelling behavior of membranes. The surface hydrophilicity for CS/PAN pristine membrane and CS-SCMS-X/PAN hybrid membranes were studied by static contact angle with water as probe liquid. As shown in Fig. 7, it can be seen that the water contact angle decreased with increasing filler loading: CS/PAN > CS-SCMS-0.5/PAN > CS-SCMS-1/PAN > CS-SCMS-2/PAN > CS-SCMS-4/PAN > CS-SCMS-6/PAN. It suggested that the surface hydrophilicity of hybrid membranes increased with increasing the SCMS loading. It could be attributed to two reasons. (1) The –SO3H group on the surface of SCMS was hydrophilic. In addition, the structure of porous SCMS existed capillary phenomenon which was conducive to contact with water preferentially and enhanced the hydrophilicity; (2) the roughness of surface played an important role in wettability. The relationship between surface roughness and contact angle for slightly hydrophobic material (just above 90°) of hydrophilic material are commonly described by Wenzel equation:41
 
cos[thin space (1/6-em)]θr = r[thin space (1/6-em)]cos[thin space (1/6-em)]θ (5)
where θ is the intrinsic contact angle, θr is the contact angel on a rough surface with the same material and r is the roughness factor. This equation indicated that when θ was smaller than 90°, θr decreased with the increase of the surface roughness. That meant a rough surface made by material with water contact angle lower than 90° would be more hydrophilic even super-hydrophilic. It could be seen that the roughness of membrane surface increased with increasing the content of SCMS (seen Fig. 2), so the surface became more hydrophilic and water molecules were preferentially adsorbed onto the hybrid membranes.

image file: c6ra03505a-f7.tif
Fig. 7 Contact angles of pure CS/PAN membrane and CS-SCMS-X/PAN hybrid membranes.

The swelling degree is a parameter to evaluate the liquid adsorption performance of membrane. To study the effect of the content of SCMS on membrane swelling, the pure CS membrane and CS-SCMS hybrid membrane were immersed in 95 wt% acetone solution at 323.15 K for 48 h. The result of swelling behavior was showed in Fig. 8. It could be seen that with the increasing content of SCMS, the swelling degree of hybrid membranes was increased linearly. It was consistent with the result of water contact angle. The reason was that the porous structure of SCMS could adsorb water and acetone by capillary pressure, but the –SO3H group on the surface of SCMS had high hydration energy (47.3 kJ mol−1) and could adsorb more water molecules to form hydrated layer. With the increase of SCMS content, hybrid membrane would adsorb more water.


image file: c6ra03505a-f8.tif
Fig. 8 Mass swelling degree of pure CS membrane and CS-SCMS-X.

3.3 Pervaporation experiment

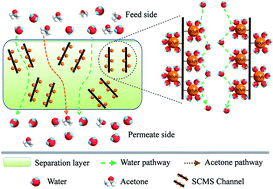
3.3.1 Effect of the content of SCMS on the pervaporation performance of CS-SCMS/PAN hybrid membranes. In order to study the effect of the content of SCMS on the pervaporation performance of membrane, the pure CS/PAN and CS-SCMS-X/PAN hybrid membranes were evaluated with 95 wt% acetone aqueous solution at 323.15 K. As shown in Fig. 9, the permeation flux increased, while the separation factor increased firstly and then decreased with the mass ratio of SCMS to CS varying from 0 wt% to 6 wt%. When the content of SCMS was 2 wt%, the hybrid membrane exhibited an optimal pervaporation performance with a permeation flux of 1.81 kg m−2 h−1 and a separation factor of 802, which were increased by 2 times and 1.67 times compared with pure CS membrane respectively. The increase in performance could be attributed to the incorporation of SCMS particles. As shown in the contact angle results, the incorporation of SCMS increased hydrophilicity of CS-SCMS hybrid membrane surface, water could preferentially adsorb onto the surface of CS-SCMS hybrid membrane which was beneficial to increase the water selectivity. In addition, when SCMS particles were loaded in CS matrix, the hydrophilic channel was constructed within the membrane. Since the pore size of SCMS was 3.65 nm, the transport mechanism of water is same as that of the bulk water, it would not exist the confined single-molecule diffusion phenomenon. Particularly, the –S[double bond, length as m-dash]O and –OH group of –SO3H were favorable to form hydrogen bond with strongly polar water molecular compared with weakly polar acetone molecular. The water hydration energy of –SO3H was 47.3 kJ mol−1, which was higher than the energy for breaking the hydrogen bond of water molecules network (25.1 kJ mol−1). Accordingly, the water was favorable to transport through the hydrated layer of –SO3H group, not through the –SO3H group directly. Schematic representation of water and acetone transport within CS-SCMS hybrid membrane was shown in Scheme 1. While the content of SCMS increased to 4 wt%, SCMS particles agglomerated as shown in Fig. 2(e) and (f), this led to the increase of interstitial spaces within the polymer matrix, both water and acetone molecules could pass through, therefore the flux increased and separation factor decreased.
image file: c6ra03505a-f9.tif
Fig. 9 Effect of the content of SCMS on the pervaporation performance of CS-SCMS-2/PAN hybrid membrane.

image file: c6ra03505a-s1.tif
Scheme 1 Schematic representation of water and acetone transport within CS-SCMS hybrid membrane.
3.3.2 Effect of operation temperature on the separation performance. It is well known that temperature played an important role in pervaporation process. Hence, the effect of temperature on the permeation flux and separation factor of CS-SCMS-2/PAN membrane was investigated in this study, and the results were presented in Fig. 10. As shown in Fig. 10(A) and (B), both the total permeation flux and the water permeation flux increased obviously with the increasing of temperature, while the acetone permeation flux almost did not change. The increase of separation factor was attributed to that the permeation rate of water was higher than that of acetone. The reason may be ascribed to the change in physical properties of liquid and structure of membrane.
image file: c6ra03505a-f10.tif
Fig. 10 Effect of temperature on (A) total flux and separation factor, (B) water flux and acetone flux, (C) Arrhenius plots of water and acetone flux.

The vapor pressure of the aqueous feed solution was increased with the increasing temperature, which resulted in the enhancement of the driving force. Moreover, the structure of water changed from tetrahedral configurations to two hydrogen-bonded configurations,42 and the fraction of free unbounded water molecules increased with the increasing temperature.43 It shorten the rotational and translational correlation times of water molecules in bulk and increased the self-diffusion coefficient of water,44 which was beneficial to promote the transport of the water and increased the water flux. Meanwhile, the rate of forming hydrogen bond between water and acetone was larger than that of breaking hydrogen bond between water and acetone with increasing the temperature. Obviously, it was favorable for water transport, consequently enhancing the water selectivity.

Chitosan polymer chains became more flexible when increasing the temperature, which made the feed pass through the membrane more easily and enhance the total flux.45 The different behaviors of water flux and acetone flux were also analyzed by Arrhenius equation

 
image file: c6ra03505a-t5.tif(6)
where, Ji, Ai, Ei, R and T represent the permeation flux, pre-exponential factor, apparent activation energy, gas constant and feed temperature, respectively. As shown in Fig. 10(C), the apparent activation energy for water and acetone in the range of 303–323 K was 40.93 and 14.19 kJ mol−1, respectively. The apparent activation energy of water was larger than that of acetone, suggesting that the permeation of water was more sensitive to temperature changes, so the water flux increased more quickly than acetone flux with increased temperature and caused the increase of separation factor.

3.3.3 Effect of water concentration in feed on the separation performance. The effect of feed composition on separation performance of the CS-SCMS-2/PAN membranes was shown in Fig. 11. As shown in Fig. 11(A), the permeation flux of water increased with the increase of water content in the feed. In addition, the permeation flux of acetone also increased with the increase of water concentration, this result was mainly because of the increased swelling degree of the membranes arising from the plasticization by water46 when increasing water concentration in the feed. The resultant loose structure facilitated the transportation of both water and acetone. When increment amplitude of water was less than that of acetone, the separation factor decreased as shown in Fig. 11(B).
image file: c6ra03505a-f11.tif
Fig. 11 Effect of water concentration on the pervaporation performance of CS-SCMS-2/PAN membrane.
3.3.4 Long-term operation stability. Long-term stability of membrane is critical for practical applications. The long term separation performance of CS/PAN and CS-SCMS-2/PAN for 95 wt% acetone/water mixture at 50 °C were assessed and shown in Fig. 12. It could be found that the performance of CS-SCMS-2/PAN was superior to that of CS/PAN. Moreover, both flux and water concentration in the permeate decreased at first 72 h and then became steady for both CS/PAN and CS-SCMS-2/PAN membranes. The decrease in flux and water concentration of CS-SCMS-2/PAN membrane could be ascribed to the structure change of CS, as described in our previous literature.38 Plasticization phenomenon make CS chains more flexible, at the same time, the plasticized CS polymer and the enhanced mobility of CS chains accelerated the relaxation process and made the CS chain much denser through a configurational rearrangement. In relatively low water concentration solution, relaxation phenomenon played a more important role than the plasticization effect of water on CS structure, thus the denser CS structure led to the decrease of flux. During the relaxation process, the formation of H-bonds between –OH groups in CS decrease of hydrophilic sites and led to the decrease of water selectivity. After the balance of plasticization and relaxation with the membrane was reached, the structure and separation performance of membrane tended to be stable.
image file: c6ra03505a-f12.tif
Fig. 12 The long-term pervaporation performance of pure CS/PAN membrane and CS-SCMS-2/PAN hybrid membrane.
3.3.5 Comparison of present work with literature data. The performance of CS-CMS-2/PAN hybrid membrane was compared with the state of the art membranes for acetone dehydration reported in the literature. The detailed performance data of membranes are shown in Table 2. In general, the excellent pervaporation membranes should concurrently possess high flux as well as high separation factor. As shown in Table 2, most polymer and inorganic pervaporation membrane for acetone dehydration reported in the literature possess either high flux or high separation factor, by comparison, the CS-CMS-2/PAN hybrid membrane prepared this work possess both high flux and high separation factor concurrently, and it has a certain practical value.
Table 2 Pervaporation performances of different membranes for the separation of acetone/water mixture
Membrane type Membrane Water (wt%) T (°C) Flux (kg m−2 h−1) Separation factor References
a Our previous work.
Flat sheet P84co-polyimide 15 50 1.800 54 1
Flat sheet GA–CS modified by maleic anhydride 10 40 0.117 1797 5
Flat sheet PVA 5 30 0.098 192 19
Flat sheet PAN-b-PEG-b-PAN 5 50 0.274 413 28
Flat sheet P84/TAEA 15 50 0.658 983 29
Flat sheet PVA-g-AN/HEMA-Fe3O4 20 40 0.200 120 31
Flat sheet PVA–Fe3O4 10 40 0.015 1166 32
Flat sheet CS-K+MMT 5 50 1.560 2200 34a
Hollow fibers PBI/P84 15 50 0.284 1187 3
Tubular A-type zeolite 5 120 7.000 252 36
Tubular SiO2–ZrO2 5   0.403 2500 37
Flat sheet CS-SCMS/PAN 5 50 1.810 802 This work


4. Conclusion

In this study, the SCMS, which possess the porosity and high hydrophilic sulfonic acid groups, were incorporated into CS matrix to fabricate CS-SCMS hybrid membranes for dehydration of acetone/water mixture. On one hand, the SCMS is favorable to enhance the water permeation flux of hybrid membranes due to the high porosity and the increased polymer spacing; on the other hand, the high hydrophilic sulfonic acid groups of SCMS is favorable to increase the water selectivity of hybrid membranes. Thus, the water flux and separation factor of hybrid membranes were enhanced simultaneously. Especially, when the content of SCMS was 2 wt%, the hybrid membrane exhibited an optimal pervaporation performance with a permeation flux of 1.81 kg m−2 h−1 and a separation factor of 802 which was increased by 1.67 times in permeation flux and 2 times in separation factor compared with those of pure CS membrane. Moreover, the CS-SCMS hybrid membrane exhibited higher thermal long-term stabilities.

Nomenclature

Symbols

AMembrane area (m2)
EApparent activation energy (kJ mol−1)
FMass fractions in feed solution (wt%)
JPermeation flux (g m−2 h−1)
lMembrane thickness (m)
PMass fractions in permeate solution (wt%)
QMass of permeate (g)
tTime interval (h)
WMass of membrane (g)
XMass ratio of SCMS to CS (wt%)

Greek letters

αSeparation factor
θDiffraction angle (°)

Subscripts

DDry membrane
AAcetone
SSwollen membrane
WWater

Acknowledgements

The authors gratefully acknowledge the financial support from the National Science Fund for Distinguished Young Scholars (No. 21125627), the National Natural Science Foundation of China (NO. 21490583), Specialized Research Fund for the Doctoral Program of Higher Education (20120032120009), the Open Project of the State Key Laboratory of Chemical Engineering (SKL-ChE-13B03), the Program of Introducing Talents of Discipline to Universities (No. B06006).

Notes and references

  1. D. W. Mangindaan, G. Min Shi and T.-S. Chung, J. Membr. Sci., 2014, 458, 76–85 CrossRef CAS.
  2. D. W. Mangindaan, N. M. Woon, G. M. Shi and T. S. Chung, Chem. Eng. Sci., 2015, 122, 14–23 CrossRef CAS.
  3. G. M. Shi, Y. Wang and T.-S. Chung, AIChE J., 2012, 58, 1133–1145 CrossRef CAS.
  4. D. W. Mangindaan, G. Min Shi and T.-S. Chung, J. Membr. Sci., 2014, 458, 76–85 CrossRef CAS.
  5. W. Zhang, G. Li, Y. Fang and X. Wang, J. Membr. Sci., 2007, 295, 130–138 CrossRef CAS.
  6. H. S. Samanta and S. K. Ray, Sep. Purif. Technol., 2015, 143, 52–63 CrossRef CAS.
  7. X. Feng and R. Y. M. Huang, Ind. Eng. Chem. Res., 1997, 36, 1048–1066 CrossRef CAS.
  8. S. G. Adoor, S. D. Bhat, D. D. Dionysiou, M. N. Nadagouda and T. M. Aminabhavi, RSC Adv., 2014, 4, 52571–52582 RSC.
  9. J. Li, N. Wang, H. Yan, S. Ji and G. Zhang, RSC Adv., 2014, 4, 59750–59753 RSC.
  10. P. H. T. Ngamou, J. P. Overbeek, H. M. van Veen, J. F. Vente, P. F. Cuperus and M. Creatore, RSC Adv., 2013, 3, 14241–14244 RSC.
  11. A. K. Thakur, S. Gahlot, V. Kulshrestha and V. K. Shahi, RSC Adv., 2013, 3, 22014–22022 RSC.
  12. M. Villegas, E. F. C. Vidaurre and J. C. Gottifredi, Chem. Eng. Res. Des., 2015, 94, 254–265 CrossRef CAS.
  13. Y. Zhang, J. W. Rhim and X. S. Feng, J. Membr. Sci., 2013, 444, 22–31 CrossRef CAS.
  14. T. Mohammadi, A. Aroujalian and A. Bakhshi, Chem. Eng. Sci., 2005, 60, 1875–1880 CrossRef CAS.
  15. Y.-L. Liu, Y.-H. Su, K.-R. Lee and J.-Y. Lai, J. Membr. Sci., 2005, 251, 233–238 CrossRef CAS.
  16. Y. Wang, T. Shung Chung and M. Gruender, J. Membr. Sci., 2012, 415–416, 486–495 CrossRef CAS.
  17. F. Xiangli, Y. Chen, W. Jin and N. Xu, Ind. Eng. Chem. Res., 2007, 46, 2224–2230 CrossRef CAS.
  18. S. Xia, X. Dong, Y. Zhu, W. Wei, F. Xiangli and W. Jin, Sep. Purif. Technol., 2011, 77, 53–59 CrossRef CAS.
  19. M. C. Burshe, S. A. Netke, S. B. Sawant, J. B. Joshi and V. G. Pangarkar, Sep. Sci. Technol., 1997, 32, 1335–1349 CrossRef CAS.
  20. S. Y. Hu, Y. Zhang, D. Lawless and X. Feng, J. Membr. Sci., 2012, 417–418, 34–44 CrossRef CAS.
  21. M. Y. Kariduraganavar, J. G. Varghese, S. K. Choudhari and R. H. Olley, Ind. Eng. Chem. Res., 2009, 48, 4002–4013 CrossRef CAS.
  22. Q. G. Zhang, Q. L. Liu, Z. Y. Jiang and Y. Chen, J. Membr. Sci., 2007, 287, 237–245 CrossRef CAS.
  23. R. Y. M. Huang, R. Pal and G. Y. Moon, J. Membr. Sci., 2000, 167, 275–289 CrossRef CAS.
  24. P. S. Rachipudi, A. A. Kittur, A. M. Sajjan, R. R. Kamble and M. Y. Kariduraganavar, Chem. Eng. Sci., 2013, 94, 84–92 CrossRef CAS.
  25. Y. Zhu, S. Xia, G. Liu and W. Jin, J. Membr. Sci., 2010, 349, 341–348 CrossRef CAS.
  26. K. Sunitha, S. V. Satyanarayana and S. Sridhar, Carbohydr. Polym., 2012, 87, 1569–1574 CrossRef CAS.
  27. R. P. Pandey and V. K. Shahi, J. Membr. Sci., 2013, 444, 116–126 CrossRef CAS.
  28. Q. Zhao, J. Qian, Q. An, Z. Zhu, P. Zhang and Y. Bai, J. Membr. Sci., 2008, 311, 284–293 CrossRef CAS.
  29. D. W. Mangindaan, N. M. Woon, G. M. Shi and T. S. Chung, Chem. Eng. Sci., 2015, 122, 14–23 CrossRef CAS.
  30. D. Zhao, J. Feng, Q. Huo, N. Melosh, G. H. Fredrickson, B. F. Chmelka and G. D. Stucky, Science, 1998, 279, 548–552 CrossRef CAS PubMed.
  31. M. Olukman and O. Şanlı, Chem. Eng. Process., 2015, 98, 60–70 CrossRef CAS.
  32. M. Olukman, O. Şanlı and E. K. Solak, Vacuum, 2015, 120, 107–115 CrossRef CAS.
  33. L. Peng, A. Philippaerts, X. Ke, J. Van Noyen, F. De Clippel, G. Van Tendeloo, P. A. Jacobs and B. F. Sels, Catal. Today, 2010, 150, 140–146 CrossRef CAS.
  34. C. Gao, M. Zhang, Z. Jiang, J. Liao, X. Xie, T. Huang, J. Zhao, J. Bai and F. Pan, Chem. Eng. Sci., 2015, 135, 461–471 CrossRef CAS.
  35. M. Zhang, A. Sun, Y. Meng, L. Wang, H. Jiang and G. Li, Microporous Mesoporous Mater., 2015, 204, 210–217 CrossRef CAS.
  36. S. Sommer and T. Melin, Chem. Eng. Sci., 2005, 60, 4509–4523 CrossRef CAS.
  37. A. Urtiaga, C. Casado, M. Asaeda and I. Ortiz, Desalination, 2006, 193, 97–102 CrossRef CAS.
  38. C. Gao, M. Zhang, Z. Jiang, J. Liao, X. Xie, T. Huang, J. Zhao, J. Bai and F. Pan, Chem. Eng. Sci., 2015, 135, 461–471 CrossRef CAS.
  39. K. Cao, Z. Jiang, J. Zhao, C. Zhao, C. Gao, F. Pan, B. Wang, X. Cao and J. Yang, J. Membr. Sci., 2014, 469, 272–283 CrossRef CAS.
  40. J. P. Zheng, C. Z. Wang, X. X. Wang, H. Y. Wang, H. Zhuang and K. D. Yao, React. Funct. Polym., 2007, 67, 780–788 CrossRef CAS.
  41. Y. Ma, X. Cao, X. Feng, Y. Ma and H. Zou, Polymer, 2007, 48, 7455–7460 CrossRef CAS.
  42. H. Ohtaki and T. Radnai, Chem. Rev., 1993, 93, 1157–1204 CrossRef CAS.
  43. K. Krynicki, C. D. Green and D. W. Sawyer, Faraday Discuss. Chem. Soc., 1978, 66, 199–208 RSC.
  44. P. Wernet, D. Nordlund, U. Bergmann, M. Cavalleri, M. Odelius, H. Ogasawara, L. Å. Näslund, T. K. Hirsch, L. Ojamäe, P. Glatzel, L. G. M. Pettersson and A. Nilsson, Science, 2004, 304, 995–999 CrossRef CAS PubMed.
  45. G. Liu, D. Yang, Y. Zhu, J. Ma, M. Nie and Z. Jiang, Chem. Eng. Sci., 2011, 66, 4221–4228 CrossRef CAS.
  46. S. K. Choudhari and M. Y. Kariduraganavar, J. Colloid Interface Sci., 2009, 338, 111–120 CrossRef CAS PubMed.

Footnote

Electronic supplementary information (ESI) available. See DOI: 10.1039/c6ra03505a

This journal is © The Royal Society of Chemistry 2016