DOI:
10.1039/C6RA03183H
(Paper)
RSC Adv., 2016,
6, 49954-49965
Development of a novel biomimetic micro/nano-hierarchical interface for enhancement of osseointegration†
Received
4th February 2016
, Accepted 4th May 2016
First published on 12th May 2016
Abstract
Surface modification of biomedical materials plays a significant role in enhancing in vivo osseointegration. In the present study, a biomimetic hierarchical titanium implant with micro- and nano-pores (Micro/Nano-Ti) was developed utilizing spark plasma sintering combined with electrochemical anodization. The surface morphology, phase composition, and wettability were characterized through scanning electron microscopy (SEM) and atomic force microscopy (AFM), X-ray diffraction (XRD), and contact angle (CA) measurement, respectively. Bone marrow cells were cultured, and the in vitro cell–material interactions were evaluated according to cell adhesion (SEM), cell viability (MTT), cell differentiation (ALP activity), mineralization (calcium deposition), focal protein adhesion (CLSM), and osteogenic factor expression (qRT-PCR). Additionally, the in vivo osseointegration properties were assessed by employing a tibia implantation rat model with subsequent histological analysis, micro-computed tomography, and biomechanical tests. The results showed that, in comparison with the untreated, Micro-Ti, and Nano-Ti implants, the Micro/Nano-Ti implant featured a hydrophilic surface (CA = 21 ± 2.1°) due to the presence of micro-pores (diameter: 30–100 μm) and nano-pores (diameter: 50–120 nm). Furthermore, the Micro/Nano-Ti implant greatly enhanced the in vitro cell–material interactions in terms of cell adhesion, viability, differentiation, mineralization, focal protein adhesion, and osteogenic factor expression, and accelerated osseointegration in vivo. The biomimetic hierarchical micro/nano-structure may represent an effective surface modification for potential application in the field of endosseous implants.
1. Introduction
Endosseous implants are growing in popularity in orthopedics and dentistry, and pure Ti or Ti-based alloys, CoCrMo alloys, and 316L stainless steel are the most commonly used biomaterials in biomedical engineering.1,2 For components that contact bone, pure Ti and Ti-based alloys are the materials of choice due to a low elastic modulus, and extensive studies are available in the literature with regard to these materials.3–5 The major issue following implantation of the metallic implants is the interaction between the implant and the surrounding host tissues, which is largely determined by the physicochemical characteristics of the implant surface.6 Therefore, a great number of methods and techniques have been proposed to enhance the implant–bone interaction through modification of the implant surface, such as hydroxyapatite coating, collagen modification, surface roughening, etc.7–10 Although these methods have been shown to improve osseointegration, some drawbacks also occur including peeling of the coating, long-term foreign body effecting of permanent implants and release of metallic cations, which to a certain degree compromise the long-term stability of the endosseous implant in vivo.11,12 On the other hand, following implantation, the relative movement between the implant and the bone (or the bone cement used for fixation of the implant) under physiological loading is considered to be particularly detrimental for osseointegration.13,14 Consequently, the development of effective osteoinductive surface modification techniques for achieving long-term stability is still a great challenge, and tremendous research is required to gain an insight into this issue.
Among the surface treatment methods currently available, nanotubular structures created by electrochemical anodization on the surface of biomaterials have been reported to stimulate rapid cell growth and osteoblast mineralization as well as to accelerate osseointegration in vivo.15–17 However, it has been demonstrated that normal bone trabecula is hierarchical with the presence of micro/nano-structure,18 which implies that the endosseous implant should have surface features not only on the nanometer scale but also on the micrometer scale in order to facilitate transport of nutrients and bone ingrowth.19,20 At the same time, how the surface properties of titanium in a 3D configuration affect the cellular interaction with the implant surface is still an open question.21 In the present study, we designed a novel endosseous titanium implant which integrated a microporous trabecular bone-like architecture and anatase TiO2 nano-pores on the surface, obtained an interesting interface and investigated its osseointegration properties in terms of in vitro bone marrow cell behaviour and an in vivo animal study.
2. Materials and methods
2.1 Sample preparation and characterization
2.1.1 Surface modification. Medical-grade pure titanium was provided by the Institute of Metal Research, Chinese Academy of Sciences (Shenyang, China) and manufactured into rod-shaped samples (diameter: 1 mm; length: 10 mm) and disk-shaped samples (diameter: 5 mm; thickness: 1 mm). The samples were thoroughly rinsed with acetone and de-ionized water in an ultrasonic bath, dried at 45 °C, and modified by three surface treatment methods, namely spark plasma sintering, electrochemical anodization, and spark plasma sintering combined with electrochemical anodization. Briefly, spark plasma sintering was performed employing a SPS-1050 sintering system (Thermal Technology LLC, Santa Rosa, CA, USA) to generate a trabecular bone-like microporous architecture (e.g., Micro-Ti). Electrochemical anodization was completed using a PGSTAT302N electrochemical workstation (Metrohm, Hong Kong, China) to create TiO2 nanotubes (e.g., Nano-Ti). Additionally, spark plasma sintering combined with electrochemical anodization aimed to modify the original titanium surface with both micro-pores and nano-pores (e.g., Micro/Nano-Ti). All these processes were performed by Research Center for Nano-Biomaterials, Analytical and Testing Center, Sichuan University (Chengdu, China).
2.1.2 Surface morphology. The surface morphology of all the titanium samples (untreated-Ti, Micro-Ti, Nano-Ti, and Micro/Nano-Ti) was examined employing an Inspect F50 field emission scanning electron microscope (SEM, FEI, Eindhoven, The Netherlands) at different magnifications.
2.1.3 Surface topography. The three-dimensional (3D) surface topography of the untreated-Ti and Nano-Ti samples was evaluated using a Nanoscope MultiMode & Explore SPM 9600 atomic force microscope (AFM, Shimadzu Corporation, Kyoto, Japan) under tapping mode. The measurements were conducted in ambient air with a scan area of 5 × 5 μm2. Three parameters including the root mean square value of surface roughness, surface area difference (the percentage increase of 3D surface area over 2D surface area.), and vertical range were calculated by the associated Nanoscope imaging software. A total of 10 random positions on the sample surface were measured, and the average values were obtained.
2.1.4 Phase composition. The X-ray diffraction (XRD) pattern of the Micro/Nano-Ti sample was determined using a Philips X'Pert Pro MPD diffractometer (Philips Analytic, Amsterdam, The Netherlands) with a scanning speed of 0.75° min−1 and an angle range of 10–80° for phase composition analysis.
2.1.5 Surface wettability. The surface wettability of all the titanium samples (untreated-Ti, Micro-Ti, Nano-Ti, and Micro/Nano-Ti) was characterized through the sessile drop method using a RaméHart 290 automated goniometer/tensiometer (Succasunna, NJ, USA). The static contact angle was measured at 5 random positions on each sample, and the average values were calculated.
2.2 In vitro cell behaviour
2.2.1 Cell isolation and culture. Bone marrow stromal cells (BMSCs) were isolated from the femurs of 4 week-old male Sprague-Dawley rats (Animal Research Center, Sichuan University, China) and subsequently cultured in alpha-modified Eagle's medium (α-MEM, Gibco, Gaithersburg, MD, USA), which was supplemented with 10% fetal bovine serum (FBS, Gibco), 50 mg L−1 ascorbic acid (Sigma-Aldrich, St. Louis, MO, USA), 10 mM Na-β-glycerophosphate (Sigma-Aldrich), 10−8 M dexamethasone (Sigma-Aldrich), and 1% penicillin–streptomycin antibiotic antimycotic solution (Invitrogen, Carlsbad, CA, USA). The cells were incubated in a humidified atmosphere of 95% air and 5% CO2 at 37 °C. After 48 h, the unattached cells were rinsed away, and fresh culture medium was added. Afterwards, the culture medium was changed every 2–3 days, and the cells were subcultured when reaching 80–90% confluence.
2.2.2 Cell morphology. The disk-shaped titanium samples were sterilized and placed in the wells of 24-well culture plates. The cells at passages 2–4 were seeded onto the titanium samples with a cell density of 5 × 10⁴ cells per mL and cultured with α-MEM in the incubator. After 2 h of culture, the titanium samples were rinsed thoroughly with phosphate-buffered saline solution (PBS) to remove the unattached cells, and the remaining cells were fixed with 2.5% glutaraldehyde (Sigma-Aldrich) for 2 h. The fixed cells were progressively dehydrated in a graded series of ethanol (20%, 40%, 60%, 80%, 90%, and 100%). The titanium samples were dried employing a EMS 850 critical point dryer (Electron Microscopy Science Co., Hillsboro, OR, USA) and sputter-coated with a palladium layer using a JFC-1600 ion sputtering apparatus (Electronics Co., Ltd, Saitama, Japan) for SEM examination.
2.2.3 Cell viability. Cell viability on the disk-shaped titanium samples (untreated-Ti, Micro-Ti, Nano-Ti, and Micro/Nano-Ti) was determined using a 3(4,5-dimethylthiazol-2-yl)-2,5-diphenyl tetrazolium bromide assay (MTT, M-2128, Sigma) after culture for 1, 3, 5, 7, and 9 days. Specifically, MTT solution (10 mg mL−1) was added to each well of the 24-well culture plate and incubated for 4 h, producing formazan during metabolization of MTT by the living cells. The optical density was measured using an Anthos 2010 spectrophotometer (Biochrom, Cambridge, UK) at an excitation wavelength of 490 nm. A total of 4 samples for each surface treatment were examined at each time point, and the final results were normalized relative to the untreated-Ti sample at 1 day, shown as mean value ± standard deviation.
2.2.4 Cell differentiation. Cell differentiation potential on the disk-shaped titanium samples (untreated-Ti, Micro-Ti, Nano-Ti, and Micro/Nano-Ti) was evaluated by alkaline phosphatase (ALP) activity. After incubation with the titanium samples for 24 h, the culture medium was changed to osteogenic inductive medium, containing α-MEM, 10% FBS, 100 U mL−1 penicillin, 100 mg mL−1 streptomycin sulfate, 100 nM dexamethasone, 50 μg mL−1 ascorbic acid, and 10 mM Na-β-glycerophosphate. The osteogenic inductive medium was replaced every 2 days. After incubation for 7, 10, and 14 days, the cells seeded on all the titanium samples were fixed by 4% paraformaldehyde (Sigma-Aldrich) and stained with an ALP kit (Beyotime, Shanghai, China). Then the cells were incubated with p-nitrophenyl phosphate (pNPP, Sigma-Aldrich) for 30 min, and ALP activity was evaluated through measurement of optical density using the spectrophotometer at 405 nm. The total protein content was calculated employing Bio-Rad protein assay kit (Bio-Rad, Hercules, CA, USA) and normalized relative to bovine serum albumin (BSA, Sigma-Aldrich) at 630 nm. A total of 4 samples with each surface treatment were examined at each time point, and the final results are shown as mean values ± standard deviations.
2.2.5 Cell mineralization. Cell mineralization on the disk-shaped titanium samples (untreated-Ti, Micro-Ti, Nano-Ti, and Micro/Nano-Ti) was assessed by calcium deposition. After incubation with the titanium samples for 21 days, the cells were fixed in 70% ice cold ethanol for 30 min and stained with 40 mM Alizarin Red S (ARS, Sigma-Aldrich) for 20 min. All the titanium samples were washed with PBS five times, and the stained cells were eluted using 10% cetylpyridinium chloride solution (Sigma-Aldrich). The optical density was measured using the spectrophotometer at 590 nm. A total of 5 samples for each surface treatment were examined, and the results were expressed as absorbance value per milligram of total BSA protein, in terms of mean value ± standard deviation.
2.2.6 Focal protein adhesion. Cytoskeleton, integrin, focal protein adhesion, osteocalcin (OCN) and osteopontin (OPN) expression on the titanium samples was investigated under a confocal laser scanning microscope (CLSM, LSM700, Carl Zeiss, Oberkochen, Germany). Following incubation with the titanium samples for 4 h, the cells were washed with PBS three times, fixed in 4% paraformaldehyde for 30 min, and permeabilized with 0.2% Triton X-100 (Sigma-Aldrich) for 15 min. Subsequently, specific primary antibody targeting integrin β1 (Abcam, USA) was added at 1
:
400 dilutions and co-incubated overnight at 4 °C. DyLight 549-conjugated anti-mouse IgG antibody (Invitrogen, USA), at 1
:
500 dilutions in blocking buffer, was used for 1 h at 37 °C in the dark. Cytoskeleton was stained with FITC–phalloidin and cellular nuclei were counterstained with DAPI. And for 8 h, the cells were incubated with rhodamine-conjugated phalloidin (Millipore, Billerica, MA, USA), Alexa Fluor 488-conjugated antivinculin antibody (Millipore, Billerica, MA, USA) and DAPI to observe focal protein adhesion. For osteocalcin (OCN) and osteopontin (OPN) expression detection, samples were incubated in rat specific primary antibodies of OCN (Abcam, USA) at 1
:
200 dilutions overnight at 4 °C. Then samples were incubated with DyLight 549-conjugated anti-mouse IgG antibody (Invitrogen, USA) for 1 h at 37 °C. All specimens were observed using CLSM after extensive washing with PBS.
2.2.7 Quantitative real-time polymerase chain reaction. Quantitative real-time polymerase chain reaction analysis (qRT-PCR) was performed to examine the expression of various osteogenic factors, including runt-related transcription factor 2 (Runx2), osteocalcin (OCN), osteopontin (OPN), and collagen type I (COL I). After incubation with the disk-shaped titanium samples (untreated-Ti, Micro-Ti, Nano-Ti, and Micro/Nano-Ti) for 7 days, the cells were detached by 0.25% trypsin-1 mM EDTA (Gibco BRL, Gaithersburg, MD, USA). Total RNA was extracted using TRIzol reagent (Invitrogen, Carlsbad, CA, USA) and reversely transcribed to cDNA employing a first-strand cDNA synthesis kit (Takara, Shiga, Japan). The mRNA expression of the above-mentioned osteogenic factors was determined using a StepOnePlus Real-Time PCR System (Applied Biosystems, Foster City, CA, USA). GAPDH was used as the internal RNA control, and the relative expression levels of the osteogenic factors were obtained according to the 2−ΔΔCt method. The primer sequences used in this study were listed in ESI Table S1.†
2.3 In vivo animal study
2.3.1 Animal model and grouping. Female SD rats (age 3 months, weight ranges from 210 g to 230 g) were obtained from the Animal Research Center of Sichuan University and randomly assigned to four groups. All rats were kept under climate-controlled conditions (25 °C, 55% humidity, and 12 hours of light alternating with 12 hours of darkness) and fed with a standard diet. All animal care and experiments were compliant with the guidelines of the Animal Research Committee of the West China School of Stomatology, Sichuan University, and conducted in accordance with international standards on animal welfare.The rats were placed under general anesthesia with abdominal injection of ketamine (100 mg kg−1, Yuhan, Seoul, Korea) and xylazine (10 mg kg−1, Bayer, Ansan, Korea). Bilateral longitudinal incisions (length: 10 mm) were made along the medial side of the knee joint, and a 1.2 mm hole was drilled using an inter-condylar notch, cooling with sterile saline solution. The rats were randomly assigned into four groups (Group A, B, C, and D, n = 10 animals per group) and inserted with the titanium implants (n = 20 samples per group) as follows: Group A (untreated-Ti), Group B (Micro-Ti), Group C (Nano-Ti), and Group D (Micro/Nano-Ti). The implantation was made into the medullary canal of the metaphysis until the implant reached the articular surface, and the patella was relocated, reconstructing the extensor mechanism. The rats received intramuscular antibiotic and analgesic injection for 3 days and were allowed for free activities ad libitum. Twelve weeks following implantation, the rats were sacrificed and the proximal tibiae (together with the titanium implant) were harvested for the following evaluations.
2.3.2 Histological analysis. Immediately following sacrifice, 5 tibiae in each group were maintained in 4% neutral formalin buffered solution for 2 days, dehydrated in a graded series of ethanol (20%, 40%, 60%, 80%, 90%, and 100%), and embedded in methylmethacrylate (Technovit 7200 VCL, Exact Apparatbau, Nordenstedt, Germany) without decalcification. The tibiae were sectioned, ground into 70 μm-thick slices using a SP1600 rotary diamond saw (Leica, Nussloch, Germany), and then stained with 1% toluidine blue. Histomorphometry was performed on the sections approximately 2 mm below the epiphyseal plate, using a semi-automated digitizing image system, which consisted of an ECLIPSE E600 stereomicroscope (Nikon, Tokyo, Japan), a DXM1200 digital camera (Nikon, Tokyo, Japan), and NIS-Elements F2.20 image software. The bone-to-implant ratio was calculated as the percentage of the interface of bone-implant contact among the whole interface of the cancellous bone. The bone area ratio was measured as the percentage of bone tissue to the whole area, which was defined as a ring 200 μm away from the implant surface.
2.3.3 Micro-computed tomography evaluation. Another 5 tibiae in each group were scanned using a μCT 80 micro-computed tomography system (micro-CT, Scanco Medical, Bassersdorf, Switzerland) under the following conditions: 70 kV, 114 μA, and 700 ms integration time. The multi-level threshold procedure (200 for bone and 700 for implant) was applied to discriminate bone from other tissues. Subsequently, the 3D image of the tibia was reconstructed with an isotropic voxel size of 10 μm, and four parameters were calculated for quantitative evaluation, namely bone volume percentage (BV), mean trabecular number (Tb.N), mean trabecular separation (Tb.Sp), and bone voxel percentage in direct contact with the implant (BVI).
2.3.4 Biomechanical testing. Immediately following micro-CT evaluation, a push-out test was performed on the remaining 10 tibiae in each group using an Instron 5566 universal material testing system (Instron, Norwood, MA, USA) at a loading speed of 1 mm min−1. Epiphyseal separation was done to expose the titanium implant end, and a custom-made mould was designed to ensure that the compression force was along the long axis of the implant during the test. The displacement versus force plot was recorded for the calculation of the maximum push-out force and ultimate shear strength (i.e. the maximum push-out force divided by the contact area).
2.4 Statistical analysis
The data were analyzed using Statistical Product and Service Solutions 16.0 software (SPSS, Chicago, IL, USA). The differences in surface characterization (surface roughness, surface area difference, vertical range), in vitro cell behaviour (MTT, ALP activity, calcium deposition, qRT-PCR), and in vivo osseointegration (bone-to-implant ratio, bone area ratio, BV, Tb.N, Tb.Sp, BVI, push-out force, ultimate shear strength) among the untreated-Ti, Micro-Ti, Nano-Ti, and Micro/Nano-Ti samples were evaluated using one-way analysis of variance (ANOVA) and Student–Newman–Keuls (SNK) test, with the statistical significance set at p < 0.05.
3. Results
3.1 Sample characterization
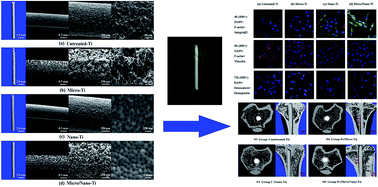
3.1.1 Surface morphology. Representative SEM micrographs of all titanium samples (untreated-Ti, Micro-Ti, Nano-Ti, and Micro/Nano-Ti) are demonstrated in Fig. 1. Under low magnification, the untreated-Ti and Nano-Ti samples showed a relatively rough surface, and the Micro-Ti and Micro/Nano-Ti samples were similar, with the presence of interconnecting micro-pores (diameter: 30–100 μm). Under high magnification, the micro-pores on the Micro-Ti sample were clearly observed, and an amount of uniformly distributed nano-pores (diameter: 50–120 nm) were seen on the Nano-Ti and Micro/Nano-Ti samples.
 |
| Fig. 1 The SEM micrographs of the titanium samples at different magnifications: (a) untreated-Ti; (b) Micro-Ti; (c) Nano-Ti; and (d) Micro/Nano-Ti. The Micro/Nano-Ti sample has a biomimetic hierarchical surface with the presence of micro/nano-pores. | |
3.1.2 Surface topography. The comparison of 3D surface topography and surface parameters between the untreated-Ti and Nano-Ti samples are presented in Fig. 2 and Table 1, respectively. It was obvious that the Nano-Ti sample was much rougher, as revealed by the significantly increased values of surface roughness (2.7-fold), vertical range (2.1-fold), and surface area difference (2.1-fold, p < 0.05). The presence of nano-pores on the Nano-Ti sample was distinctively demonstrated from the 3D surface topographical graph, and the two-dimensional surface profile indicated that the diameter and depth of the nano-pores were about 120 nm and 20 nm, respectively, which is in agreement with the results of SEM observation.
 |
| Fig. 2 The AFM graphs of the Nano-Ti and untreated-Ti samples: (A) 3D surface topography of the Nano-Ti; (B) 3D surface topography of the untreated-Ti; (C and E) 3D reconstruction of Nano-Ti surface topography; (D and F) 3D reconstruction of untreated-Ti surface topography; (G) showing the presence of nano-pores on the Nano-Ti sample (diameter: ∼120 nm; depth: ∼20 nm). | |
Table 1 Quantitative evaluation of 3D surface topography of the untreated-Ti and Nano-Ti samples (n = 10)a
Sample |
Parameters |
Surface roughness (nm) |
Vertical range (nm) |
Surface area difference (%) |
The data are expressed as mean ± SD. *p < 0.05 indicates a statistically significant difference between the untreated-Ti and Nano-Ti samples. |
Untreated-Ti |
16.96 ± 2.73 |
161.78 ± 32.23 |
7.69 ± 2.01 |
Nano-Ti |
46.52 ± 3.19* |
333.55 ± 36.03* |
15.81 ± 3.63* |
3.1.3 Phase composition. The XRD pattern of the Micro/Nano-Ti sample is shown in Fig. 3, with the presence of both Ti and TiO2 phases from the substrate, indicating that the electrochemical anodization treatment resulted in generation of TiO2 nano-pores on the original titanium surface.
 |
| Fig. 3 The XRD pattern of the Micro/Nano-Ti sample showing the presence of both Ti and TiO2. | |
3.1.4 Surface wettability. The comparison of the surface wettability characteristics of the untreated-Ti, Micro-Ti, Nano-Ti, and Micro/Nano-Ti samples is demonstrated in ESI Fig. S1,† and the static contact angles were 88 ± 5.3°, 81 ± 4.9°, 27 ± 2.6°, and 21 ± 2.1°, respectively. Clearly, the Micro/Nano-Ti sample was characterized by the smallest contact angle, indicating the hydrophilicity of its surface.
3.2 In vitro cell behaviour
3.2.1 Cell morphology. The initial adhesion of cells after 2 h of incubation is shown in Fig. 4, where distinctively different cell morphologies are detected. BMSCs cultured on the untreated-Ti sample exhibited a round shape and almost no spreading on the surface, although many filopodial extensions were observed. In contrast, BMSCs cultured on the Micro-Ti are observed spreading and Nano-Ti sample demonstrated a polygonal shape. And on Micro/Nano-Ti sample, BMSCs are complete spreading.
 |
| Fig. 4 Initial cell adhesion after 2 h of incubation: (a) untreated-Ti, BMSCs are round and no spreading is observed; (b) Micro-Ti, BMSCs are spreading, with the presence of pseudopod; (c) Nano-Ti, BMSCs are polygonal, with the presence of pseudopod; and (d) Micro/Nano-Ti, BMSCs are complete spreading. | |
3.2.2 Cell viability. The proliferation kinetics of BMSCs cultured on the untreated-Ti, Micro-Ti, Nano-Ti, and Micro/Nano-Ti samples are shown in Fig. 5(a). The relative cell proliferation rates all increased progressively from 1–9 days. Although there was no significant difference between the titanium samples at 1 day and 3 days (p > 0.05), the Nano-Ti and Micro/Nano-Ti samples exhibited a higher cell proliferation rate than the untreated-Ti and Micro-Ti samples. From 5–9 days, the relative cell proliferation rates for the Nano-Ti and Micro/Nano-Ti samples were significantly higher than those for the untreated-Ti and Micro-Ti samples (p < 0.05).
 |
| Fig. 5 In vitro cell behaviour on the untreated-Ti, Micro-Ti, Nano-Ti, and Micro/Nano-Ti samples: (a) cell viability; (b) ALP activity; and (c) calcium deposition. *p < 0.05 vs. untreated-Ti, $p < 0.05 vs. Micro-Ti, #p < 0.05 vs. Nano-Ti. | |
3.2.3 Cell differentiation. The relative ALP activity (normalized by total BSA content) of BMSCs cultured on the untreated-Ti, Micro-Ti, Nano-Ti, and Micro/Nano-Ti samples is demonstrated in Fig. 5(b). The relative ALP activity increased progressively from 7–14 days. At 10 and 14 days, the relative ALP activity for the Nano-Ti and Micro/Nano-Ti samples was significantly greater than that of the untreated-Ti sample (p < 0.05), and the highest value was obtained for the Micro/Nano-Ti sample at 14 days, indicating enhanced cell differentiation on the surface containing micro/nano-pores. The cells stained on all the titanium samples at 14 days are shown in ESI Fig. S2.†
3.2.4 Cell mineralization. The calcium deposition results (shown as ARS optical density per milligram of total BSA protein) for BMSCs cultured on the untreated-Ti, Micro-Ti, Nano-Ti, and Micro/Nano-Ti samples are shown in Fig. 5(c). Obviously, more bone nodules formed on the Micro/Nano-Ti sample, followed by the Nano-Ti, Micro-Ti, and untreated-Ti samples. The statistical analysis demonstrated that cell mineralization on the Nano-Ti and Micro/Nano-Ti samples was significantly higher than that on the untreated-Ti and Micro-Ti samples (p < 0.05).
3.2.5 Cell seeding and staining. The cytoskeleton and focal protein adhesion of BMSCs cultured on the samples are shown in Fig. 6 and ESI Fig. S3–S5.† In order to qualitatively determine the influence of different surfaces on BMMSCs adhesion activity, the expression of integrin β1 and vinculin were detected by cell immunofluorescence staining. At 4 h of culture, red fluorescence stained integrin β1 in BMMSCs cultured on Group A and B were less abundant than that for cells cultured on Group C and D, while no significant difference can be observed between cells cultured on the Group C and D. But as to F-actin, green fluorescence stained cells of Group D is much brighter (ESI Fig. S3†). After 8 h of culture, green fluorescence stained vinculin in BMMSCs cultured on Group C were more abundant than that for cells cultured on Group A and B; but Group D also displayed the strongest expression (ESI Fig. S4†). After 72 h of incubation on different samples, the protein expression levels of OCN and OPN were measured using cellular immunofluorescence. As shown in ESI Fig. S5,† the expression of OCN and OPN on Group D was not much stronger than that on Group B and C; although Group A displayed the weakest expression of OCN and OPN.
 |
| Fig. 6 The cytoskeleton and focal protein adhesion of BMSCs cultured on the samples: red, actin microfilaments, vinculin, or osteocalcin; green, either integrin, F-actin or osteopontin; blue, cell nucleus. All figures represent the merged images. The separatums are shown in ESI Fig. S2–S4.† | |
3.2.6 qRT-PCR of osteogenic factors. The mRNA expression levels of various osteogenic factors (Runx2, OCN, OPN, and COL I) as determined by qRT-PCR for the untreated-Ti, Micro-Ti, Nano-Ti, and Micro/Nano-Ti samples are demonstrated in Fig. 7. Obviously, the mRNA expression levels of all the osteogenic factors were markedly increased on the Nano-Ti and Micro/Nano-Ti samples in comparison with those on the untreated-Ti and Micro-Ti samples. Among the osteogenic factors, the mRNA expression levels of COL I showed a significant difference between the Nano-Ti and Micro/Nano-Ti samples versus the untreated-Ti and Micro-Ti samples (p < 0.05). These results indicated that the Nano-Ti and Micro/Nano-Ti samples facilitated early osteogenic transformation of BMSCs. For the mRNA expression levels of OPN and OCN, Group A displayed the weakest expression, which was concordant with the results of cell staining.
 |
| Fig. 7 The mRNA expression levels of various osteogenic factors as determined by qRT-PCR: (a) Runx2; (b) OCN; (c) OPN; and (d) COL 1. *p < 0.05 vs. untreated-Ti, #p < 0.05 vs. Micro-Ti, $p < 0.05 vs. Nano-Ti. | |
3.3 In vivo animal study
Twelve weeks following implantation of the titanium implants, no death and infection were detected among the rats. After retrieval of the knee joint, it was found that the titanium implants were all well-positioned inside the proximal condyle of the tibiae. The cortical bones were restored completely, and good healing was achieved in all groups.
3.3.1 Histological analysis. Nondecalcified sections of the proximal tibiae approximately 2 mm below the epiphyseal plate are shown in Fig. 8. Fibro-like tissues were found surrounding the Micro-Ti implant in Group B, and bone tissues were observed around the Micro/Nano-Ti implant in Group D. The quantitative bone-to-implant ratio and bone area ratio are given in Table 2. It was clear that the bone-to-implant ratios for Groups C and D were significantly higher than those of Groups A and B (p < 0.05), and there was no significant difference between Group C and D or Group A and B (p > 0.05). The bone area ratio was the highest for Group D and was significantly larger than those of the other three groups (p < 0.05), indicating the best osseointegration.
 |
| Fig. 8 The nondecalcified sections of the proximal tibiae approximately 2 mm below the epiphyseal plate: (a) Group A, untreated-Ti; (b) Group B, Micro-Ti, the white arrows indicate fibro-like tissues around the implant; (c) Group C, Nano-Ti; and (d) Group D, Micro/Nano-Ti, the white arrows indicate bone tissues surrounding the implant. | |
Table 2 Quantitative evaluation of the proximal tibiae through histological analysis 12 weeks after implantation (n = 5)a
Parameters |
Groups |
A (untreated-Ti) |
B (Micro-Ti) |
C (Nano-Ti) |
D (Micro/Nano-Ti) |
Data are expressed as mean ± SD. *p < 0.05 vs. Group A, $p < 0.05 vs. Group B, #p < 0.05 vs. Group C. |
Bone-to-implant ratio (%) |
28.07 ± 12.37 |
23.21 ± 10.05 |
57.88 ± 17.49*,$ |
59.96 ± 18.37*,$ |
Bone area ratio (%) |
19.33 ± 8.46 |
33.86 ± 14.66* |
35.22 ± 15.78* |
55.31 ± 16.12*,$,# |
3.3.2 Micro-CT evaluation. Transverse and longitudinal micro-CT images of the proximal tibiae approximately 2 mm below the epiphyseal plate are demonstrated in Fig. 9. Trabecular bone-like features were detected in Groups B and D. The quantitative parameters of BV, Tb.N, Tb.Sp, and BVI are listed in Table 3. It was obvious that the values of BV, Tb.N, and BVI were the highest for Group D, whereas the Tb.Sq showed the lowest value in this group, indicating that a greater restoration in the bone apposition occurred around the Micro/Nano-Ti implant.
 |
| Fig. 9 The transverse and longitudinal micro-CT images of the proximal tibiae about 2 mm below the epiphyseal plate: (a) Group A, untreated-Ti; (b) Group B, Micro-Ti; (c) Group C, Nano-Ti; and (d) Group D, Micro/Nano-Ti. The red arrows in (b) and (d) indicate the presence of trabecular bone tissues. | |
Table 3 Quantitative evaluation of the proximal tibiae through micro-CT scanning 12 weeks after implantation (n = 5)a
Parameters |
Groups |
A (untreated-Ti) |
B (Micro-Ti) |
C (Nano-Ti) |
D (Micro/Nano-Ti) |
Data are expressed as mean ± SD. *p < 0.05 vs. Group A, $p < 0.05 vs. Group B, #p < 0.05 vs. Group C. |
BV (%) |
22.9 ± 2.8 |
30.9 ± 2.6* |
31.3 ± 2.5* |
49.6 ± 2.9*,$,# |
Tb.N (mm−1) |
3.3 ± 0.3 |
7.2 ± 0.4* |
6.5 ± 0.5* |
10.6 ± 0.7*,$,# |
Tb.Sp (μm) |
432.6 ± 38.9 |
297.6 ± 26.7* |
317.6 ± 31.6* |
165 ± 32.5*,$,# |
BVI (%) |
28.2 ± 2.3 |
31.2 ± 4.1 |
65.8 ± 6.1*,$ |
70.1 ± 6.5*,$ |
3.3.3 Biomechanical tests. The biomechanical properties of the proximal tibiae in terms of compression force and ultimate shear strength are given in Table 4. Clearly, both the compression force and ultimate shear strength for Group D were significantly higher than those of the other three groups (p < 0.05).
Table 4 Evaluation of the biomechanical properties of the proximal tibiae 12 weeks after implantation (n = 5)a
Group |
Parameters |
Compression force (N) |
Ultimate shear strength (MPa) |
Data are expressed as mean ± SD. *p < 0.05 vs. Group A, $p < 0.05 vs. Group B, #p < 0.05 vs. Group C. |
A (untreated-Ti) |
75.45 ± 11.75 |
4.38 ± 0.47 |
B (Micro-Ti) |
324.06 ± 26.73* |
13.8 ± 1.12* |
C (Nano-Ti) |
196.74 ± 18.91*,$ |
8.54 ± 0.75*,$ |
D (Micro/Nano-Ti) |
539.42 ± 31.68*,$,# |
20.9 ± 1.83*,$,# |
4. Discussion
It has been accepted that in vivo osseointegration of an endosseous implant is influenced by its surface properties including surface roughness, surface morphology, and physicochemical composition, which can be modified through a series of surface treatment techniques such as spark plasma sintering, electrochemical anodization, and acid etching, etc.22–24 In the recent literature, research to investigate pure Ti or Ti-based alloys with different surface treatments has intensified,25–27 and some studies have demonstrated beneficial effects of nano-porous features, showing that nano-pores can accelerate the in vitro osteogenic potential and facilitate enhancement of osteoblast adhesion and proliferation.28,29 However, the trabecular bone features the presence of interconnected micro-pores, which indicates that the optimum endosseous implant should have hierarchical structures. Consequently, in the present study we developed a novel titanium implant (Micro/Nano-Ti) with both microporous trabecular bone-like architecture (as indicated in Fig. 10) and TiO2 nano-pores by employing park plasma sintering combined with electrochemical anodization. The osseointegration potential of the Micro/Nano-Ti implant was investigated by studying BMSC behaviour on the implants in vitro and through an in vivo animal study. The results demonstrated that cell viability, cell differentiation, and cell mineralization in vitro were significantly enhanced while focal protein adhesion and early osteogenic transformation of BMSCs, as indicated by the mRNA expression levels of Runx2, OCN, OPN, and COL I, were drastically facilitated. Furthermore, the Micro/Nano-Ti implant was associated with accelerated in vivo bone formation and resulted in the highest values of compression force and ultimate shear strength for the newly formed bone.
 |
| Fig. 10 The SEM micrographs of (a) the Micro-Ti implant showing the presence of irregular micro-pores; (b) rat trabecular bone structure. | |
The Micro-Ti implant prepared by park plasma sintering had a very rough surface featuring the presence of micro-pores. The application of surface parameters has been shown to be an effective tool to quantitatively evaluate surface morphology of biomaterials before and after surface modification.30 The biological results demonstrated that, in comparison with the untreated-Ti implant, the Micro-Ti implant enhanced cell viability, cell differentiation, which are consistent with those of previous studies.31,32 The Nano-Ti implant was prepared by electrochemical anodization, and significant enhancement of cell viability, cell differentiation, cell mineralization, and biomechanical properties in terms of compression force and ultimate shear strength were observed for this material. And it was found that the contact angles on the Nano-Ti and Micro/Nano-Ti implants were significantly lower than those on the other surfaces (i.e., 27 ± 2.6° and 21 ± 2.1°, respectively), which may be related to surface interactions with proteins, beneficial for subsequent cell adhesion and proliferation on the implant surface.33
Although the micro-structures and nano-topographies can facilitate cell–material interactions, it is desirable for surface modification to generate hybrid micro/nano-structures on the original biomedical material, because these hybrid structures are expected to significantly enhance the surface biofunctionality of the material compared to that of conventional implant devices with either micro- or nano-structured surfaces.34 And to our unexpected, an integrated trabecular bone-like interface was obtained, which resulted in the highest values of compression force and ultimate shear strength. Based on our results of CLSM and PCR (the Micro/Nano-Ti surfaces accelerate cells adhering and facilitate early osteogenic transformation while the expression of OCN and OPN was not much stronger), a reasonable explanation leading to the properties responsible for the excellent osseointegration of the Micro/Nano-Ti implant can be attributed to the significant enhancement of interaction with osteoblasts (Fig. 11), which may be caused by the changed surface roughness, surface morphology, and physicochemical composition. In the meantime, the further reduction in contact angle for the Micro/Nano-Ti implant, attributed to the park plasma sintering treatment, increased surface energy and was considered to be one potential factor for the enhancement of cell–material interactions. The presence of interconnected micro-pores can reduce the relative movement at the bone–implant interface, provide a route for blood circulation and nutrition supply, and achieve a mechanical interlocking, which is particularly beneficial for the biomechanical stability. However, the micro-pores can only facilitate the formation of fibrous tissues rather than bone tissues (as shown in Fig. 8), because the long spindle-shaped fibroblasts may adhere and affiliate into micro-pores more easily or quickly than the osteoblasts. In this regard, the combination of TiO2 nano-pores on the surfaces, stimulating adhesion, proliferation, and differentiation of osteoblasts, can eventually result in excellent osseointegration.
 |
| Fig. 11 A schematic diagram showing the potential mechanism of the titanium implants: (a) untreated-Ti; (b) Micro-Ti; (c) Nano-Ti; and (d) Micro/Nano-Ti. The Micro-Ti implant results in the formation of fibrous tissues, the Nano-Ti implant promotes adhesion, proliferation, and differentiation of osteoblasts, and the Micro/Nano-Ti implant contributes to osseointegration. | |
Bone tissue engineering is a strategy that integrates scaffold, seeded cells, and growth factors to achieve bone regeneration. Good promotion of cell adhesion and proliferation as well as osseointegration is of crucial significance for the development of scaffold. From this viewpoint, the biomimetic hierarchical micro/nano-pores on the Ti surface prepared by spark plasma sintering combined with electrochemical anodization in the present study may represent a promising technique for surface modification of a bone tissue engineering scaffold.
5. Conclusions
In the present study, a novel biomimetic hierarchical titanium implant with the presence of micro/nano-pores was developed using spark plasma sintering combined with electrochemical anodization. The in vitro cell behaviour experiment and in vivo animal study demonstrated significantly enhanced cell–material interactions and osseointegration on the Micro/Nano-Ti implant, in comparison with the untreated-Ti, Micro-Ti, and Nano-Ti implants. This biomimetic hierarchical surface modification technique may be valuable in preparing materials for applications in the fields of orthopedic and dental implant surgery.
Acknowledgements
This study was supported by grant from National Basic Research Program of China (973 Program, No. 2012CB933902) and Science Funds of Yantai (2014WS042).
References
- H. Zhang, P. R. Patel, Z. Xie, S. D. Swanson, X. Wang and N. A. Kotov, ACS Nano, 2013, 7, 7619–7629 CrossRef CAS PubMed.
- H. Y. Zhang, L. Brown, L. Blunt, X. Jiang and S. Barrans, Wear, 2009, 266, 566–569 CrossRef CAS.
- H. Wang, M. Cheng, J. Hu, C. Wang, S. Xu and C. C. Han, ACS Appl. Mater. Interfaces, 2013, 13, 11014–11021 Search PubMed.
- S. Facca, D. Lahiri, F. Fioretti, N. Messadeq, D. Mainard, N. Benkirane-Jessel and A. Agarwal, ACS Nano, 2011, 28, 4790–4799 CrossRef PubMed.
- H. S. Alghamdi, B. A. van Oirschot, R. Bosco, J. J. van den Beucken, A. A. Aldosari, S. Anil and J. A. Jansen, Clin. Oral Implants Res., 2013, 24, 475–483 CrossRef PubMed.
- K. Lin, L. Xia, J. Gan, Z. Zhang, H. Chen, X. Jiang and J. Chang, ACS Appl. Mater. Interfaces, 2013, 5, 8008–8017 CAS.
- Y. Gao, S. Zou, X. Liu, C. Bao and J. Hu, Biomaterials, 2009, 30, 1790–1796 CrossRef CAS PubMed.
- Y. Usui, K. Aoki, N. Narita, N. Murakami, I. Nakamura, K. Nakamura, N. Ishigaki, H. Yamazaki, H. Horiuchi, H. Kato, S. Taruta, Y. A. Kim, M. Endo and N. Saito, Small, 2008, 4, 240–246 CrossRef CAS PubMed.
- D. T. Thanh, P. T. Nam, N. T. Phuong, X. le Que, N. V. Anh, T. Hoang and T. D. Lam, Mater. Sci. Eng., C, 2013, 33, 2037–2045 CrossRef CAS PubMed.
- L. H. Li, M. Li, D. Li, P. He, H. Xia, Y. Zhang and C. Mao, J. Mater. Chem. B, 2014, 36, 5952–5961 RSC.
- S. Vahabzadeh, M. Roy, A. Bandyopadhyay and S. Bose, Acta Biomater., 2015, 17, 47–55 CrossRef CAS PubMed.
- A. Kuwabara, N. Hori, T. Sawada, N. Hoshi, A. Watazu and K. Kimoto, Dent. Mater. J., 2012, 31, 368–376 CrossRef CAS.
- L. Zou, Y. Luo, M. Chen, G. Wang, M. Ding, C. C. Petersen, R. Kang, F. D. Hansen, Y. Zeng, N. Lu, Q. Ma, D. Q. Le, F. Besenbacher, L. Bolund, T. G. Jensen, J. Kjems, W. T. Pu and C. Bünger, Sci. Rep., 2013, 3, 2243 Search PubMed.
- Y. Gabet, R. Muller, J. Levy, R. Dimarchi, M. Chorev, I. Bab and D. Kohavi, Bone, 2006, 39, 276–282 CrossRef CAS PubMed.
- K. S. Brammer, C. J. Frandsen and S. Jin, Trends Biotechnol., 2012, 30, 315–322 CrossRef CAS PubMed.
- R. Tsaryk, K. Peters, R. E. Unger, M. Feldmann, B. Hoffmann, F. Heidenau and C. J. Kirkpatrick, J. R. Soc., Interface, 2013, 10, 20130428 CrossRef CAS PubMed.
- J. Park, S. Bauer, K. A. Schlegel, F. W. Neukam, K. von der Mark and P. Schmuki, Small, 2009, 5, 666–671 CrossRef CAS PubMed.
- S. Lan, S. Luo, B. K. Huh, A. Chandra, A. R. Altman, L. Qin and X. S. Liu, Bone, 2013, 56, 83–90 CrossRef PubMed.
- L. Prodanov, E. Lamers, M. Domanski, R. Luttge, J. A. Jansen and X. F. Walboomers, Biomaterials, 2013, 34, 2920–2927 CrossRef CAS PubMed.
- S. Cei, A. Legitimo, S. Barachini, R. Consolini, G. Sammartino, L. Mattii, M. Gabriele and F. Graziani, Implant Dentistry, 2011, 20, 285–291 CrossRef PubMed.
- E. Rieger, A. Dupret-Bories, L. Salou, M. H. Metz-Boutigue, P. Layrolle, C. Debry, P. Lavalle and N. E. Vrana, Nanoscale, 2015, 7, 9908–9918 RSC.
- F. Variola, J. B. Brunski, G. Orsini, P. T. de Oliveira, R. Wazen and A. Nanci, Nanoscale, 2011, 3, 335–353 RSC.
- G. He, Y. Wu, Y. Zhang, Y. Zhu, Y. Liu, N. Li, M. Li, G. Zheng, B. He, Q. Yin, Y. Zheng and C. Mao, J. Mater. Chem. B, 2015, 3, 6676–6689 RSC.
- Y. Li, S. Zou, D. Wang, G. Feng, C. Bao and J. Hu, Biomaterials, 2010, 31, 3266–3273 CrossRef CAS PubMed.
- G. C. Smith, L. Chamberlain, L. Faxius, G. W. Johnston, S. Jin and L. M. Bjursten, Acta Biomater., 2011, 7, 3209–3215 CrossRef CAS PubMed.
- Y. Li, Q. Li, S. Zhu, E. Luo, J. Li, G. Feng, Y. Liao and J. Hu, Biomaterials, 2010, 31, 9006–9014 CrossRef CAS PubMed.
- X. Li, X. Y. Ma, Y. F. Feng, Z. S. Ma, J. Wang, T. Ma, W. Qi, W. Lei and L. Wang, Biomaterials, 2015, 36, 44–54 CrossRef CAS PubMed.
- P. T. de Oliveira, S. F. Zalzal, M. M. Beloti, A. L. Rosa and A. Nanci, J. Biomed. Mater. Res., Part A, 2007, 80, 554–564 CrossRef PubMed.
- E. Conserva, A. Lanuti and M. Menini, Int. J. Oral Maxillofac. Implants, 2010, 25, 1099–1107 Search PubMed.
- R. A. Surmenev, M. A. Surmeneva and A. A. Ivanova, Acta Biomater., 2014, 10, 557–579 CrossRef CAS PubMed.
- H. Zhang, L. Brown, L. Blunt and S. Barrans, J. Mech. Behav. Biomed. Mater., 2008, 1, 96–104 CrossRef CAS PubMed.
- H. Zhang, L. Blunt, X. Jiang, L. Brown and S. Barrans, Clin. Biomech., 2012, 27, 666–672 CrossRef CAS PubMed.
- K. Das, S. Bose and A. Bandyopadhyay, J. Biomed. Mater. Res., Part A, 2009, 90, 225–237 CrossRef PubMed.
- Z. Huan, L. E. Fratila-Apachitei, I. Apachitei and J. Duszczyk, Nanotechnology, 2014, 25, 055602 CrossRef CAS PubMed.
Footnote |
† Electronic supplementary information (ESI) available. See DOI: 10.1039/c6ra03183h |
|
This journal is © The Royal Society of Chemistry 2016 |
Click here to see how this site uses Cookies. View our privacy policy here.