Insights into the mechanism of phenolic mixture degradation by catalytic ozonation with a mesoporous Fe3O4/MnO2 composite

Faheem Nawazab, Yongbing Xie*a, Jiadong Xiaoab, Hongbin Caoa, Yuping Lia and Di Zhanga
aBeijing Engineering Research Center of Process Pollution Control, Institute of Process Engineering, Chinese Academy of Sciences, Beijing 100190, China. E-mail: ybxie@ipe.ac.cn; Tel: +86-010-82544844
bUniversity of Chinese Academy of Sciences, Beijing 100049, China

Received 3rd February 2016 , Accepted 14th March 2016

First published on 16th March 2016


Abstract

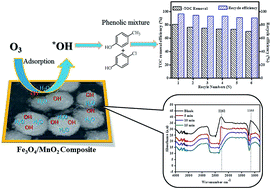
A mesoporous Fe3/MnO2 composite was fabricated by a co-precipitation method in this paper, and it showed a much higher activity than Fe3O4 and MnO2 in the catalytic ozonation of a p-cresol and p-chlorophenol mixture. The physicochemical properties of Fe3O4 and MnO2 and Fe3O4/MnO2 were compared using XRD, SEM, TEM and N2 physical adsorption/desorption. pH had a significant effect on the degradation rate of the phenols and catalyst stability, and the degradation order of p-cresol and p-chlorophenol also varied in different mediums. pH 9 was found to be the optimal condition both for catalytic activity and metal leaching. Attenuated total reflection Fourier transform infrared spectra confirmed that ozone replaced chemically adsorbed water on the Fe3O4/MnO2 surface and evolved into reactive radicals. Electron spin resonance and quenching experiments with different scavengers were conducted to reveal that the hydroxyl radicals were mainly responsible for the phenolic mixture degradation at pH 9, along with a little contribution of singlet oxygen and molecular ozone. A detailed mineralization pathway of the phenolic mixture was also proposed according to the gas chromatography-mass spectrometry results.

1. Introduction

Phenols are produced or consumed in many industries, such as in oil refineries, coking plants, chemical-synthesis factories, pharmaceuticals, plastic industries, textile manufacturing and many others. This will cause environmental pollution to the atmosphere, soil and water if they are not well governed. Among the phenols, p-cresol (Ph-CH3) and p-chlorophenol (Ph-Cl) are the most prevalent phenolic compounds, which are used in the preparation of disinfectants, herbicides and fungicides.1,2

The removal of phenolic compounds from industrial wastewater is currently an environmental challenge for its safe disposal and treatment,3 several physico-chemical and biological techniques have been developed, such as adsorption,4 extraction,5 biological degradation6 and chemical oxidation by peroxymonosulphate,7 permanganate,8 light,9,10 H2O2, ozone and oxygen at high temperature and high pressure.11 Among the reported chemical oxidation processes, ozonation is capable of efficient eliminating the recalcitrant phenolic compounds present in wastewater.12

However, this method was relatively expensive due to the cost of ozone generation, low solubility of ozone in solutions and low level of TOC removal in single ozonation.13 Consequently, it is often combined with ultrasound,14 UV light,15 visible light16 or other reagents17 to improve its treating efficiencies. Different catalysts were universally used in all these combined processes, and heterogeneous catalytic ozonation alone has also been recognized to be an impactful alternative for advanced treatment of wastewater, due to the generation of non-selective oxidant hydroxyl radical (·OH).18

Many transition metal oxides including MnO2,19 Fe3O4,20 NiO,21 ZnO22 and CuO21 led to efficient removals of organic pollutants in catalytic ozonation. They are often loaded on a support with larger surface area to get a better distribution in the solution.23 Another strategy is to synthesize composite metal oxide material, such as Mn–Ce–O,24 NiFe2O4,25 ZnAl2O4 26 and NiO–CuO.22 Ma et al. believed that proper adsorption of ozone and organics on Mn–Co–Fe oxide facilitated the surface reactions on the composite,27 and Lv et al. reported that addition of Mn both enhanced the interfacial electron transfer and increased the surface lewis sites on Mn–Co/γ-Fe2O3, which facilitate the redox process of the metal oxides and the catalytic decomposition of ozone to generate radicals.28 In most of the literatures using composite material, single component solution was used, which is far from mixed composition in real wastewater. The degradation pathways of the organics and reactive radicals were also not intensively investigated.

For an easy separation of solid catalyst, magnetic material was developed in wastewater treatment. Fe3O4/MnO2 with different morphologies were synthesized and applied in photocatalysis29 adsorption30 and activation of peroxymonosulfate.31 To the best of our knowledge, magnetic porous Fe3O4/MnO2 has not been reported before in catalytic ozonation. In this work we synthesized a mesoporous Fe3O4/MnO2 composite material and applied in catalytic ozonation for mixture of Ph-CH3 and Ph-Cl. It was much more active than Fe3O4 and MnO2 and easily magnetically separated. The competitive adsorption of O3 with water molecular was observed on the surface of mesoporous Fe3O4/MnO2 using an ATR-FTIR spectroscopy. Hydroxyl radical oxidation was mainly responsible to phenols degradation at pH 9, and detailed reaction pathway was proposed according to the intermediate products analysis.

2. Experimental

2.1 Chemicals and reagents

All the chemicals used in materials synthesis and catalytic ozonation process were analytical graded and used without further purification. FeC13·6H2O (99%), C6H5O7Na3·2H2O (≥99%), MnSO4·H2O (≥99%), NH4HCO3 (≥99%), glycerol (≥99%), p-chlorophenol (Ph-Cl, ≥98.0%), p-cresol (Ph-CH3, ≥98%) and tert-butanol (t-BA, ≥98.0%) were purchased from Sinopharm chemical reagent Co., Ltd. KMnO4 (≥99%), ethanol (99.7%), HNO3 (65–68%), acetone (≥99.5%), ammonia solution (25%) and FeC12·4H2O (98%) were bought from Beijing chemical plant. p-Benzoquinone (p-BQ, ≥98%) was procured from Alfa Asar. NaN3 (99.0%) was from Tianjin Fuchen chemical reagents. Deionized water was used throughout to prepare different solutions.

2.2 Material synthesis

In a typical synthesis of Fe3O4, 1.35 g of FeC13·6H2O and 0.5 g of FeC12·4H2O were dissolved in 40 mL deionized water under rapid stirring and nitrogen purging, 3 mL of concentrated ammonia solution was added when the solution was heated to 85 °C. After 30 min, 0.5 M C6H5O7Na3·2H2O solution was added at the same condition and stirred for 60 min. The solution was precipitated by 20 mL of acetone and was rinsed with water/ethanol three times. Magnetic Fe3O4 nanoparticles were collected and diluted with deionized water to give a similar colloidal magnetic fluid and preserved at room temperature.

In a typical procedure (Scheme 1), certain amount of MnSO4·H2O was added into 100 mL of glycerol/water (1[thin space (1/6-em)]:[thin space (1/6-em)]1) solution, and 50 mg of Fe3O4 nanoparticles were added after stirring for 30 min. Another 100 mL of glycerol/water (1[thin space (1/6-em)]:[thin space (1/6-em)]1) solution with 0.16 M of NH4HCO3 was added and stirred for 60 min at 50 °C. Fe3O4 nanoparticles strongly interact with Mn2+ in solvent, and directly combine with formed MnCO3 micro sphere.32 Fe3O4/MnCO3 composite was obtained by centrifugation and rinsed several times with water and ethanol. It was dried at 90 °C for 6 h and calcinated at 400 °C for 5 h to obtain Fe3O4/MnO2. In a parallel procedure, MnO2 was synthesized in the same process in the absence of Fe3O4 nanoparticles.


image file: c6ra03167f-s1.tif
Scheme 1 Schematic illustration for the synthesis of Fe3O4/MnO2.

2.3 Material characterization

The X-ray diffraction (XRD) patterns of Fe3O4, MnO2 Fe3O4/MnCO3, Fe3O4/MnO2 and Fe3O4/Mn2O3 were obtained on X-ray diffractometer (X'Pert-PROMPD, PAN analytical B.V). The morphology was observed by transmission electron microscopy (TEM, JEM-2100, JEOL) at an acceleration voltage of 200 kV and scanning electron microscopy (SEM, SU8000), operating at an acceleration voltage of 10 kV. Energy dispersed X-ray spectroscopy (EDX) was performed on the same SEM microscope. The surface areas and pore structures were studied by nitrogen adsorption/desorption at 77 K (Adsorb-iQ, Quantachrome). The Barrett–Joyner–Halenda (BJH) and Horváth–Kawazoe (HK) methods were used to analyze the mesoporous and microporous structures, respectively. The potential leaching of Mn and Fe were analyzed by inductively coupled plasma optical emission spectrometry (ICP-OES, ICP 6300 Radial, Thermo Scientific). Magnetization curves of the samples were examined by vibrating sample magnetometer (VSM) instrument (Lake Shore 7410, USA).

The electrochemical performance was studied by cyclic voltammetry (CV) with charge–discharge cycling. The electrochemical measurements were carried out on an Autolab 302N electrochemical workstation in a three-electrode system with a platinum foil counter electrode, calomel electrode as the reference and catalyst modified conductive glass as working electrode. The electron spin resonance (ESR) signals of hydroxyl radicals spin trapped by 5,5-dimethyl-1-pyrroline (DMPO) were detected at ambient temperature on a JEOL (JES-FA200) spectrometer. A nitrogen spin-trapping reagent 5,5-dimethyl-1-pyrolin-N-oxide (DMPO) was used in the process. DMPO and Fe3O4/MnO2 suspension were added into 1 L of ozone saturated solution, which was prepared by continuous bubbling of 2.5 mg min−1 ozone into water.

2.4 Catalytic ozonation and analytical procedure

Catalytic ozonation was performed in a semi-batch reactor at 298 K under stirring. The reactor was fed with 1 L aqueous solution containing a mixture of 1 mM Ph-Cl, 1 mM Ph-CH3 and 0.2 g of catalyst. Ozone was produced by ozone generator (Anseros Ozomat GM) from oxygen with high purity. The gaseous ozone was fed through a porous diffuser at the bottom of the reactor with a flow rate of 100 mL min−1 and concentration of 50 mg L−1. The samples were taken at certain intervals and analyzed with high performance liquid chromatography (HPLC, Agilent Technologies Series 1200), using a mixture of methanol and water (30/70%, v/v) containing 10 mM L H3PO4 as the mobile phase. The separation was performed using ZORBAX SB-C18 (3.5 μm, 2.1 × 150 mm) reversed-phase column at 35 °C with a flow rate of 0.3 mL min−1. Sample was analyzed by a UV detector with a wavelength of 220 nm. TOC analyzer (TOC-VCPH, Shimadzu) was used to evaluate the mineralization of the target compounds during catalytic ozonation. Gas chromatography/mass spectrometry (GC/MS, QP-2010 ultra, Shimadzu) was used for the identification of foremost byproducts peaks in catalytic ozonation of phenolic mixture. Electron impact ionization with 70 eV was used for m/z fragmentation. The capillary column was Rxi®-5ms, and the column temperature was programmed to increase from 60 °C to 200 °C at 10 °C min−1 and from 200 °C to 270 °C at 5 °C min−1.

The adsorption of ozone on the catalyst surface was analyzed with attenuated total reflectance Fourier transformed infrared spectroscopy (ATR-FTIR). 0.1 g of Fe3O4/MnO2 composite material was added to 2 mL D2O and sonicated. After the pH of solution was adjusted to 9 with 0.05 M NaOH solution, 100 mL min−1 of gaseous O3 with concentration of 2.5 mg min−1 was bubbled into the solution. The ATR-FTIR spectra were recorded by using a TENSOR 27 infrared spectrometer with a DLATGS detector and a ZnSe horizontal ATR cell. Infrared spectra in the range of 4000 to 800 cm−1 were obtained by averaging 32 scans with a resolution of 4 cm−1 at room temperature.

3. Results and discussion

3.1 Structural characterization of catalysts

XRD was performed to identify the phases of the synthesized composite and calcination effects on crystalline phase, the results obtained is presented in Fig. 1. All diffraction peaks are indexed to pure phases of γ-MnO2 or Fe3O4. The intensive peaks at 24.1°, 31.4°, 36.4°, 42.7° and 56.5° refers to the γ phase of MnO2, and the peaks at 30.1°, 35.6°, 42.6°, 57.2° and 63.0° were characteristic of Fe3O4. The pattern of initially synthesized Fe3O4/MnCO3 was confirmed with low intensity peaks of Fe3O4 and high intensity peaks of MnCO3 at 24.3°, 31.4°, 41.5°, 51.7° and 60.1°, suggesting the wrapping of Fe3O4 in MnCO3 layers. The desired composite Fe3O4/MnO2 was obtained after calcination of Fe3O4/MnCO3 at 400 °C. All characteristic peaks appeared on the composite material, confirming the composition of MnO2 and Fe3O4.33,34 Diffraction peaks of Mn2O3 at 23.1°, 32.9°, 39.3°, 49.5°, 55.2° and low intensity peaks of Fe3O4 confirm the formation of composite Fe3O4/Mn2O3, after calcination of Fe3O4/MnCO3 at 600 °C.35
image file: c6ra03167f-f1.tif
Fig. 1 XRD patterns of Fe3O4, MnO2, Fe3O4/MnCO3, Fe3O4/MnO2 and Fe3O4/Mn2O3.

The morphologies of Fe3O4/MnO2 composites were firstly elucidated by TEM. Fig. 2(A) and (B) show the TEM images of MnO2 microsphere and Fe3O4 nanosphere before amalgamation, respectively. The particle sizes of them were 0.5–2 μm for MnO2 and 8–15 nm for Fe3O4, respectively. Fig. 2(C) and (D) illustrated TEM images of Fe3O4/MnO2 composite with different magnifications. They have sphere-like morphology, and porous surface was found in Fig. 2(D). This should be formed from calcination at high temperature. The particle size of the composite materials did not change much after the combination of Fe3O4 nanoparticles, within the range of 0.5–1.5 μm.


image file: c6ra03167f-f2.tif
Fig. 2 TEM images of pure MnO2 (A), Fe3O4 (B) and Fe3O4/MnO2 composite (C and D).

The Fe3O4/MnO2 was also analyzed with SEM. Fig. 3(A) and (B) with different magnifications shown that the material was uniform with microsphere morphology. Very fine particles can be found on the surface of the MnO2 sphere in Fig. 3(A), which could be the Fe3O4 nanoparticles. Choosing a typical microsphere in SEM, the EDS spectrum in Fig. 3(C) showed the distribution of three elements with different colors, revealing that Fe3O4 and MnO2 are very uniformly distributed as isolated nanoparticles. Fig. 3(D) showed Mn, O and Fe characteristic peaks in EDX spectrum. The peak at 6.5 keV is the overlapping signals of Fe and Mn, previously reported in Fe–Mn composite.36 The insert table in Fig. 3(D) shows the weight percentage and atomic percent of the three elements in the composite microsphere. The molar contents are 24.0% for Mn, 7.3% for Fe and 68.7% for O, respectively. This indicated a low concentration of Fe3O4 in the composite materials.


image file: c6ra03167f-f3.tif
Fig. 3 SEM images of Fe3O4/MnO2 composite (A and B), elemental mapping (C) and EDS pattern (D).

The magnetic properties of Fe3O4/MnO2, Fe3O4 and MnO2 were studied by VSM at room temperature, and the result is shown in Fig. 4. The saturation magnetizations of Fe3O4/MnO2, MnO2 and Fe3O4 were 8.6, 0.9 and 26.5 emu g−1, respectively. Magnetic effect in composite material Fe3O4/MnO2 decreased because of coverage of Fe3O4 with non-magnetic MnO2. This also confirmed with XRD peak intensities in Fig. 1. However the composite material still remains high paramagnetic nature, and it can be completely separated in about 55 min from the treated water, by applying external magnetic field.


image file: c6ra03167f-f4.tif
Fig. 4 The magnetization hysteresis of Fe3O4/MnO2, Fe3O4 and MnO2 microspheres.

Fig. 5 showed the adsorption/desorption isotherms of MnO2, Fe3O4, Fe3O4/MnO2, and corresponding pore sizes distribution. All materials showed a typical adsorption/desorption curves in Fig. 5(A), indicating a mesoporous structure. MnO2 showed the largest pore size, with average pore width of 17 nm. Fe3O4 showed very sharp pore size distribution and the dominant pore width was around 5 nm. The composite Fe3O4/MnO2 had a larger pore size around 7 nm, and the pore volume was obviously larger than that of Fe3O4, and was similar to that of MnO2. The BET surface areas of the materials were calculated from N2 adsorption–desorption isotherms. MnO2 obviously showed the highest particle size in Fig. 2(A), and it had the lowest surface area of 35.1 m2 g−1. Fe3O4 was much smaller than MnO2, and its surface area increased to 66.4 m2 g−1. Though the particle size of Fe3O4/MnO2 is close to MnO2, it showed much higher surface area of 103.2 m2 g−1, for its rich porous structure, which was already revealed in Fig. 2(D).


image file: c6ra03167f-f5.tif
Fig. 5 Adsorption/desorption isotherm of the materials (A) and corresponding pore size distribution (B).

3.2 Catalytic ozonation of phenolic mixture

3.2.1 Influence of pH. The catalytic activity of mesoporous Fe3O4/MnO2 composite was evaluated at different initial pH. The initial pH of phenolic mixture solution was adjusted with HCl or NaOH solution to cover a range from pH 5 to 11. It is already reported that ozone decomposition into hydroxyl radicals is easier in basic solution than neutral or acidic solution, because hydroxide ion may play a role of initiator of the chain reaction of ozone decomposition.37 Fig. 6 showed the degradation of phenolic mixture is influenced by pH. The degradation of Ph-CH3 followed the order pH 9 > pH 11 > pH 7 > pH5 in Fig. 6(A), and the same trend for Ph-Cl was shown in Fig. 6(B). It is believed that hydroxyl radicals are easily generated in basic solution, so the organics will be degraded faster in basic solution than in neutral and acid solution. The optimum pH for catalytic ozonation of Ph-CH3 and Ph-Cl mixture is pH 9. At higher pH of 11, we found a little decrease in the degradation rates of phenolic mixture, similar negative effect of very strong basic medium was also observed by Ma et al.38 He explained that this should be due to the interactions between hydroxyl radicals in solution or the possible scavenger of carbonate generated as byproducts during catalytic ozonation, which lowered the concentration of hydroxyl radicals in solution, and thus reduced the possibility of contact between hydroxyl radicals and contaminants.
image file: c6ra03167f-f6.tif
Fig. 6 The degradation of Ph-CH3 (A) and Ph-Cl (B) and TOC removal (C) in catalytic ozonation with Fe3O4/MnO2 suspension at different pH. Reaction conditions: [Fe3O4/MnO2]: 0.2 g L−1, [O3]: 2.5 mg min−1, [Ph-CH3]: 1 mM, [Ph-Cl]: 1 mM.

For the TOC removal result in Fig. 6(C), we found a similar trend to those of phenols degradation. At pH 5 the degradation rate was the lowest and basic solution benefited the phenols mineralization. The TOC removal rates were very close at pH 9 and 11, but pH 11 required more reagents to adjust the solution pH. From the results of phenols degradation and mineralization, we concluded that pH 9 was the best condition considering the catalytic activity.

The metal leaching from catalyst will cause deactivation of catalyst and second pollution of metal ions. It is also very important to examine the influence of pH on the leaching behavior of material in catalytic ozonation process. In this work, the concentrations of residual Mn and Fe ions were determined with ICP at the end of each reaction with three catalysts and the results were shown in the Table 1.

Table 1 Mn and Fe leaching from Fe3O4/MnO2 at different initial pH
Catalyst Fe (mg L−1) Mn (mg L−1) pH (initial) pH (final)
Fe3O4/MnO2 0.60 17.7 5 2–3
Fe3O4/MnO2 0.15 1.00 7 3–4
Fe3O4/MnO2 0 0 9 4–5
Fe3O4/MnO2 0 0 11 6–7
Fe3O4/Mn2O3 0.1 3.4 9 6–7
Fe3O4/MnCO3 0 24.3 9 6–7
Fe3O4 0 0 9 4–5
MnO2 0 0 9 4–5


As indicated by TOC removal, mixed phenols were not completely at the end of reaction. Carboxylic acid intermediates were normally produced during organics oxidation in the solution and they are more resistant in ozonation and catalytic ozonation.39 This made the solution more acidic. This was confirmed in Table 1 that final pH of the solution all decreased at the end of the reaction. It was found that both Mn and Fe were leached from the Fe3O4/MnO2 catalyst in the initially acid solution; especially a serious leaching of Mn was noticed in the solution with initial pH 5. The concentrations of Fe ion and Mn ion were 0.6 mg L−1 and 17.7 mg L−1, respectively. The leaching was greatly decreased when initial pH increased to 7 though the final pH also became acidic. The leaching of Mn and Fe even cannot be detected after reaction in solution with initial pH 9 and 11. This told that pH is a very important parameter in the stability of the catalyst.40

In the case of other composites, obvious leaching of Mn were observed from Fe3O4/Mn2O3 (3.4 mg L−1) and significant leaching of Mn ion was detected with Fe3O4/MnCO3 (24.3 mg L−1) even at pH 9. This meant MnO2 was much more stable than Mn2O3 and MnCO3 in the composite. For the single component oxides, Fe3O4 and MnO2 were both very stable in the solution with initial pH 9 and no metal ions were detected at the end of the reactions.

3.2.2 Catalyst activity for phenolic mixture. The activity of Fe3O4/Mn2O3, Fe3O4/MnO2, Fe3O4/MnCO3, Fe3O4 and MnO2 were compared in degradation and mineralization of mixture of Ph-CH3 and Ph-Cl at pH 9. Ozonation was also carried out under the same condition to compare with catalytic ozonation. It was obvious that all curves in Fig. 7(A–C) showed the same trend.
image file: c6ra03167f-f7.tif
Fig. 7 Catalytic degradation of Ph-CH3 (A) and Ph-Cl (B) and TOC removal (C) with synthesized materials, and TOC removal (D) in adsorption at pH 9. Reaction conditions: [catalyst]: 0.2 g L−1, [O3]: 2.5 mg min−1, [Ph-CH3]: 1 mM, [Ph-Cl]: 1 mM, initial pH: 9.

Fig. 7(A) showed the degradation rates of Ph-CH3 at 20 min over Fe3O4/Mn2O3, Fe3O4/MnO2, Fe3O4/MnCO3, Fe3O4 and MnO2 were 64.2%, 99.5%, 73.1%, 75.8% and 89.4%, respectively, while that was only 47.8% in ozonation. The degradation of Ph-Cl was slightly slower at the same condition in Fig. 7(B), and the corresponding removal rates were 56.6%, 93.9%, 59.8%, 66.9% and 79.1%, respectively. For a comparison, the Ph-Cl degradation rate was 40.3% in ozonation at 20 min. In all cases, we noticed that Ph-CH3 was relatively more easily degraded than Ph-Cl, which is opposite to the conclusion we obtained in photocatalytic degradation of a series of phenols.41 This can be due to the different reactive species and reaction medium. Superoxide radicals was mainly produced in photocatalytic degradation with Ag+/TiO2 in weak acid solution,41 while this greatly change in catalytic ozonation of basic solution, hydroxyl radicals are more possibly dominant oxidants in this process, and this would be discussed later in this paper.

From Fig. 7(C), TOC removals were 36.6%, 63.7%, 51.1%, 49.5%, 80.6% and 48.3% in ozonation and catalytic ozonation with MnO2, Fe3O4, Fe3O4/MnCO3, Fe3O4/MnO2 and Fe3O4/Mn2O3 suspension, respectively. Ozonation showed the lowest efficiency in phenols degradation and mineralization. The catalytic activity of the synthesized material followed the order Fe3O4/MnO2 > MnO2 > Fe3O4 > Fe3O4/MnCO3 > Fe3O4/Mn2O3. From activity comparison, only Fe3O4/MnO2 showed a positive synergetic effect, while Fe3O4/MnCO3 and Fe3O4/Mn2O3 showed inferior removal efficiency. Though Fe3O4 showed higher surface area but its activity was lower than MnO2. Recently analogous activity was also observed by Zhang et al. in catalytic activation of peroxymonosulfate (PMS) for degradation of methylene blue.31

Overall, the catalytic activities were greatly enhanced in the composite Fe3O4/MnO2 material than the single component metal oxide. This revealed an obvious synergy between Fe3O4 and MnO2. This synergy can be originated from multiple components, multi valence, high surface area and porous structure of the Fe3O4/MnO2 microsphere.19 A synergistic effect of copper and cobalt was also observed in Cu–Co–O composite for phenol mineralization, which showed that dispersion of cobalt on copper oxide surface boosted the interaction between catalyst Lewis acid sites and ozone, which consequently increase in catalytic ozonation activity.42

The degradation data of phenolic mixture in the first 20 min was fitted to be first order kinetics. The highest apparent reaction rate constant on mesoporous Fe3O4/MnO2 was found to be 0.28 and 0.14 min−1 for Ph-CH3 and Ph-Cl, respectively. Meanwhile those for Ph-CH3 were 0.11 and 0.073 min−1 on MnO2 and Fe3O4, and 0.078 and 0.056 min−1 for Ph-Cl on MnO2 and Fe3O4, respectively. We did not directly compare the activity of this composite material with others reported, as normally quite different reaction conditions were used in published papers. From the reaction rate constants, a good synergetic effect was confirmed in Fe3O4/MnO2 again.

For the catalytic stability evaluation of the synthesized catalyst, Fe3O4/MnO2 was magnetically separated after reaction, and washed three times with deionized water and dried at 100 °C for recycling. The stability of catalyst was evaluated by their reuses performance. As seen in Fig. 8, when the catalyst was reused at pH 9, phenolic mixture removal decreased greatly from 80.6% to 76.3%, 75%, 73.8%, 73.1% and 70.1% respectively in 6 cycles. The catalyst also slightly lost its weight during each operation of recollection and recycling, as indicated by the blue column in Fig. 8. It was noticed that the catalytic activity loss was proportional to the catalyst weight loss, they both decreased to about 90% after 6 cycles. This meant the composite Fe3O4/MnO2 catalyst was very stable at pH 9, and it is also easy to separate and recycle for its magnetic property.


image file: c6ra03167f-f8.tif
Fig. 8 Stability test of Fe3O4/MnO2 composite in catalytic ozonation of phenolic mixture. Reaction conditions: [Fe3O4/MnO2]: 0.2 g L−1, [O3]: 2.5 mg min−1, [Ph-CH3]: 1 mM, [Ph-Cl]: 1 mM, initial pH: 9.

3.3 Reaction mechanism of Fe3O4/MnO2 catalytic ozonation

3.3.1 Ozone adsorption on the catalyst. It was already reported that gaseous ozone decomposition on the catalyst surface mainly consists two steps: the adsorption of ozone on the surface and desorption of the adsorbed intermediates.43 Lv et al. found that ozone molecular competed with water molecular to adsorb on the surface of catalyst and converted into hydroxyl radicals later.44 An ATR-FTIR method was firstly developed to reveal the competition of ozone adsorption with chemically adsorbed water on the surface of catalyst.28 In this paper, adsorption of ozone on the catalyst Fe3O4/MnO2 was also analyzed with ATR-FTIR at pH 9. During the analysis, D2O was used as the solvent instead of H2O to distinguish from the –OH on surface surface of the catalyst.

In Fig. 9(A), two peaks at 2262 and 1155 cm−1 appeared in the systems, which were assigned to the vibrations of hydrogen-bonded D2O on the catalyst surface. Fe3O4 showed weak peak at 2262 cm−1 and no peak presented at 1155 cm−1, and Fe3O4/MnO2 showed the highest adsorption. In the system with composite Fe3O4/MnO2 material, the intensities of both peaks decreased quickly with bubbling of ozone. In Fig. 9(B), the two peaks both disappeared from 5 min, and also did not present again at 10 or 15 min. This suggested that the adsorbed D2O was replaced by ozone molecular. The experimental data verified that ozone was adsorbed on the surface of Fe3O4/MnO2 while competing with water molecules. Then adsorbed ozone reacted with hydroxyl on the catalyst surface to convert to reactive radicals, and diffused into bulk solution. The addition of Mn was believed to enhance the amount of surface Lewis acid sites and thus promote the adsorption of ozone.28 In this case; the introduction of Mn in the composite material also benefited the adsorption of ozone on the surface, and resulted in generation of more reactive species.


image file: c6ra03167f-f9.tif
Fig. 9 ATR-FTIR spectra of different materials (A) and different time (B) in Fe3O4/MnO2 suspension in ozonation.

It was already reported that the mechanism of gaseous ozone decomposition consists mainly of redox steps: composites of transition metal oxides are useful for the catalyst to undergo oxidation and reduction, enhancing the decomposition of ozone.44 Therefore, the results suggest that the same procedure might occur in the catalyst aqueous suspension with ozone. The coexistence of Fe2+/Fe3+ (ref. 45) and Mn4+/Mn3+ (ref. 46) in Fe3O4/MnO2 increased the oxidation and reduction involved in the decomposition of ozone. The rate of ozone decomposition was obviously enhanced in the catalyst suspensions (Fig. 6), similarly to TOC removal in these systems.

Furthermore, the cyclic voltammetry (CV) behaviors of Fe3O4/MnO2, Fe3O4, and MnO2 electrodes were investigated in pH 9 solution under an air or ozone. As shown in Fig. 10, the amount of current was observed at electrode as Fe3O4/MnO2 > MnO2 > Fe3O4. The results indicate surface charge on Fe3O4/MnO2, MnO2, and Fe3O4. With the addition of ozone, a reduce current was observed with the Fe3O4/MnO2, MnO2, and Fe3O4 electrodes, verifying that the reduction reaction occurred on the surface of catalyst with the decomposition of O3.44 In general conditions ozone can oxidize Mn3+ to Mn4+ in Fe3O4/MnO2, considering the standard reduction potential E(Mn4+/Mn3+) = 0.95 V and standard reduction potential of E(O3/O2) = 2.07 V. Then the Fe2+ in composite can reduce the Mn4+ to its initial state Mn3+, E(Fe3+/Fe2+) = 0.77 V. Therefore, the efficient regeneration of Mn3+ surface species by this process would be responsible for the remarkable increase on the activity of organic oxidation.


image file: c6ra03167f-f10.tif
Fig. 10 CV scans results of (A) Fe3O4, (B) MnO2 and (C) Fe3O4/MnO2 electrodes at pH 9, before and after 10 min of ozonation. Scan rate: 30 mV s−1.
3.3.2 Quenching experiments. To reveal the efficient degradation mechanism of phenolic mixture, different kinds of radical scavengers were used in the oxidation processes. Fig. 11(A) showed that the presence of 5 mM t-BA in the phenolic mixture solution caused a 31.2% reduction of removal rate of Ph-CH3 at 30 min, and similarly Ph-Cl removal rate was decreased by 28.3% in Fig. 11(B). The quenching effect was more obvious when increasing the concentration of t-BA. The degradation rates of Ph-CH3 and Ph-Cl decreased by 66.5% and 55.3% with 10 mM t-BA, but this did not vary when more t-BA was added. This indicated the predominant function of hydroxyl radical in catalytic ozonation of phenols in basic solution. In our previous work we report superoxide radical to be the major reactive species in catalytic ozonation of organic contaminants. Superoxide radical was also described to be the main reactive species in the photocatalytic oxidation of toluene.19,47 In this work, 5 mM p-BQ, a widely recognized scavenger of superoxide radical, was used to evaluate its role in our system. The negligible inhibition effect indicated that superoxide radical did not contribute to the phenols degradation. Furthermore, 5 mM NaN3 was introduced to determine the possible role of singlet oxygen in catalytic ozonation in basic solution. The results in Fig. 11(A) and (B) showed that both phenols degradation were partially inhibited. The suppressions were 18.2% for Ph-CH3 and 2% for Ph-CH3, which indicated that singlet oxygen played a more important role in Ph-CH3 degradation. Higher concentrations of NaN3 were also tried, but the suppression effect was almost the same.
image file: c6ra03167f-f11.tif
Fig. 11 The influence of t-BA, p-BQ and NaN3 in catalytic ozonation of Ph-CH3 (A) and Ph-Cl (B) and (C) ESR spectrum at different pH. Reaction conditions: [catalyst]: 0.2 g L−1, [O3]: 2.5 mg min−1, [Ph-CH3]: 1 mM, [Ph-Cl]: 1 mM.

To verify the speculation of hydroxyl radical production, ESR experiments were performed to directly detect it. The result in Fig. 11(C) clearly showed the existence of ·OH radical at pH 9 in the system with Fe3O4/MnO2 suspension, and the peak intensity decreased at pH 11. This was because –OH in basic solution benefited the decomposition of ozone, but higher pH might also cause invalid annihilation between hydroxyl radicals.38 The degradation at high pH was comparatively lower in photocatalytic degradation of creatinine and phenol, showing similar decreasing effect at high pH.48 This can well explain the degradation trends of phenols in Fig. 6(A) and (B), that phenols degradation was accelerated in basic solution and pH 9 is the best choice. The signal of hydroxyl radical did not appear in the suspension of Fe3O4/MnO2 at pH 5 or 7. Previously, we reported that phenols degradation in MnO2 catalytic ozonation in weak acid solution was not due to the hydroxyl radical oxidation, but superoxide radical and other species.19

The ESR result obtained in this paper was consistent with that conclusion. Moreover, only very weak peak of hydroxyl radical presented in the ozonation at pH 9, this could possibly be due to two reasons. Firstly, phenols were easily attacked by ozone molecular; ozone was partially consumed by phenol before transformation into hydroxyl radicals. Secondly, to achieve a quick analysis of ESR, a smaller catalytic ozonation system was built and 0.25 mg min−1 of ozone was used. This much lower dosage of ozone input will also decrease the signal intensity in ESR. Based on the quenching experiments and ESR result, we concluded that hydroxyl radicals were primarily generated from catalytic decomposition of ozone in basic solution and attack phenols. Besides hydroxyl radical, singlet oxygen and ozone molecular also partially contributed to the phenols degradation. This is easy to understand because ozone molecular was also very powerful to attack phenols directly.

3.4 Reaction pathway of phenolic mixture

The intermediates of phenolic mixture mineralization with porous Fe3O4/MnO2 were illustrated through GC-MS to explore the reaction pathways.

Fig. 12 shows the evolution of organic components in the solution at different time, and the corresponding components are confirmed with MS and shown in Table 2. All of the identified compounds were unequivocally identified using the NIST98 library database. Result in Fig. 6(C) that phenolic mixtures were nearly completely mineralized.


image file: c6ra03167f-f12.tif
Fig. 12 The organic components in solution during Fe3O4/MnO2 catalytic ozonation of phenol mixture at different time [I: p-cresol; II: p-chlorophenol; III: hydroquinone; IV: muconic acid; V: p-benzoquinone; VI: malic acid; VII: hydroxyhydroquinone; VIII: chloromaleic acid; IX: p-chlorocatechol; X: maleic acid; XI: oxalic acid, XII: formic acid].
Table 2 Parent compounds and intermediates in the catalytic ozonation of phenolic mixturea
  Compounds R.T (min) m/z(R.A%)
a “R.T” means retention time, “R.A” means relative abundance.
I p-Cresol 5.6 107(100), 108(91.7), 77(25.9), 79(21.3)
II p-Chlorophenol 7.4 128(100), 127(31.1), 65(30.3), 64(13.7)
III Hydroquinone 3.9 110(100), 39(62.3), 55(21.2), 81(17.4)
IV Muconic acid 4.1 97(100), 96(75.1), 41(63.9), 51(40.4)
V p-Benzoquinone 6.2 108(100), 82(59.3), 109(44.1), 81(27.7)
VI Malic acid 6.7 133(100), 151(69.5), 32(39.2), 44(24.5)
VII Hydroxyhydroquinone 8.9 126(100), 52(41.2), 80(24.3), 39(20.11)
VIII Chloromaleic acid 11 149(100), 32(80), 44(60), 177(25)
IX p-Chlorocatechol 14.9 144(100), 146(38.1), 63(20.1), 147(14.8)
X Maleic acid 4.5 72(100), 45(57.0), 55(30.7), 43(17.0)
XI Oxalic acid 7.6 44(100), 57(81.3), 43(43.5), 56(18.5)
XII Formic acid 9.4 46(100), 45(62.4), 60(29.8), 68(17.4)


Initially Ph-CH3 and Ph-Cl separately showed their characteristic peaks. After 5 min reaction, the intensities of their peaks both decreased and seven new peaks appeared. These components with these components with low concentration were identified as hydroquinone, muconic acid, p-benzoquinone, malic acid, hydroxyhydroquinone, chloromaleic acid and p-chlorocatechol. It meant that a small amount of phenols opened their aromatic rings and small molecular organic acids were formed. With the reaction proceeding, more phenolic mixture was degraded and some intermediate products were further oxidized. Subsequently parent compounds of phenolic mixture completely disappeared after 30 min, and a very sharp peak of p-benzoquinone presented. Hydroquinone, malic acid, hydroxyhydroquinone, p-chlorocatechol, chloromaleic acid, p-chlorocatechol also disappeared and peaks for maleic acid, oxalic acid and formic acid was presented. From 5 to 10 and 30 min, the peak intensity for muconic acid continuously increased. At the end of the reaction, only little amount of formic acid and oxalic acid remained in the solution, which were due to their relatively higher resistance to oxidizing species and low concentration in solution. This trend was in consistent with the TOC result in Fig. 6(C) that phenolic mixtures were nearly completely mineralized.

According to the intermediates evolution in solution, we proposed the phenolic mixture mineralization pathway in mesoporous Fe3O4/MnO2 catalytic ozonation in Scheme 2.


image file: c6ra03167f-s2.tif
Scheme 2 Mineralization pathway for Ph-CH3 and Ph-Cl mixture in Fe3O4/MnO2 catalytic ozonation at pH 9.

4. Conclusions

Mesoporous Fe3O4/MnO2 composite exhibited much higher activity in catalytic ozonation and mineralization of cresol and chlorophenol mixture than Fe3O4 and MnO2, due to its high surface area, rich porosity and multi components, which provide more reaction sites on the surface of catalyst. pH 9 was found to be the optimal condition for the least metal leaching and highest catalytic activity. The catalyst is easily magnetically separated and recycled, and the activity almost kept unchanged in 6 cycles of catalyst reuse, excluding the influence of weight loss of catalyst. Ozone competed with water molecular to adsorb on the surface of Fe3O4/MnO2 and evolved into hydroxyl radical and other species. The degradation of cresol and chlorophenol was both mainly attributed to hydroxyl radical oxidation, along with little contribution of singlet oxygen and ozone molecular. The reaction pathway in mineralization of the phenolic mixture was proposed according to the GC-MS results obtained at different intervals.

Acknowledgements

The authors greatly appreciate the financial support from the National Natural Science Foundation of China (No. 21207133) and the National Science Fund for Distinguished Young Scholars of China (No. 51425405).

Notes and references

  1. O. Botalova, J. Schwarzbauer, T. Frauenrath and L. Dsikowitzky, Water Res., 2009, 43, 3797–3812 CrossRef CAS PubMed.
  2. A. Mantilla, G. Jacome-Acatitla, G. Morales-Mendoza, F. Tzompantzi and R. Gomez, Ind. Eng. Chem. Res., 2011, 50, 2762–2767 CrossRef CAS.
  3. C. C. Chang, S. K. Tseng, C. C. Chang and C. M. Ho, Bioresour. Technol., 2003, 90, 323–328 CrossRef CAS PubMed.
  4. M. Kragulj, J. Trickovic, A. Kukovecz, B. Jovic, J. Molnar, S. Roncevic, Z. Konya and B. Dalmacija, RSC Adv., 2015, 5, 24920–24929 RSC.
  5. C. F. Yang, Q. A. Yu, L. J. Zhang and J. Z. Feng, Chem. Eng. J., 2006, 117, 179–185 CrossRef CAS.
  6. Z. L. Li, J. Nan, J. Q. Yang, X. Jin, A. Katayama and A. J. Wang, RSC Adv., 2015, 5, 89157–89163 RSC.
  7. M. Chowdhury, O. Oputu, M. Kebede, F. Cummings, O. Cespedes, A. Maelsand and V. Fester, RSC Adv., 2015, 5, 104991–105002 RSC.
  8. Y. Song, J. Jiang, J. Ma, S. Y. Pang, Y. Z. Liu, Y. Yang, C. W. Luo, J. Q. Zhang, J. Gu and W. Qin, Environ. Sci. Technol., 2015, 49, 11764–11771 CrossRef CAS PubMed.
  9. H. Sun, G. Zhou, Y. Wang, A. Suvorova and S. Wang, ACS Appl. Mater. Interfaces, 2014, 6, 16745–16754 CAS.
  10. X. Quan, X. Ruan, H. Zhao, S. Chen and Y. Zhao, Environ. Pollut., 2007, 147, 409–414 CrossRef CAS PubMed.
  11. Y. Tu, Y. Xiong, S. Tian, L. Kong and C. Descorme, J. Hazard. Mater., 2014, 276, 88–96 CrossRef CAS PubMed.
  12. R. C. Martins, R. J. G. Lopes and R. M. Quinta-Ferreira, Chem. Eng. J., 2010, 165, 678–685 CrossRef CAS.
  13. K. Ikehata and M. G. El-Din, Ozone: Sci. Eng., 2005, 27, 83–114 CrossRef CAS.
  14. L. Zhao, J. Ma and X. Zhai, Environ. Sci. Technol., 2009, 43, 5094–5099 CrossRef CAS PubMed.
  15. C. A. Orge, M. F. R. Pereira and J. L. Faria, Appl. Catal., B, 2015, 174, 113–119 CrossRef.
  16. J. D. Xiao, Y. B. Xie, F. Nawaz, S. Jin, F. Duan, M. J. Li and H. B. Cao, Appl. Catal., B, 2016, 181, 420–428 CrossRef CAS.
  17. Y. X. Wang, Y. B. Xie, H. Q. Sun, J. D. Xiao, H. B. Cao and S. B. Wang, J. Hazard. Mater., 2016, 301, 56–64 CrossRef CAS PubMed.
  18. M. Sui, S. Xing, L. Sheng, S. Huang and H. Guo, J. Hazard. Mater., 2012, 227–228, 227–236 CrossRef CAS PubMed.
  19. F. Nawaz, Y. B. Xie, H. B. Cao, J. D. Xiao, Y. Q. Wang, X. H. Zhang, M. J. Li and F. Duan, Catal. Today, 2015, 258, 595–601 CrossRef CAS.
  20. R. Yin, W. Guo, X. Zhou, H. Zheng, J. Du, Q. Wu, J. Chang and N. Ren, RSC Adv., 2016, 6, 19265–19270 RSC.
  21. T. Zhang and J. Ma, J. Mol. Catal. A: Chem., 2008, 279, 82–89 CrossRef CAS.
  22. W. Qin, X. Li and J. Qi, Langmuir, 2009, 25, 8001–8011 CrossRef CAS PubMed.
  23. X. Li, Q. Zhang, L. Tang, P. Lu, F. Sun and L. Li, J. Hazard. Mater., 2009, 163, 115–120 CrossRef CAS PubMed.
  24. S. T. Xing, X. Y. Lu, L. M. Ren and Z. C. Ma, RSC Adv., 2015, 5, 60279–60285 RSC.
  25. H. Zhao, Y. M. Dong, P. P. Jiang, G. L. Wang, J. J. Zhang and K. Li, Catal.: Sci. Technol., 2014, 4, 494–501 CAS.
  26. H. Zhao, Y. M. Dong, P. P. Jiang, G. L. Wang, J. J. Zhang and C. Zhang, Chem. Eng. J., 2015, 260, 623–630 CrossRef CAS.
  27. Z. C. Ma, L. Zhu, X. Y. Lu, S. T. Xing, Y. S. Wu and Y. Z. Gao, Sep. Purif. Technol., 2014, 133, 357–364 CrossRef CAS.
  28. A. H. Lv, C. Hu, Y. L. Nie and J. H. Qu, Appl. Catal., B, 2010, 100, 62–67 CrossRef CAS.
  29. L. Zhang, J. Lian, L. Wu, Z. Duan, J. Jiang and L. Zhao, Langmuir, 2014, 30, 7006–7013 CrossRef CAS PubMed.
  30. E. J. Kim, C. S. Lee, Y. Y. Chang and Y. S. Chang, ACS Appl. Mater. Interfaces, 2013, 5, 9628–9634 CAS.
  31. S. W. Zhang, Q. H. Fan, H. H. Gao, Y. S. Huang, X. Liu, J. X. Li, X. J. Xu and X. K. Wang, J. Mater. Chem. A, 2016, 4, 1414–1422 CAS.
  32. J. Peng, L. N. Feng, K. Zhang, J. J. Li, L. P. Jiang and J. J. Zhu, Chem.–Eur. J., 2011, 17, 10916–10923 CrossRef CAS PubMed.
  33. J. Z. Zhao, Z. L. Tao, J. Liang and J. Chen, Cryst. Growth Des., 2008, 8, 2799–2805 CAS.
  34. C. Hui, C. M. Shen, T. Z. Yang, L. H. Bao, J. F. Tian, H. Ding, C. Li and H. J. Gao, J. Phys. Chem. C, 2008, 112, 11336–11339 CAS.
  35. H. B. Lin, J. N. Hu, H. B. Rong, Y. M. Zhang, S. W. Mai, L. D. Xing, M. Q. Xu, X. P. Li and W. S. Li, J. Mater. Chem. A, 2014, 2, 9272–9279 CAS.
  36. D. P. Dubal, W. B. Kim and C. D. Lokhande, J. Phys. Chem. Solids, 2012, 73, 18–24 CrossRef CAS.
  37. J. Staehelin and J. Hoigne, Environ. Sci. Technol., 1982, 16, 676–681 CrossRef CAS.
  38. J. Ma, M. Sui, T. Zhang and C. Guan, Water Res., 2005, 39, 779–786 CrossRef CAS PubMed.
  39. H. Einaga and S. Futamura, Appl. Catal., B, 2005, 60, 49–55 CrossRef CAS.
  40. R. C. Martins and R. M. Quinta-Ferreira, Appl. Catal., B, 2009, 90, 268–277 CrossRef CAS.
  41. J. D. Xiao, Y. B. Xie, Q. Z. Han, H. B. Cao, Y. X. Wang, F. Nawaz and F. Duan, J. Hazard. Mater., 2016, 304, 126–133 CrossRef CAS PubMed.
  42. Y. Dong, L. Wu, G. Wang, H. Zhao, P. Jiang and C. Feng, Bull. Korean Chem. Soc., 2013, 34, 3227 CrossRef CAS.
  43. J. J. Lin, A. Kawai and T. Nakajima, Appl. Catal., B, 2002, 39, 157–165 CrossRef CAS.
  44. A. H. Lv, C. Hu, Y. L. Nie and J. H. Qu, Appl. Catal., B, 2012, 117, 246–252 CrossRef.
  45. L. J. Xu and J. L. Wang, Environ. Sci. Technol., 2012, 46, 10145–10153 CAS.
  46. H. Zhao, Y. Dong, P. Jiang, G. Wang, J. Zhang, K. Li and C. Feng, New J. Chem., 2014, 38, 1743–1750 RSC.
  47. M. Q. Yang, Y. Zhang, N. Zhang, Z. R. Tang and Y. J. Xu, Sci. Rep., 2013, 3, 3314 Search PubMed.
  48. M. G. Antoniou and D. D. Dionysiou, Catal. Today, 2007, 124, 215–223 CrossRef CAS.

This journal is © The Royal Society of Chemistry 2016