DOI:
10.1039/C6RA03116A
(Paper)
RSC Adv., 2016,
6, 34439-34446
Selective CO adsorbent CuCl/AC prepared using CuCl2 as a precursor by a facile method
Received
2nd February 2016
, Accepted 24th March 2016
First published on 30th March 2016
Abstract
Activated carbon (AC) supported CuCl (CuCl/AC) has been prepared with CuCl2 as precursor by a monolayer dispersion method. The samples are investigated for CO adsorption and characterized by inductively coupled plasma optical emission spectrometry, X-ray diffraction, N2 adsorption/desorption and X-ray photoelectron spectroscopy. The characterization results reveal that CuCl2 supported on AC can be completely converted to CuCl after activation at 543 K in N2. The resulting adsorbent displays high CO adsorption capacity, high CO/N2, CO/CH4 and CO/CO2 adsorption selectivities and excellent reversibility, and the adsorption equilibrium isotherms of CO on the adsorbents at temperatures up to 333 K can be well fitted by both the Langmuir and Sips models.
1. Introduction
Carbon monoxide is widely used in the chemical industry as an important raw material.1 The main methods for production of CO are the steam reforming of natural gas and coal gasification, which produce a synthesis gas mixture containing CO, CO2, CH4, N2, H2 and H2O.2 The gas mixture must be then separated to produce high purity CO. In addition, huge amounts of CO are released from tail gases of some industrial oxidation processes, such as coke oven gas, blast furnace gas, carbon black manufacturing tail gas, etc.3–5 The CO from these tail gases should be separated and used from both the industrial and environmental point of views. Furthermore, some gases containing trace amounts of CO must be purified to a low CO level before usage. For example, the anode catalysts of hydrogen fuel cells can be poisoned by CO, and the CO in H2-rich streams must be removed to less than 0.2 ppm prior to use.6,7
Proven technologies for CO separation from gas mixtures mostly rely on cryogenic distillation, liquid absorption and adsorption processes.8 Cryogenic distillation is suitable only when the CO-containing gas stream has a relatively low concentration of N2 due to the similar boiling points.9,10 Liquid absorption processes, such as the absorption of CO in ammoniacal cuprous chloride and aromatic CuAlCl4 solution (COSORB), apart from its relatively high energy consumptions and operational costs, have the disadvantage of the instability of Cu+ ions, which always react to give Cu0 and Cu2+.11,12 Instead, adsorption processes like the pressure swing adsorption (PSA) and the temperature swing adsorption (TSA) based on cyclic adsorption/desorption of gases on adsorbents have been widely used in CO separation due to low energy costs and easy operations.13,14
For the adsorption-based separation, adsorbents are the key to directly determine the separation performance.15 It has been found that porous materials including zeolites,16,17 activated carbon18,19 and metal–organic frameworks (MOFs)20,21 can adsorb CO. However, it is difficult to use these materials to selectively separate CO from gas mixtures due to their lower adsorption capacity and low selectivity for CO. Cu(I) π-complexation adsorbents have been paid great attention for the olefin/paraffin separation22,23 and CO separation.24–31 The advantage of these adsorbents is that the π-complexation bonds formed between CO and Cu(I) ions on the adsorbents are stronger than those formed by van der Waals forces alone, so it is possible to achieve high adsorption capacity and high selectivity for CO.13 On the other hand, these types of bonds are still sufficiently weak to be broken by using simple engineering operations such as raising the temperature and/or decreasing the pressure.24 Golden et al.25 prepared the Cu(I) π-complexation adsorbents by impregnating activated alumina with Cu2+ salts and then reducing Cu2+ into Cu+ using the reducing gas of CO or H2. Hirai et al.26,27 and Tamon et al.28 prepared the Cu(I) π-complexation adsorbents by dispersing CuCl onto the surfaces of porous supports using dispersing reagents such as concentrated hydrochloric acid or organic solvents and then heating the mixtures at high temperatures in N2. Xie et al.29 obtained CuCl/zeolite adsorbents with high adsorption capacity and selectivity for CO by dispersing CuCl powder spontaneously onto the surfaces of zeolites at high temperatures in an inert atmosphere. Recently, Ma et al.30 and Peng et al.31 prepared the Cu(I)-based CO adsorbents by impregnating the supports such as activated carbon or metal–organic framework MIL-100(Fe) (MIL: Materials of Institute Lavoisier) with an aqueous solution of equimolar CuCl2 and Cu(HCOO)2 and then activating at high temperatures under CO atmosphere or vacuum. Generally, the Cu(I) π-complexation adsorbents prepared with the impregnation method and the dispersion method using dispersing reagents, apart from the intensive preparation processes, always have lower copper loadings compared with the solid-state dispersion method. However, in the preparation of the adsorbents with CuCl as precursor, all the steps and storage must be performed in a dry inert atmosphere to protect Cu+ ions from oxidation and hydrolysis.
It is known that CuCl2 can be converted to CuCl when treated at high temperatures, and is chemically more stable and commercially cheaper than CuCl.32 In this work, CuCl/AC adsorbent for CO separation was prepared using CuCl2 as a precursor through a monolayer dispersion method. The aim of the work is to develop a CO adsorbent with cheap raw materials and a facile preparation method. The obtained adsorbents were investigated for CO adsorption and characterized by inductively coupled plasma optical emission spectrometry (ICP-OES), X-ray powder diffraction (XRD), N2 adsorption/desorption and X-ray photoelectron spectroscopy (XPS).
2. Experimental
2.1 Materials
Wooden activated carbon (AC) and CuCl2·2H2O (AR) were purchased from Tianjin Guangfu Fine Chemical Research Institute. CO, CO2, CH4, N2 and helium gases were purchased from Tianjin LiuFang Gas Co., Ltd. All the gases had purities of or above 99.99%.
2.2 Preparation of CuCl/AC adsorbents
The calculated amounts of AC powder and CuCl2·2H2O was mixed and grinded thoroughly, and then 2.5 g of the mixture was placed in a quartz tube for the activation at set temperatures in the stream of 50 cm3 min−1 of N2 for 8 h. For the copper loadings of 4.0, 5.0, 6.0, 7.0 and 8.0 mmol g−1 AC, the samples were activated at 543 K, and denoted as CuCl2(X)/AC and CuCl(X)/AC before or after the activation, respectively, where X is the copper loadings in moles per gram AC. The sample with the copper loadings of 7.0 mmol g−1 AC was activated at different temperatures of 473, 523, 543, 563 and 583 K, respectively, to obtain the Cu-based adsorbents under different activation temperatures.
2.3 Characterizations
The copper loadings in the samples were determined by inductively coupled plasma optical emission spectrometry (VISTA-MPX, Varian). Nitrogen adsorption/desorption equilibrium isotherms of the samples were measured at liquid N2 temperature (77 K) on a Micromeritics TriStar 3000 automated physisorption instrument. Prior to the measurements, all the samples were degassed at 573 K for 4 h. The specific surface areas were calculated from the isotherms using the Brunauer–Emmett–Teller (BET) method. The total pore volumes were estimated from the adsorption equilibrium isotherms at the relative pressure (p/p0) near to 1. Powder X-ray diffraction patterns were obtained on a Rigaku D/max-2500 diffractometer employing the graphite filtered Cu Kα radiation (λ = 0.154 nm) with a scanning rate of 8° min−1 in the 2θ ranges from 5° to 80°. X-ray photoelectron spectroscopy was carried out on a Perkin-Elmer PHI 1600 ESCA XPS equipment with an Al Kα X-ray radiation source (1486.6 eV). The binding energies were calibrated referring to C 1s peak at 284.6 eV.
2.4 Adsorption measurements
Adsorption equilibrium isotherms of CO, CO2, CH4 and N2 were measured using a static volumetric method.33,34 The apparatus consisted of an adsorption unit (AU), a loading cell (LC), two pressure sensors, a temperature-controlled electric oven, a mechanical vacuum pump and two gas reservoirs. The volumes of the adsorption unit and the loading cell were determined by water filling and the expansion of helium gas, respectively. Prior to the adsorption measurement, 1 g adsorbent inside the adsorption unit was degassed in situ at 473 K under the vacuum of the mechanical pump for 30 min to remove the gases impurities retained inside. After degasification, the adsorption unit was cooled down to the required adsorption temperature, and the adsorbate, CO, CO2, CH4, or N2, was introduced into the loading cell, and its pressure and temperature were recorded when the values were stabilized. Then the valve connected the loading cell and the adsorption unit was opened, allowing the gas to contact with the adsorbents. The adsorption usually reached to equilibrium in about 10 min, but to guarantee that the adsorption fully reached to equilibrium, 30 min of adsorption time was used for each point. After the pressure value was recorded, the valve was closed and an additional amount of the adsorbate was fed into the loading cell to obtain another adsorption equilibrium point at a higher pressure. The same operation was repeated to cover the whole pressure range at a constant temperature. The adsorption measurements of CO were carried out at the temperature range of 303 to 333 K and pressures up to 500 kPa, and the adsorption measurements of CO2, CH4, or N2 were carried out at 303 K and pressures up to 500 kPa. The adsorbed amounts were calculated according to the mass balance equation that was derived from the generalized equation of state before and after adsorption equilibrium: |
 | (1) |
where q is the adsorbed amount per unit weight of adsorbent (mmol g−1), p is the experimental pressure (kPa), T is the experimental temperature (K), m is the mass of the adsorbent (g), R is the universal gas constant (J mol−1 K−1), Z is the compressibility factor obtained from Benedict–Webb–Rubin–Starling equation of state, and V is the volume (cm3). Superscripts 1 and 2 represent the state before and after adsorption equilibrium, respectively.
2.5 Adsorption equilibrium isotherm equations
Adsorption equilibrium isotherms provide useful information for the adsorbate–adsorbent interactions and the surface properties and affinities of the adsorbents. So it is necessary to establish an accurate mathematical model for the adsorption equilibrium isotherms. Many models have been established to describe the adsorption equilibrium isotherms, such as Langmuir, Freundlich, Sips (Langmuir–Freundlich), Toth, etc.35–38 In this study, the Langmuir and Sips models were used to correlate the adsorption equilibrium isotherms of CO at temperatures up to 333 K. The Langmuir model is generally used to describe the monolayer adsorption for the structurally homogeneous adsorbents, in which the adsorption may occur at a fixed number of localized sites.39,40 The Langmuir equation is given by:where q is the amounts adsorbed in equilibrium with the pressure of adsorbate (mmol g−1), qm is the maximum adsorption amount (mmol g−1), p (kPa) is the equilibrium pressure of the adsorbate in the gas phase and b (kPa−1) is the adsorption equilibrium constant.
The Sips equation41,42 is a combination of the Langmuir and Freundlich models for predicting the behavior of the heterogeneous adsorption systems, and can be written as:
|
q = qmbp1/n/(1 + bp1/n)
| (3) |
where
n is a dimensionless isotherm parameter characterizing the heterogeneity of the adsorption.
To estimate the fitting accuracy of the proposed model for the experimental data, an error function based on the average percent deviation was calculated according to:
|
 | (4) |
where
D (%) is the average percent deviation,
N is the number of data points available in the adsorption equilibrium isotherms, and
qexp and
qcal are the experimental and calculated amounts adsorbed (mmol g
−1), respectively.
3. Results and discussion
3.1 Adsorption of CO on CuCl/AC adsorbents
Fig. 1 shows the effect of the activation temperature under N2 atmosphere on CO adsorption capacity on the adsorbent with copper loadings of 7 mmol g−1 AC. It can be seen that the CO adsorption capacity increases with increasing the activation temperature from 473 to 543 K, and does not increase further with further increasing the activation temperature to 583 K. The CO adsorption on CuCl/AC adsorbents is based on the π-complexation between CO and the active components of Cu+ ions on the adsorbents. The precursors of Cu2+ ions were completely converted into the active components of Cu+ ions at 543 K under N2 atmosphere (see results of XPS below), so the CO adsorption capacity reached to the maximum and does not increase further with further increasing the activation temperature to 583 K. Thus, the optimal activation temperature in N2 atmosphere is 543 K. This facile activation conditions can lower the preparation costs of the CuCl/AC adsorbent.
 |
| Fig. 1 Adsorption equilibrium isotherms of CO on the adsorbent with copper loadings of 7 mmol g−1 AC under different activation temperatures at 303 K. | |
Fig. 2 illustrates the adsorption equilibrium isotherms of CO on AC and the CuCl/AC adsorbents with different copper loadings at 303 K. The adsorbents were activated at 543 K for 8 h in N2 atmosphere. As shown in Table 1, the measured Cu contents by ICP-OES are close to those used in the materials. It is seen from Fig. 2 that the CuCl/AC adsorbents show significantly higher adsorption capacities compared to the AC support, implying that the loading of CuCl onto the AC is crucial to obtain adsorbents with high CO adsorption capacity. When the copper loadings increase to 7.0 mmol g−1 AC, the CO adsorption amounts at 100 kPa increase from 0.24 to 2.95 mmol g−1. With further increasing the copper loadings to 8.0 mmol g−1 AC, the CO adsorption capacity does not increase further. The results indicate that the monolayer dispersion capacity of CuCl on AC is 7 mmol g−1 AC. With further increasing the copper loadings to 8.0 mmol g−1 AC, the copper loadings exceed the monolayer dispersion capacity. The excess copper species may cumulate on the monolayer, making the layer thicker, but the exposed active sites of Cu+ ions are unchanged compared with those of CuCl(7.0)/AC. Anyway, the layer of copper species is still too thin to be detected by XRD.
 |
| Fig. 2 Adsorption equilibrium isotherms of CO on AC and the CuCl/AC adsorbents with different copper loadings at 303 K. | |
Table 1 Cu contents and textural properties of AC and CuCl2 loaded AC after activation
Samples |
Normal Cu contenta (wt%) |
Cu contentb (wt%) |
BET surface area (m2 g−1) |
Total pore volume (cm3 g−1) |
Average pore diameterc (nm) |
Calculated from designed compositions. Determined by ICP-OES. Adsorption average pore diameter (4 V A−1 by BET). |
AC |
— |
— |
1784 ± 17 |
1.40 |
3.14 |
CuCl(5.0)/AC |
21.4 |
21.1 |
725 ± 6 |
0.62 |
3.41 |
CuCl(7.0)/AC |
26.5 |
25.7 |
478 ± 3 |
0.45 |
3.77 |
CuCl(8.0)/AC |
28.6 |
27.7 |
383 ± 2 |
0.38 |
3.98 |
Table 2 summarized the CO adsorption capacities of the prepared CuCl/AC adsorbent and those reported in literature. In comparison, the CuCl(7.0)/AC adsorbent in this work exhibits a higher CO adsorption capacity of 2.95 mmol g−1 than other adsorbents in the literature. This can be attributed to both the used AC support with high surface areas and pore volumes and the solid-state dispersion method for the preparation of the CuCl/AC adsorbent in this work, which results in more highly dispersed active components of Cu+ ions on CuCl(7.0)/AC than other adsorbents in the literature.
Table 2 Comparison of CO adsorption capacities at 100 kPa on the adsorbent of the present work with those reported in literatures
Adsorbents |
Copper salts |
Copper loading method |
Adsorption temperature |
Adsorption capacity (mmol g−1) |
Refs |
Zeolite 5A |
— |
— |
298 K |
1.2 |
1 |
Zeolite 13X |
— |
— |
298 K |
0.5 |
1 |
BPL AC |
— |
— |
298 K |
0.35 |
18 |
UTSA-16 |
— |
— |
298 K |
0.28 |
20 |
MIL-101(Cr) |
— |
— |
288 K |
0.6 |
21 |
CuCl/γ-Al2O3 |
CuCl2 |
Impregnation |
303 K |
0.63 |
25 |
CuCl/AC |
CuCl |
Dispersion using HCl |
323 K |
1.0 |
28 |
CuCl/Y |
CuCl |
Solid-state dispersion |
303 K |
2.4 |
29 |
Cu(I)/AC |
CuCl2 + Cu(HCOO)2 |
Impregnation |
298 K |
2.5 |
30 |
Cu(I)/MIL-100(Fe) |
CuCl2 + Cu(HCOO)2 |
Impregnation |
298 K |
2.78 |
31 |
CuCl(7.0)/AC |
CuCl2 |
Solid-state dispersion |
303 K |
2.95 |
This work |
3.2 Characterization of CuCl/AC adsorbents
Fig. 3 shows the XRD patterns of CuCl2 and CuCl2 loaded AC samples before and after activation at 543 K for 8 h in N2. It can be seen that, before activation, the CuCl2/AC samples show the diffraction peaks of CuCl2,43 and the reflection intensities of the peaks increase with increasing the copper loadings. After activation, neither CuCl2 nor CuCl are observed in the CuCl/AC samples, suggesting that CuCl is highly dispersed on the surfaces of AC support. The absence of CuCl reflections in XRD patterns might be due to that the smaller crystallites of highly dispersed CuCl are undetectable by XRD.44 A high dispersion of the copper salts on AC made the active components of CuCl tend to spread rather than agglomerate on the surfaces of AC support.
 |
| Fig. 3 XRD patterns of CuCl2 and CuCl2 loaded AC before and after activation. | |
Fig. 4 shows the nitrogen adsorption/desorption equilibrium isotherms of AC support and the prepared CuCl/AC adsorbents with different copper loadings at 77 K. The N2 adsorption amounts apparently decrease with the increase of the copper loadings. The BET surface area, pore volume and average pore diameters of AC and CuCl/AC samples are summarized in Table 1. While the specific surface area and pore volume of the samples decrease gradually, the average pore diameter of the samples increases with the increase in CuCl loadings. The behavior of decreased surface area and pore volume is attributed to the occupation of the partial surface areas and the pore volumes of AC by CuCl, similar to the results on CuCl-loaded MIL-100(Fe).31 As more micropores are occupied, it results in an increased average pore sizes because the percentage of the available mesopores in AC increases. The similar observation was found by Ramli et al.45
 |
| Fig. 4 N2 adsorption/desorption equilibrium isotherms at 77 K on AC and CuCl2 loaded AC after activation. | |
XPS was used to investigate the valence states of the copper element in the prepared CuCl/AC adsorbents. Fig. 5 shows the XPS spectra of CuCl2, the purified CuCl and the sample with the copper loading of 7.0 mmol g−1 AC after activation at 543 K for 8 h in N2. In Fig. 5(A), the CuCl2 sample shows two intense peaks at 934.7 eV and 954.7 eV, accompanied with the Cu2+ satellite peak at 940–947 eV, assignable to the binding energies of Cu2+ 2p3/2 and Cu2+ 2p1/2.46 After activation, the CuCl(7.0)/AC sample shows the similar Cu 2p peaks as those of the standard CuCl sample, and the two peaks at 932.2 eV and 952.0 eV can be attributed to the binding energies of Cu 2p3/2 and Cu 2p1/2 respectively. There are no satellite peaks between these two peaks for the CuCl(7.0)/AC sample, implying that there are no Cu2+ in the sample, i.e., CuCl2 was reduced.47 However, due to the similar characteristics of Cu 2p profiles of Cu+ and Cu0, using Cu 2p spectrum alone is not sufficient to distinguish Cu+ from Cu0. In contrast to Cu 2p spectra, the auger Cu LMM spectra of Cu+ and Cu0 show significant difference. The kinetic energy of Cu0 auger peak is about 3 eV higher than that of Cu+ auger peak, so Cu LMM spectrum can be used to further determine the valence state of copper.48,49 From Fig. 5(B), the CuCl(7.0)/AC sample shows the similar Cu LMM spectrum as that for CuCl sample, and the auger peak appears at the binding energy of 571.1 eV, with the kinetic energy of 915.5 eV which is consistent with the auger kinetic energy of CuCl.50 The XPS results confirm that the chemical state of the copper element in CuCl(7.0)/AC is monovalent, indicating that CuCl2 supported on AC is completely converted to CuCl after the activation at 543 K for 8 h in N2.
 |
| Fig. 5 XPS spectra of CuCl(7.0)/AC referred to standard CuCl2 and CuCl samples: (A) Cu 2p spectra, (B) Cu LMM spectra. | |
3.3 Adsorption selectivity of CO to CO2, CH4 and N2
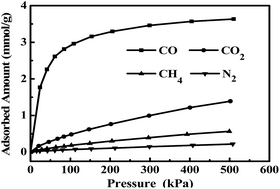
For gas separation, not only the adsorption capacity is important, but also the adsorption selectivity is a key factor. Fig. 6(A) gives the adsorption equilibrium isotherms of pure CO, CO2, CH4 and N2 on the CuCl(7.0)/AC adsorbent at 303 K. The adsorption equilibrium isotherm of CO is a typical type I isotherm, suggesting the strong interaction between the adsorbent and CO, and the adsorption equilibrium isotherms of CO2, CH4 and N2 are near to linear, demonstrating the weak interactions of the adsorbent with these gases.51 According to the adsorption equilibrium isotherms, the CO/CO2, CO/CH4 and CO/N2 adsorption selectivities were calculated by the method reported by Ma et al.30 Firstly, the adsorption equilibrium isotherms of pure CO, CO2, CH4 and N2 were fitted by the Langmuir model, and then the adsorption amounts of CO, CO2, CH4 and N2 at different given pressures of 20 to 500 kPa were calculated by the corresponding fitted Langmuir equations. At each given pressure, the CO/CO2, CO/CH4 and CO/N2 adsorption selectivity factors were calculated from the ratios of the calculated adsorption amounts of CO to those of CO2, CH4 and N2, respectively, and the corresponding selectivity curves as a function of the pressure were obtained, as shown in Fig. 6(B). It can be seen that the CO/CO2, CO/CH4 and CO/N2 adsorption selectivities decrease gradually with an increase in adsorption pressure. At a given pressure of 100 kPa, the CO adsorption capacity of 2.95 mmol g−1 at 303 K is much higher than those of CO2, CH4 and N2 adsorption capacities which are 0.47, 0.18 and 0.07 mmol g−1, respectively, and the CO/CO2, CO/CH4 and CO/N2 adsorption selectivity factors are 6.28, 16.39 and 42.14, respectively. Apparently, the adsorbent can preferentially adsorb CO over CO2, CH4 and N2, which is ascribed to the stronger interaction between the highly dispersed CuCl and CO via a π-complexation and the weaker van der Waals and electrostatic interactions of CO2, CH4 and N2 with the adsorbent.24 The results demonstrate that the prepared CuCl/AC adsorbent with high CO adsorption capability and adsorption selectivity has broad prospects for the effective separation of CO from the gas mixtures containing CO, CO2, CH4 and N2.
 |
| Fig. 6 Adsorption equilibrium isotherms of CO, CO2, CH4 and N2 on CuCl(7.0)/AC at 303 K (A) and CO adsorption selectivity (B). | |
3.4 Reversible adsorption/desorption of CuCl/AC adsorbent
For an ideal adsorbent for gas separation, it is required to be reversible for multiple adsorption and desorption cycles, and the adsorption and desorption cycle operations should be carried out at the same temperature. The optimum operation temperature must be determined before the cyclic CO adsorption. After adsorption of CO on CuCl(7.0)/AC, the desorptions were carried out in situ by venting off the gas, vacuuming for 30 min with the mechanical vacuum pump at temperatures of 303, 313, 323, 333, 343, 353 and 373 K, respectively, and the corresponding CO adsorption capacities on the desorbed adsorbents were measured again at the same temperature of the desorption. Fig. 7 shows the effect of the operation temperature on the reversible adsorption capacity of CO on CuCl(7.0)/AC. It can be seen that the reversible CO adsorption capacity decreases with increasing the operation temperatures from 303 to 373 K, and the reversible CO adsorption capacity at 100 kPa is as high as 2.53 mmol g−1 at the operation temperature of 303 K, which is close to the CO adsorption amounts of 2.95 mmol g−1 of the fresh adsorbent. The result implies that the adsorbed CO on CuCl(7.0)/AC could be desorbed at lower temperature under vacuum, which is attributed to the π-complexation bonds formed between CO and Cu+ ions on the adsorbents which are weak and can be easily broken using simple engineering operations.24 This lower operation temperature can greatly reduce the operation costs in CO separation processes compared with the higher operation temperature of 343 K of CuCl/zeolites.29 Furthermore, the adsorption/desorption cycles with the adsorption and desorption at 303 K were repeated for six times on CuCl(7.0)/AC. The results in Fig. 8 show that the CO adsorption capacities are nearly identical in the six cycles, indicating that the CO adsorption performance of the adsorbent is stable. The results demonstrate that the CuCl/AC CO adsorbent can be repeatedly used for the CO adsorption and desorption at lower operation temperature in CO separation processes with the CO adsorption capacity being not changed.
 |
| Fig. 7 Reversible adsorption of CO on CuCl(7.0)/AC at different operation temperatures. | |
 |
| Fig. 8 The cyclic CO adsorption capacity at 100 kPa on CuCl(7.0)/AC with the adsorption and desorption at 303 K. | |
3.5 CO adsorption equilibrium isotherms on CuCl/AC adsorbent and simulation
Adsorption equilibrium data of CO on CuCl(7.0)/AC at 303, 313, 323 and 333 K are given in Fig. 9. The Langmuir and Sips models were used to correlate the experimental data, and the fitting parameters with the average percent deviations are listed in Table 3. It can be observed from Fig. 9 that the CO adsorption amounts decrease with the increase of the temperatures at the same CO pressure, indicating that the adsorption of CO on CuCl/AC is an exothermic process. In addition, at all the temperatures, the CO adsorption amounts increase sharply with increasing CO pressures at the pressures below 100 kPa, which is caused by the π-complexation between CO and CuCl on the adsorbent.31 According to Table 3, the experimental data are well fitted by both the Langmuir and Sips models with an average percent deviation value of less than 2%. The parameter n of the Sips equation is regarded as the heterogeneity of system, and if n is far away from the unity, the system is more heterogeneous.52 In Table 3, the n values of the Sips equation are close to unity, indicating that minor heterogeneity exists on the surfaces of CuCl/AC. The fitting results show that the monolayer adsorption is predominant for the adsorption of CO on CuCl/AC, which further demonstrate that the active components of CuCl are well dispersed on the surfaces of AC.
 |
| Fig. 9 Experimental and correlated isotherms by Langmuir eqn (A) and Sips eqn (B) for CO adsorption on CuCl(7.0)/AC at different temperatures. | |
Table 3 Langmuir and Sips fitting parameters with average percent deviations for CO adsorption on CuCl(7.0)/AC
T (K) |
Langmuir model |
Sips model |
qm (mmol g−1) |
b (kPa−1) |
D (%) |
qm (mmol g−1) |
b (kPa−1) |
n |
D (%) |
303 |
3.78 |
0.0355 |
1.03 |
3.82 |
0.0422 |
1.052 |
0.67 |
313 |
3.63 |
0.0284 |
1.23 |
3.68 |
0.0352 |
1.064 |
0.93 |
323 |
3.42 |
0.0248 |
1.25 |
3.46 |
0.0294 |
1.051 |
1.19 |
333 |
3.22 |
0.0203 |
1.21 |
3.28 |
0.0245 |
1.059 |
0.83 |
4. Conclusions
CuCl/AC adsorbent for selective separation of CO has been successfully prepared using CuCl2 as precursor by a monolayer dispersion method. CuCl2 supported on AC can be completely converted to highly dispersed CuCl after activation at 543 K in N2 atmosphere. The obtained CuCl/AC adsorbent with the copper loading of 7 mmol g−1 AC achieves a high CO adsorption capacity of 3.63 mmol g−1 at 303 K, and the selectivity factors of CO/CO2, CO/CH4 and CO/N2 are 6.28, 16.39 and 42.14 at 100 kPa, respectively. This CuCl/AC adsorbent could be repeatedly used for the CO adsorption and desorption at lower operation temperature in CO separation processes. The monolayer adsorption is predominant for the adsorption of CO on the CuCl/AC adsorbent.
Acknowledgements
This work has been supported by Natural Science Foundation of China with Grant No. 21276183.
Notes and references
- D. Saha and S. Deng, J. Chem. Eng. Data, 2009, 54, 2245–2250 CrossRef CAS.
- N. Heymans, B. Alban, S. Moreau and G. De Weireld, Chem. Eng. Sci., 2011, 66, 3850–3858 CrossRef CAS.
- T. Harlacher, T. Melin and M. Wessling, Ind. Eng. Chem. Res., 2013, 52, 10460–10466 CrossRef CAS.
- T. Harlacher, M. Scholz, T. Melin and M. Wessling, Ind. Eng. Chem. Res., 2012, 51, 12463–12470 CrossRef CAS.
- G. Zarca, I. Ortiz and A. Urtiaga, Chem. Eng. J., 2014, 252, 298–304 CrossRef CAS.
- E. L. Romero and B. A. Wilhite, Chem. Eng. J., 2012, 207–208, 552–563 CrossRef CAS.
- L. C. Pérez, P. Koski, J. Ihonen, J. M. Sousa and A. Mendes, J. Power Sources, 2014, 258, 122–128 CrossRef.
- G. Zarca, I. Ortiz and A. Urtiaga, J. Membr. Sci., 2013, 438, 38–45 CrossRef CAS.
- G. S. Patil, S. Baruah and N. N. Dutta, Gas Sep. Purif., 1991, 5, 2–8 CrossRef CAS.
- F. Kasuya and T. Tsuji, Gas Sep. Purif., 1991, 5, 242–246 CrossRef CAS.
- D. J. Safarik and R. B. Eldridge, Ind. Eng. Chem. Res., 1998, 37, 2571–2581 CrossRef CAS.
- J. A. Hogendoorn, W. P. M. van Swaaij and G. F. Versteeg, Chem. Eng. J., 1995, 59, 243–252 CAS.
- R. T. Yang, Adsorbents: Fundamentals and Applications, Wiley, New York, 2003 Search PubMed.
- N. N. Dutta and G. S. Patil, Gas Sep. Purif., 1995, 9, 277–283 CrossRef CAS.
- L. Wang, J. Zhao, L. Wang, T. Yan, Y. Y. Sun and S. B. Zhang, Phys. Chem. Chem. Phys., 2011, 13, 21126–21131 RSC.
- H. Tsutaya and J. lzumi, Zeolites, 1991, 11, 90 CrossRef.
- G. Sethia, R. S. Somani and H. Chand Bajaj, RSC Adv., 2015, 5, 12773–12781 RSC.
- J. A. Delgado, V. I. Águeda, M. A. Uguina, J. L. Sotelo, P. Brea and C. A. Grande, Ind. Eng. Chem. Res., 2014, 53, 15414–15426 CrossRef CAS.
- F. V. S. Lopes, C. A. Grande, A. M. Ribeiro, J. M. Loureiro, O. Evaggelos, V. Nikolakis and A. E. Rodrigues, Sep. Sci. Technol., 2009, 44, 1045–1073 CrossRef CAS.
- V. I. Agueda, J. A. Delgado, M. A. Uguina, P. Brea, A. I. Spjelkavik, R. Blom and C. Grande, Chem. Eng. Sci., 2015, 124, 159–169 CrossRef CAS.
- K. Munusamy, G. Sethia, D. V. Patil, P. B. Somayajulu Rallapalli, R. S. Somani and H. C. Bajaj, Chem. Eng. J., 2012, 195–196, 359–368 CrossRef CAS.
- C. A. Grande, J. D. P. Araujo, S. Cavenati, N. Firpo, E. Basaldella and A. E. Rodrigues, Langmuir, 2004, 20, 5291–5297 CrossRef CAS PubMed.
- L. S. Cheng and R. T. Yang, Adsorption, 1995, 1, 61–75 CrossRef CAS.
- C. J. King, in Handbook of Separation Process Technology, ed. R. W. Rousseau, Wiley, New York, 1987 Search PubMed.
- T. C. Golden, W. C. Kratz, F. C. Wilhelm, R. Pierantozzi and A. Rokicki, US. Pat., 5.175.137, 1992.
- H. Hirai, K. Wada and M. Komiyama, Bull. Chem. Soc. Jpn., 1986, 59, 2217–2223 CrossRef CAS.
- H. Hirai, K. Wada, K. Kurima and M. Komiyama, Bull. Chem. Soc. Jpn., 1986, 59, 2553–2558 CrossRef CAS.
- H. Tamon, K. Kitamura and M. Okazaki, AIChE J., 1996, 42, 422–430 CrossRef CAS.
- Y. Xie, J. Zhang, J. Qiu, X. Tong, J. Fu, G. Yang, H. Yan and Y. Tang, Adsorption, 1997, 3, 27–32 CrossRef CAS.
- J. Ma, L. Li, J. Ren and R. Li, Sep. Purif. Technol., 2010, 76, 89–93 CrossRef CAS.
- J. Peng, S. Xian, J. Xiao, Y. Huang, Q. Xia, H. Wang and Z. Li, Chem. Eng. J., 2015, 270, 282–289 CrossRef CAS.
- M. S. Ferrandon, M. A. Lewis, F. Alvarez and E. Shafirovich, Int. J. Hydrogen Energy, 2010, 35, 1895–1904 CrossRef CAS.
- Z. Huang, L. Xu, J. Li, G. Guo and Y. Wang, J. Chem. Eng. Data, 2010, 55, 2123–2127 CrossRef CAS.
- M. Delavar, A. A. Ghoreyshi, M. Jahanshahi, S. Khalili and N. Nabian, RSC Adv., 2012, 2, 4490–4497 RSC.
- I. Langmuir, J. Am. Chem. Soc., 1918, 40, 1361–1403 CrossRef CAS.
- R. Sips, J. Chem. Phys., 1948, 16, 490–495 CrossRef CAS.
- H. Freundlich, J. Phys. Chem., 1906, 57, 385–471 CAS.
- S. Simonato, J. Möllmer, M. Lange, R. Gläser, R. Staudt and C. Feldmann, RSC Adv., 2016, 6, 12446–12452 RSC.
- X. Zhou, H. Yi, X. Tang, H. Deng and H. Liu, Chem. Eng. J., 2012, 200–202, 399–404 CrossRef CAS.
- C. Goel, H. Bhunia and P. K. Bajpai, RSC Adv., 2015, 5, 93563–93578 RSC.
- M. S. Shafeeyan, W. M. A. W. Daud, A. Shamiri and N. Aghamohammadi, Chem. Eng. Res. Des., 2015, 104, 42–52 CrossRef CAS.
- E. S. Sanz-Pérez, A. Arencibia, R. Sanz and G. Calleja, RSC Adv., 2015, 5, 103147–103154 RSC.
- Q. Zhang, L. Shi and X. Meng, RSC Adv., 2016, 6, 9589–9597 RSC.
- Y. Chen, C. Xie, Y. Li, C. Song and T. B. Bolin, Phys. Chem. Chem. Phys., 2010, 12, 5707–5711 RSC.
- N. A. S. Ramli and N. A. S. Amin, Appl. Catal., B, 2015, 163, 487–498 CrossRef CAS.
- J. Yu, Y. Luan, Y. Qi, J. Hou, W. Dong, M. Yang and G. Wang, RSC Adv., 2014, 4, 55028–55035 RSC.
- A. Yin, X. Guo, W.-L. Dai and K. Fan, J. Phys. Chem. C, 2009, 113, 11003–11013 CAS.
- T. Wang, J. Wang and Y. Wu, Corros. Sci., 2015, 97, 89–99 CrossRef CAS.
- L. P. Kazansky, Y. E. Pronin and I. A. Arkhipushkin, Corros. Sci., 2014, 89, 21–29 CrossRef CAS.
- J. F. Moulder, W. F. Stickle, P. E. Sobol and K. D. Bomben, Handbook of X-ray photoelectron spectroscopy, ed. J. Chastain and R. C. King, Perkin-Elmer Corporation, Minnesota, 1992 Search PubMed.
- X. Wu, B. Yuan, Z. Bao and S. Deng, J. Colloid Interface Sci., 2014, 430, 78–84 CrossRef CAS PubMed.
- H. Yi, Z. Wang, H. Liu, X. Tang, D. Ma, S. Zhao, B. Zhang, F. Gao and Y. Zuo, J. Chem. Eng. Data, 2014, 59, 1556–1563 CrossRef CAS.
|
This journal is © The Royal Society of Chemistry 2016 |
Click here to see how this site uses Cookies. View our privacy policy here.