Integrating error-prone PCR and DNA shuffling as an effective molecular evolution strategy for the production of α-ketoglutaric acid by L-amino acid deaminase

Gazi Sakir Hossainab, Hyun-dong Shinc, Jianghua Lib, Miao Wang*a, Guocheng Dub, Long Liu*b and Jian Chenb
aSchool of Food Science and Technology, Jiangnan University, Wuxi 214122, China. E-mail: mwang@jiangnan.edu.cn; Fax: +86-510-85329079; Tel: +86-510-85329079
bKey Laboratory of Carbohydrate Chemistry and Biotechnology, Ministry of Education, Jiangnan University, Wuxi 214122, China. E-mail: longliu@jiangnan.edu.cn; Fax: +86-510-85918309; Tel: +86-510-85918312
cSchool of Chemical and Biomolecular Engineering, Georgia Institute of Technology, Atlanta, GA 30332, USA

Received 1st February 2016 , Accepted 27th April 2016

First published on 28th April 2016


Abstract

L-Amino acid deaminases (LAADs; EC 1.4.3.2) belong to a family of amino acid dehydrogenases that catalyze the formation of α-keto acids from L-amino acids. In a previous study, a whole cell biocatalyst with the L-amino acid deaminase (pm1) from Proteus mirabilis was developed for the one-step production of α-ketoglutarate (α-KG) from L-glutamic acid, and the α-KG titer reached 12.79 g L−1 in a 3 L batch bioreactor. However, the product α-KG strongly inhibited pm1 activity, and the titer of α-KG was comparatively lower than expected. Therefore, in this study, multiple rounds of error-prone polymerase chain reaction (PCR) and gene shuffling were integrated for the molecular engineering of pm1 to further improve the catalytic performance and α-KG titer. A variant (pm1338g4), which contained mutations in 34 amino acid residues, was found to have enhanced catalytic efficiency. In a batch system, the α-KG titer reached 53.74 g L−1 when 100 g of monosodium glutamate was used as a substrate. Additionally, in a fed-batch biotransformation system, the maximum α-KG titer reached 89.11 g L−1 when monosodium glutamate was continuously fed at a constant rate of 6 g L−1 h−1 (from 4 to 23 h) with an initial concentration of 50 g L−1. Analysis of the kinetics of the mutant variant showed that these improvements were achieved due to enhancement of the reaction velocity (from 56.7 μM min−1 to 241.8 μM min−1) and substrate affinity (the Km for glutamate decreased from 23.58 to 6.56 mM). A possible mechanism for the enhanced substrate affinity was also evaluated by structural modeling of the mutant. Our findings showed that the integration of error-prone PCR and gene shuffling was an effective method for improvement of the catalytic performance of industrial enzymes.

Introduction

In directed evolution of enzymes, which mimics the Darwinian evolution process, and in classic directed evolution research, the gene encoding an enzyme of interest is randomized and expressed in an appropriate host. Suitable screening approaches are then used to recognize mutants that have specific properties, such as catalyzing an anticipated chemical reaction or binding to a specific substrate. Through iterative cycles of mutagenesis and amplification of selected mutants, useful mutations can be obtained, similar to unpretentious Darwinian evolution, but on a greatly reduced time scale. In this manner, populations of enzymes may be purposely evolved to obtain useful synthetic properties.1 The catalytic efficiency, solubility, and stability of an enzyme can be elaborately established by directed evolution. Error-prone polymerase chain reaction (ep-PCR), cassette mutagenesis, staggered extension protocol, and DNA shuffling are the most effective approaches for the evolution of certain enzymes. For example, using ep-PCR and DNA shuffling, a mutant variant of D-2-keto-3-deoxy-6-phosphogluconate aldolase was obtained that was capable of accepting both D- and L-glyceraldehyde as substrates.2 In another example, using stepwise ep-PCR and DNA shuffling, the product specificity and pH activity range were changed for the cyclodextrin glucanotransferase of alkaliphilic Bacillus sp. G-825-6.3 Specifically, in cases where chemical routes are challenging to duplicate, the compatibility of enzymes with minor aqueous environments has led to their growing use as biocatalysts in synthetic chemistry.4,5

Recently, many researchers have explored microbial bioconversion routes for the production of chemicals manufactured from petroleum-based feedstocks, which are not only nonrenewable but also unsustainable due to their harmful effects on the environment and on energy security.6 Alpha-ketoglutarate (α-KG) is an example of one such chemical; α-KG plays crucial roles in carbon coordination, nitrogen metabolism, and energy metabolism and is used for the chemical functionality of novel N-heterocyclic compounds, which are commonly applied as anticancer agents.7,8

Various chemical synthesis methods are currently being used for the production of α-KG.8,9 The synthesis of α-KG from diethyl succinate and diethyl oxalate is a multistep process, and harsh chemicals such as cyanides are used, resulting in toxic waste. Alternatively, glyoxylic acid is oxidized chemically with sodium glutamate using a copper catalyst; this process also produces glycine as a main product, in addition to other byproducts.10 However, the major drawbacks of chemical synthesis are the lack of selectivity, inclusion of cyanides or copper catalysts, low yield, and production of toxic chemicals that generate environmental hazards. Alternative methods for α-KG production include microbial fermentation and enzymatic transformation.11 For several decades, studies have examined the fermentation process using different microbes, including Corynebacterium glutamicum, Bacillus spp., Arthrobacter paraffineus, Candida spp., Pichia spp., Pseudomonas fluorescens, Serratia marcescens, and Yarrowia lipolytica,9,12,13 for the production of α-KG. Efforts to discover more ideal substitute carbon sources are still underway with the goal of making the process more economically viable. On the other hand, L-glutamic acid has been used for α-KG production by enzymatic biotransformation with recombinant L-glutamate oxidase.14 However, owing to the production of large amounts of hydrogen peroxide due to oxidation, it is necessary to add catalase to the reaction, along with oxidase. Although these fermentation and enzymatic processes generate less environmental pollution than chemical synthesis processes, they are still limited to laboratory level research because of the formation of large amounts of byproducts and the high manufacturing costs.

In a previous study, protein engineering of L-AAD as well as metabolic engineering of α-KG utilization pathway in Bacillus subtilis was performed for the production of α-KG from L-glutamic acid by whole cell biocatalysis (Scheme 1). The highest α-KG titer reached 12.79 g L−1 by that engineered strain.15 However, this whole cell biocatalysis process exhibited several drawbacks, including low substrate solubility of L-glutamic acid and relatively low α-KG production titers. In the current study, highly soluble monosodium glutamate (MSG) was used as a substrate and further protein engineering of P. mirabilis L-AAD was conducted to improve the overall performance of the biocatalytic process. Eight rounds of ep-PCR followed by four rounds of gene shuffling were performed to improve the biocatalytic efficiency of L-AAD. Furthermore, substrate feeding was optimized to further increase α-KG titers. The new optimized whole-cell biotransformation process by the evolved L-AAD produced α-KG at a titer of 89.11 g L−1, which was 6.97 times higher than previously reported.


image file: c6ra02940j-s1.tif
Scheme 1

Experimental

Microorganisms, vectors, chemicals and cultivation conditions

The microorganisms and vectors used in this research are shown in Table 1. Competent Cell Preparation Kit and enzymes were supplied by TaKaRa (Dalian, China). With the exception of MSG and α-KG (Sigma-Aldrich, Shanghai, China), all chemical reagents were purchased from Shanghai Sangon Biological Engineering Technology and Services Co. Ltd. (Shanghai, China). All microorganisms were grown at 37 °C in Luria–Bertani broth (LB; 10 g L−1 tryptone, 5 g L−1 yeast extract, 10 g L−1 NaCl) or on LB agar plates.
Table 1 Microorganisms, vectors and primers used in this study
Name Characteristics References
Strains
Escherichia coli JM109 recA1, endA1, gyrA96, thi, hsdR17, supE44, relA1, Δ(lac-pro AB)/F′ (traD36, proAB+, lacIq, lacZΔM 15) Takara, Otsu, Japan
Bacillus subtilis BSUC1 B. subtilis 168 derivate, ΔsucA::lox72 15
Proteus mirabilis KCTC 2566   Korea Collection for Type Cultures
[thin space (1/6-em)]
Plasmids
pHT43   MoBiTec, Göttingen, Germany
[thin space (1/6-em)]
Primers
Pm1_F1 5′-CGCGGATCCATGGCAATAAGTAGAAGAAAATTTA-3′ BamHI
Pm1_R1 5′-TCCCCCGGGTTAGAAACGATACAGACTAAATGGT-3′ SmaI
pvLAAD_F 5′-CGCGGATCCATGGCAATAAGTAGAAGAAAATTTA-3′ BamHI
pvLAAD_R 5′-TCCCCCGGGTTAGAAACGATACAGACTAAATGGT-3′ SmaI


Mutant library construction by ep-PCR

GeneMorph II Random Mutagenesis Kit (Agilent Technologies, Santa Clara, CA, USA) was used to perform ep-PCR. Each amplification reaction (50 μL) contained 0.5 μM each primer (pm1_F1 and pm1_R1; Table 1), 200 μM deoxyribonucleotide triphosphates, and 2.5 U of Mutazyme II DNA polymerase in Mutazyme II reaction buffer. Mutagenic amplifications were conducted by two separate processes. In the first process, the quantities of template amplicon were varied (0.001 ng, 0.1 ng, 1 ng, 10 ng, or 100 ng) and in the second one, the number of amplification cycles was not the same (one, three, five, seven, ten, fifteen, or twenty cycles). After the process optimization, it was observed that 1 ng of template and fifteen cycles of amplification were suitable condition for the production of two or three amino acids containing mutants. After the application under optimal conditions, PCR products were digested with BamHI and SmaI, purified, and ligated into the expression vector pHT43 (MBio, Carlsbad, Germany) which was digested by the same enzymes. To generate the mutant library, the ligation products were used to transform competent E. coli JM109 cells by electroporation. The resulting colonies were washed down with sterile water, and plasmid DNA was extracted from the pooled E. coli library and subsequently transformed into the engineered B. subtilis (BSUC1) by electroporation.

Mutant library construction by DNA shuffling

DNA family shuffling experiment was performed by the following steps: parental templates preparation, DNase I digestion, primer-less PCR and PCR with primers. At first, two DNA fragments containing the LAAD genes from P. vulgaris mirabilis (accession number: EU669819.1) and P. (accession number: AB030003) were amplified by PCR from plasmids pET-pm1338 and pET-pvLAAD using the primers pm1_F/pm1_R and pvLAAD_F/pvLAAD_R, respectively (Table 1). The PCR amplified fragments were purified and identical quantities (a total of about 4 μg) of the two gene preparations were mixed and equilibrated for 5 min at 15 °C. DNA digestion (by the addition of 0.5 U of DNase) was completed in the presence of 2 mM Mn2+ for 2 min at 15 °C and terminated the digestion reaction by incubating at 90 °C for 10 min. The digested DNA was electrophoresed in a 2% agarose gel to isolate the desired DNA fragments between 100 and 200 bp and subsequently purified. After that, PCR without primers was performed in mixture containing 2.5 U Taq Plus DNA Polymerase, 2 μg of the fragments mixture, 1× Taq Plus buffer, 0.2 mmol L−1 dNTP with a total volume of 50 μL. The reaction conditions was as follows: 95 °C for 1 min, 35 cycles of 95 °C for 30 s, 50 °C for 30 s and 72 °C for 30 s, and a final incubation at 72 °C for 8 min. Then, 1 μL of this PCR reaction was used as a template to amplify the full-length genes using different set of primers (pm1_F/pm1_R or pvLAAD_F/pv_LAADR or pm1_F/pv_LAADR or pm1_F/pv_LAADR). Finally, the mutated PCR products of the full-length gene were digested by BamHI and SmaI and the digested product was ligated into the vector pHT43 which was digested by the same enzymes. The ligation products were used to transform competent E. coli JM109 cells. All the resulting colonies were washed down with sterile water, and then plasmid DNA was extracted from the pooled E. coli library and subsequently transformed into the engineered B. subtilis (BSUC1) by electroporation. Approximately, 3.5 × 10³ clones were screened in each round of shuffling experiment.

Site-directed mutagenesis

The MutanBEST Kit was used for the site-directed mutagenesis and single step PCR method was done using PrimeSTAR HS DNA polymerase with the plasmid pm1338g4/pHT43 as the template DNA. The amino acids at position 278, 317, 320, 415 and 417 of pm1338g4 were replaced by the following amino acids: threonine (ACC), alanine (GCG), tyrosine (TAC), histidine (CAC), phenylalanine (TTC), leucine (CGT), isoleucine (ATC), methionine (ATG), valine (GTT), serine (TCT), proline (CCG), cysteine (TGC), tryptophan (TGG), arginine (CGT), glycine (GGT), lysine (AAA), asparagine (AAC), aspartic acid (AAC), glutamic acid (GAA), and glutamine (CAG).

Biocatalyst preparation and assay of whole-cell biocatalytic activity

For seed preparation, recombinant B. subtilis cells were grown at 37 °C on a shaker (200 rpm) in LB medium containing chloramphenicol (10 mg L−1) for 12 h. Fermentation was executed in a 3 L vessel (BioFlo115; New Brunswick Scientific Co., Edison, NJ, USA) with a working volume of 1.8 L. A seed culture was inoculated at a concentration of 1% (v/v) into Terrific broth for cultivation. When the optical density at 600 nm (OD600) reached 0.6, 0.4 mM isopropyl β-D-1-thiogalactopyranoside was added to initiate L-AAD production. The agitation speed, aeration rate, and temperature were controlled at 400 rpm, 1.0 vvm, and 28 °C, respectively, to avoid the formation of inactive inclusion bodies. After induction for 5 h, the cells were harvested via centrifugation at 8000 × g for 10 min at 4 °C and then washed twice with 20 mM Tris–HCl buffer (pH 8.0). The cell pellet was resuspended in 20 mM Tris–HCl buffer (pH 8.0) and maintained at 4 °C for further studies. Biomass concentrations were analyzed spectrophotometrically (UV-2450 PC; Shimadzu Co.; Kyoto, Japan) at OD620 and converted to dry cell weight (DCW) using the eqn (1):47
 
DCW = {(0.4442 × OD600) − 0.021} (g L−1) (1)

Whole-cell biocatalytic activity was assayed by measuring the α-KG titer in the reaction solution. To measure the initial production rate, the reaction solution (100 g L−1 MSG; 20.0 g [DCW] L−1 whole-cell biocatalyst in 20 mM Tris, pH 8.0; 10 μM carbonyl cyanide-3-chlorophenylhydrazone; and 5 mM MgCl2) was performed at 40 °C on a shaker for 4 h. To investigate the time profile study for α-KG production, biotransformation was performed in the 3 L fermenter (BioFlo115; New Brunswick Scientific Co.) with 1.2 L reaction solution for 36 h. The agitation speed, aeration rate, pH, and temperature were maintained at 400 rpm, 1.5 vvm, 8.0, and 40 °C, respectively. Samples were collected at different time and then centrifuged at 8000 × g for 10 min to stop the reaction, and the α-KG concentration in the supernatant was then measured with high-performance liquid chromatography (HPLC). The biotransformation ratio was determined using the eqn (2):

 
image file: c6ra02940j-t1.tif(2)
where M1 is mol MSG before transformation and M2 is remaining mol MSG after the conversion.

Biochemical characterization at different temperature and pH

Biochemical characterization of all variables was performed with 20 mL of reaction mixture in a 250 mL Erlenmeyer flask. Reactions were performed using the standard whole-cell biocatalytic reaction conditions described above. To characterize the temperature, the reaction was performed at pH 8.0 and 200 rpm with temperatures varying between 25 and 45 °C. For pH characterization, the conditions were 40 °C, 200 rpm, and Na2HPO4–KH2PO4 buffer pH 5–9. The reactions were stopped by centrifugation at 8000 × g for 10 min, and the supernatant was recovered subsequently for measurement of α-KG by HPLC.

Determination of kinetic parameters of the evolved mutants

The evolved mutants were grown with induction, cells were centrifuged at 8000 × g for 10 min and pellets were suspended in purification buffers containing n-dodecyl-β-D-maltoside (0.01%). After disruption with ultrasonication for 20 min on ice (sonication for 1 s and intermission for 2 s) by Vivra-Cell (Sonics, Newtown, CT, USA), the solution was filtered through a 0.45 μM pore size membrane. Then, the filtrate was purified on a HisTrap™ FF 5 mL column with AKTA Explorer (GE Healthcare, Piscataway, NJ, USA) and desalted with an Ultra-4 Centrifugal Filter Device (Amicon, Shanghai, China). Protein concentration was measured with a BCA protein assay kit (TianGen, Beijing, China).

The kinetic analysis of α-KG production by the evolved mutants were performed by measuring α-KG titers with different concentrations of MSG (10, 20, 40, 80, 120, 160, 200, and 240 mM) as substrate at 40 °C for 30 min. The kinetic parameters Km and Vmax were determined using the Lineweaver–Burk plots with the plotting method shown in eqn (3):

 
1/V = (Km/Vmax × 1/[S] + 1/Vmax) (3)
where V is the reaction rate (the amount of α-KG produced by 1 mg of evolved mutant per min; μmol α-KG per min per mg protein), Km is the Michaelis constant (mM), Vmax is the maximum reaction rate (μmol α-KG min per mg protein), and [S] is the concentration of MSG (mM).

Batch and fed-batch biotransformation

Batch and fed-batch biotransformation were conducted in the 3 L vessel (BioFlo115; New Brunswick Scientific Co.) with a working volume of 1.3 L. For batch culture, the reaction was started with 100 g L−1 of MSG, whereas for fed batch culture, the reaction was started with 50 g L−1 of MSG. During the interval feeding, substrate was added at every 6 h interval intervals (25 g or 40 g per every time; for three times). During the continuous feeding, substrate was added at a rate of 8.1 mL L−1 h−1 (from 4.37 M stock solution of MSG, from 4 h to 23 h) during the fed-batch process.

Computational modeling of the tertiary structure of pm133 and pm1338g4

The sequences of pm133 and pm1338g4 were submitted to the I-TASSER web server (http://zhanglab.ccmb.med.umich.edu/I-TASSER/)16 to generate a homology model using pmaLAAD (5FJM) as a template.48 The complete results, together with coordinates of the models and Z score impact are available in the database (http://zhanglab.ccmb.med.umich.edu/ITASSER/output) using the IDs S270391 and S269887 for pm133 and pm1338g4, respectively. Computationally-derived structures were viewed as well as showed using PyMOL.49 Enzyme-substrate docking with the help of Patch dock server.50

Statistical analysis

All experiments were performed at least three times, and the results are expressed as mean ± standard deviation (n = 3). Data were analyzed using the Student's t test. P values less than 0.05 were considered statistically significant.

Results

Ep-PCR-based directed evolution and influence of mutations on the reaction kinetics of pm133

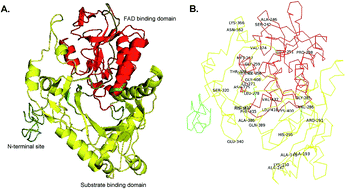
In the earlier study, we devised a protocol to screen expected mutants effectively and showed that engineered pm133 is functionally expressed in E. coli and B. subtilis at a reproducible and constant expression level, with the titer of α-KG reaching 12.79 g L−1.15 Based on this heterologous expression method, a library of pm133 mutants with a regular mutation rate of two or three amino acid changes per protein was produced using ep-PCR. This library of mutants was localized to the membrane of the heterologous host and screened for mutants with better biotransformation efficacy in a 96 well plate format. Only mutants with MSG-to-α-KG biotransformation efficacy higher than that of the pm133 enzyme were selected for further confirmation.15 After screening the eight rounds of approximately 8 × 10⁴ ep-PCR clones, we identified an evolved mutant (pm1338) with considerably improved titer after the biotransformation of MSG; the titer was increased to 37.23 g L−1 (Fig. 2). pm1338 resulted in mutation of residues 147, 150, 193, 246, 259, 271, 278, 291, 295, 317, 320, 340, 362, 374, 383, 408, 415, 437, and 445 (Fig. 1B) (Table 2). ESI Fig. S1 shows the similar amount of expression of parent pm133 and evolved mutants pm1338 and pm1338g4. Among the mutants, acidic residues of D147, D362, D374, and E383 were changed to neutral and basic or aliphatic amino acids. In the L-AAD mutant pm1338, Vmax was increased from 56.7 μM min−1 to 167.2 μM min−1, and the substrate affinity, Km (8.83 mM), was also increased simultaneously (Table 3). In many examples of directed evolution, mutations have improved desired enzyme properties in which amino acid residues located close either to the active center, substrate-binding pockets, or both are often targeted in rational enzyme design because these alterations are more likely to affect the active site architecture, thereby affecting the catalytic reaction.46 We applied a structural modeling method using the I-TASSER program to predict three-dimensional structure as described in the Materials and methods (Fig. 1A). The model that exhibited the highest C score and TM score was used for further study, and the root-mean-square difference value of this model was 2.68 Å. In the mutant pm1338, mutations were identified in the N-terminal, central, and C-terminal regions of the enzyme (Fig. 1B).
image file: c6ra02940j-f1.tif
Fig. 1 (A) Schematic view of the domain spatial arrangement in pm1338g4 (the substrate binding domain in yellow and the FAD binding domain is in red; α-helices, β-strands, and coils are represented by helical ribbons, arrows, and ropes, respectively). (B) Mutant amino acids are shown in ribbon structure of pm1338g4.
Table 2 List of pm133 mutants generated by error-prone polymerase chain reaction (ep-PCR) and gene-shuffling mutationa
Round of ep-PCR Mutations present
a Mutations in bold indicate new mutations identified in each round of directed evolution.
First ep-PCR (pm1331) G259W/D362N
Second ep-PCR (pm1332) W259G/D362N/N150K/Q278L/G437V
Third ep-PCR (pm1333) W259G/D362N/N150K/Q278L/G437V/G193A/P320S
Fourth ep-PCR (pm1334) W259G/D362N/N150K/Q278L/G437V/G193A/P320S/P246A/D374V
Fifth ep-PCR (pm1335) W259G/D362N/N150K/Q278L/G437V/G193A/P320S/P246A/D374V/D340E/V271I/V445A
Sixth ep-PCR (pm1336) W259G/D362N/N150K/Q278L/G437V/G193A/P320S/P246A/D374V/D340E/V271I/V445A/A295H/P415F/E383H
Seventh ep-PCR (pm1337) W259G/D362N/N150K/Q278L/G437V/G193A/P320S/P246A/D374V/D340E/V271I/V445A/A295H/P415F/E383H/D147A/I317F
Eighth ep-PCR (pm1338) W259G/D362N/N150K/Q278L/G437V/G193A/P320S/P246A/D374V/D340E/V271I/V445A/A295H/P415F/E383H/D147A/I317F/G291R/S408G
1st round gene shuffling (pm1338g1) W259G/D362N/N150K/Q278L/G437V/G193A/P320S/P246A/D374V/D340E/V271I/V445A/A295H/P415F/E383H/D147A/I317F/G291R/S408G/E366K/N418L/V269I
2nd round gene shuffling (pm1338g2) W259G/D362N/N150K/Q278L/G437V/G193A/P320S/P246A/D374V/D340E/V271I/V445A/A295H/P415F/E383H/D147A/I317F/G291R/S408G/E366K/N418L/V269I/E400K/P275N/V258I/L378T
3rd round gene shuffling (pm1338g3) W259G/D362N/N150K/Q278L/G437V/G193A/P320S/P246A/D374V/D340E/V271I/V445A/A295H/P415F/E383H/D147A/I317F/G291R/S408G/E366K/N418L/V269I/E400K/P275N/V258I/L378T/L267M/E389Q/A285G/A286V/R251Q
4th round gene shuffling (pm1338g4) W259G/D362N/N150K/Q278L/G437V/G193A/P320S/P246A/D374V/D340E/V271I/V445A/A295H/P415F/E383H/D147A/I317F/G291R/S408G/E366K/N418L/V269I/E400K/P275N/V258I/L378T/L267M/E389Q/A285G/A286V/R251Q/V141A/F208P/T242S


Table 3 Apparent kinetic parameters of α-KG production using whole-cell biocatalysts containing pm133 and its mutantsa
Strains/mutants Vmax (μM min−1) Km (mM) Vmax/Km (per min)
a Each value was calculated from three independent experiments. The cell concentration of the reaction system was 20.0 g L−1 (dry cell weight). The total volume of each reaction mixture was 20 mL (50 mM Tris–Cl buffer, pH 8.0), and the L-amino acid deaminase concentration in each reaction solution was equal (15.6 μmol min−1 mg−1); Vmax, maximum rate of α-KG production; Km, Michaelis constant.
Pm133 56.7 ± 1.11 23.58 ± 0.97 0.0024
Pm1331 79.2 ± 0.92 21.32 ± 1.78 0.0037
Pm1332 92.6 ± 1.34 18.11 ± 0.69 0.0051
Pm1333 105.3 ± 1.65 16.72 ± 0.82 0.0063
Pm1334 142.7 ± 1.52 13.26 ± 0.46 0.0107
Pm1335 168.8 ± 1.09 11.69 ± 0.23 0.0144
Pm1336 159.1 ± 1.31 10.53 ± 0.32 0.0151
Pm1337 155.9 ± 1.11 10.17 ± 0.13 0.0153
Pm1338 167.2 ± 0.81 8.83 ± 0.17 0.0189
Pm1338g1 184.6 ± 0.43 8.12 ± 0.09 0.0226
Pm1338g2 207.1 ± 0.57 7.54 ± 0.12 0.0274
Pm1338g3 223.8 ± 0.32 6.91 ± 0.23 0.0322
Pm1338g4 241.8 ± 0.11 6.56 ± 0.23 0.0368


Gene shuffling based directed evolution and influence of mutations on the reaction kinetics of pm1338

The in vitro recombination of homologous progenitor genes presumably allows for the generation of chimeric sequences which are more diverse than the typical ep-PCR without resorting to high polymerase-dependent mutation rates; this method is usually referred to ‘gene shuffling’.17 Gene shuffling was used to further improve the titer of pm1338 with another deaminase from P. vulgaris which showed 65% similarity with the pm1.18 Four rounds of shuffling resulted in the mutant pm1338g4, harboring mutation of residues 141, 208, 242, 251, 258, 267, 269, 275, 285, 286, 366, 378, 389, 400, and 418 (Table 2). Importantly, this mutant exhibited improved biotransformation efficiency compared with that of the pm1338 mutant, although the ESI Fig. S1 shows the similar amount of expression of pm1338 and pmi1338g4. Molecular modeling showed that these residues were also located on the surface, at the center and less structured loop regions of the enzyme, which are traditionally considered highly flexible (Fig. 1B). The α-KG titer by the evolved pm1338g4 with these mutations reached 54.55 g L−1 within 30 h (Fig. 2). The mutant pm1338g4 also exhibited a higher biotransformation efficiency compared with that of pm1338 (Fig. 2). In addition, kinetic analysis showed that the substrate specificity, Km (6.56 mM), and reaction rate, Vmax (241.8 μM min−1), increased in the pm1338g4 mutant relative to those of pm1338 (Table 3).
image file: c6ra02940j-f2.tif
Fig. 2 Time profile for the production of α-KG from MSG by the whole cell biocatalyst containing the pm133, ep-PCR evolved pm1338 and then gene shuffling evolved pm1338g4 in the batch culture starting with 100 g of MSG (round sign for pm133, square sign for pm1338 and triangle sign for pm1338g4). Data were analyzed using the Student's t test. P values less than 0.05 were considered statistically significant.

Influence of reaction pH and temperature on α-KG production by the evolved enzymes

The crude enzymes produced by the pm133, pm1338 and pm1338g4 were purified and no difference was found in the molecular masses (about 51 kDa) between the different mutant variants on sodium dodecyl sulfate-polyacrylamide gel electrophoresis gels, consistent with the results of a previous report.19 The effects of reaction pH and temperature on α-KG production rate by the pm133, pm1338 and pm1338g4 from MSG are shown in ESI Fig. S2A. The pH range from 5.0 to 9.0 was analyzed for the mutants, since they showed a significant decrease in activity below pH 5.0 and above 9.0. Moreover, the mutants had the same optimal activity at pH 8.0 (ESI Fig. S2A), similar to that of wild-type pm1.19 All the mutants exhibited the maximum production rate at 40 °C (ESI Fig. S2B); among them, pm1338g4 showed the highest production rate of 3.56 g L−1 h−1. The optimal biochemical character between the wild type and mutant proteins were similar, although the production rate was higher in the mutants. These results confirmed the beneficial results of the mutagenesis during the directed evolution.

Influence of fed-batch biotransformation process for α-KG production

In the batch experiment aiming at maximal α-KG productivity, considerable accumulation of incompletely oxidized MSG was observed. Many experiments have shown that the fed-batch substrate addition could be more efficient for the biotransformation where high substrate concentration have negative effects on the process. Therefore, a fed-batch setup was applied for efficient biotransformation of MSG to α-KG. Controlled feeding of MSG prevents the accumulation of substrate and blocks its inhibitory effect. Two strategies for α-KG production, pulse feeding and continuously constant rate feeding, were applied for achieving maximum specific productivity and maximal α-KG titers. In order to achieve a maximum specific α-KG production rate, MSG was fed at appropriate amount to maintain maximum specific productivity and at more than the optimal amount. After an initial phase and extend the cultivation time, the MSG feeding rate was adjusted in order to maintain slightly saturating levels of MSG. In the pulse feeding approach, the reaction process was initially started by adding 50 g L−1 of MSG; MSG feed was then performed at a rate of 25 g L−1 every 6 h for a total of three times, resulting in increased production of α-KG to approximately 64.63 g L−1 (Fig. 3). Similarly, feeding of 40 g L−1 MSG after every 6 h for a total of three times yielded accumulation of α-KG to 83.33 g L−1 (Fig. 3). Then, we devised an alternative feeding strategy (continuously constant rate feeding) to achieve higher final α-KG titers. Continuously MSG feeding at a feeding rate of 6 g L−1 h−1 for 20 hours (from 4 h to 23 h) resulted in better biotransformation efficiency, and α-KG titer reached 89.11 g L−1 (Fig. 3). Thus, the maintenance requirements were met, and extensive substrate accumulation during the biotransformation was avoided.
image file: c6ra02940j-f3.tif
Fig. 3 Time profile of fed-batch biotransformation for the production of α-KG by the whole cell biocatalyst with the evolved pm1338g4. Feeding every 6 hour with 25 g L−1 of MSG (round sign), feeding every 6 hour with 40 g L−1 of MSG (square sign) and continuous feeding with 6 g L−1 h−1 of MSG (triangle sign). Data were analyzed using the Student's t test. P values less than 0.05 were considered statistically significant.

Structure modeling analysis of evolved variant pm1338g4

Since, pm1338g4 is a FAD-containing enzyme and produces α-keto acid and ammonia (Scheme 1) without forming hydrogen peroxide, thus this enzyme is different from known oxidases. In addition, this enzyme shows a broad substrate specificity,51 therefore, the substrate-binding pocket is usually lined by hydrophobic residues. The entrance site of this type enzyme for substrate is unusually wide (15–20 Å) and mostly occupied with negatively charged amino acids (Glu108, Glu145, Glu149, Asp156, Glu340, Asp416, & Glu417)49 (Fig. 4A). In addition, the substrate-binding pocket of this type of enzyme is also about 20 Å deep, and mostly hydrophobic.49 In case of pm1338g4, the substrate-binding pocket is lined by Leu279, Phe318, Met412, Val438 & Trp439 (Fig. 4B). Some amino acids which are close to these sites were changed by the ep-PCR and gene shuffling. Among them, amino acids at position 278, 317, 415 and 418 were subjected to side-directed mutagenesis. ESI Fig. 3 shows that amino acids changed by the evolution were the best among the other amino acids. In addition, ep-PCR and gene shuffling also have changed the distances between the substrate and actives sites comparatively in a positive manner (Fig. 4C and D) and as a results, substrate binding affinity was improved in the evolved pm1338g4 (Table 3).
image file: c6ra02940j-f4.tif
Fig. 4 Substrate entrance sites in pm1338g4 and distances of substrate from active sites. (A) Substrate entrance sites, blue spheres shows the negative charged amino acids, orange spheres shows the mutant amino acids and surface structure represents the substrate, glutamate; (B) substrate entrance sites, blue sticks shows the hydrophobic amino acids, orange sticks shows the mutant amino acids and surface structure represents the substrate, glutamate; (C & D) the distances, in Å, of glutamate (surface structure) from its active sites (blue, gray and red elements) position in pm133 and in pm1338g4, respectively.

For the investigation of the location and accessibility of the mutations identified and to elucidate the topological distribution of these mutated residues in variant pm1338g4, the relative solvent accessibility scores were predicted by the tool that represent solvent accessibility in proteins.20 The results from the ASAView showed that three mutated residues, A285G, L378T and E389Q, were located on the surface and had a higher calculated solvent accessibility value (Fig. 5A). Comparison of pm133 with pm1338g4 revealed some different kinetic properties toward glutamate, i.e., mutations both close to and far away from the active site can effectively improve catalytic activity (Table 3). Therefore, our results established the substrate specificity and reaction velocity of the deaminase enzyme could be modulated by the mutations of residues for better solvent accessibility.21,22


image file: c6ra02940j-f5.tif
Fig. 5 Solvent accessibility and solvent-exposed surface of pm1338g4. (A) The spiral view, which shows amino acid residues of pm1338g4, in the order of their solvent accessibility. Most accessible residues come on the outermost ring of this spiral. Blue, red, green, gray colors are used for positively charged, negatively charged, polar and non-polar residues respectively. Yellow color is used for cysteine residues. Radius of the solid circles representing these residues corresponds to the relative solvent accessibility; (B) the mutants, shown in orange color spheres, that are present in the loop helixes, shown in red color, in the model of pm1338g4 which was docked with the substrate glutamate.

To identify the possible molecular basis for the enhancement of deaminase activity against glutamate, we constructed a model of the pm1338g4–glutamate complex based on the homology model and PSIPRED server was used to predict the secondary structure.45 The result showed that six valuable mutations introduced into the protein (i.e., D147A, N150K, F208P, E383H, E389Q, and V445A) were located on the loop helixes (Fig. 5B), which may be close to the active site and could therefore established a progressive interaction with the substrate. Replacing an acidic residues with a neutral, aliphatic and basic residue in the coil (e.g., D362N, D374V, and E400K), contributed to the improved catalytic activity of pm1338g4, mainly because the loop helixes could possess a high mobility and cause corresponding slight conformation changes near the active site.23 However, the mutations close to the active site may be responsible for improving the catalytic efficiency of pm1338g4 on glutamate mainly by decreasing the Km value (Table 3). In the gene shuffling mutagenesis, the replacement of 15 amino acids resulted in a corresponding increase in the Vmax and decrease in the Km (Table 3), thus, we can assume that the new substitution of pm1338 could optimize the conformation at the active site entrance, thus improving catalysis of pm1338g4 on glutamate (Table 3). These mutations may enhance the affinity for glutamate by contributing to the stabilization of glutamate binding and could also increase the cofactor's redox potential owing to the introduction of polar residues among the mutations.24 Additionally, mutations of pm1338g4 that were far away from the active site may cause conformational changes and could contribute to the promotion of catalytic activity on glutamate by forming a lid to cover the substrate-binding site.25,26

Discussion

The results from the present study demonstrate that the directed evolution by integration of ep-PCR and DNA shuffling can improve the production of α-KG. To the best of our knowledge, this is the first report on improving the production of α-KG by directed evolution based on ep-PCR and DNA shuffling. Ultimately, we obtained a maximum α-KG yield of 89.11 g L−1 in a 3 L fermenter by combining optimization of biochemical characteristics and optimum substrate feeding. Thus, the α-KG yield from the newly obtained deaminase (pm1338g4) by directed evolution was 6.97-fold higher than that from the previously engineered deaminase (pm133).15 For the improvement of the catalytic performance of enzymes, directed evolution is one of the utmost powerful tools currently available.27,28 Indeed, this method has been effectively applied to explore structure–function relations and advance enzyme properties; therefore, it has been effectively applied.29–31 Nevertheless, in most cases, replacements are presented at a rate of one to two amino acid substitutions per round of directed evolution.32 Upper mutagenic rates are not usually used since they frequently abolish enzyme function and are associated with an increased tendency to negate positive mutations. Additionally, a larger library size is produced by greater mutagenic rates, which eventually necessitates an impracticable robust screening and selection method to recognize positive variants. Although, 34 amino acids were found to be mutated in the pm1338g4 the mechanism through which these mutations affect the production of α-KG remains to be elucidated. However, mutations distant from the active site of other enzymes can increase the catalytic properties of enzymes.33–37 For example, Ryu et al. (2006) used ep-PCR to generate a Photobacterium lipolyticum lipase mutant exhibited 75% increased activity at 25 °C.38 In another example, aspartate aminotransferase from E. coli was transformed into a valine aminotransferase by ep-PCR after 17 amino acid substitutions and evolved enzyme exhibited an important increase in the catalytic efficiency for a non-native substrate, valine.33 Usually, saturation mutagenesis is performed to produce a library by designing degenerate primers for the residue position in screening the resultant library to conclude which of the twenty amino acids shows the maximum enhanced effect at that position. In our case, however, saturation mutagenesis in the four sites showed that evolved mutants displayed the maximum enhanced effect (ESI Fig. S3).

In the improved mutant pm1338g4, the reaction velocity was increased significantly (Table 3). This result could be explained by two ways. First, there could be more open binding sites on mutant protein, which could result in increased substrate binding. Second, the binding may be modulatory and allosteric in nature, although in pm133 proteins amino acids in active site region may differ from those of the natural protein, which do not provide perfect binding (Fig. 1). Similar results were obtained in other directed evolution experiment using ep-PCR or DNA shuffling. For example, gene shuffling of a family of human interferon-alpha (Hu-IFN-alpha) genes was used to derive variants with increased activities, and after a second round of selective gene shuffling, the most active clone exhibited a 285[thin space (1/6-em)]000-fold improvement relative to the wild type Hu-IFN-alpha2a.39 Similarly, using DNA shuffling and saturation mutagenesis, the activity and substrate specificity of cytochrome c peroxidase from Saccharomyces cerevisiae were significantly improved.40,41

To eliminate inhibition due to the higher substrate concentration, we added MSG at systematic intervals and examined the effect of this intervention on α-KG production. MSG addition at intervals ensued in higher α-KG production because of the higher biocatalyst activity than that in the batch bioconversion method (Fig. 3). In addition, feeding MSG at a constant rate appeared to increase the α-KG yield further and reduce the substrate inhibition, allowing α-KG yield to peak (Fig. 3). The α-KG titer reached 89.11 g L−1 when MSG was added continuously, while the glutamate bioconversion ratio reached to 60.6%. Therefore, the continuous supply method may favor higher biocatalytic activity than the interval or pulse supply method. Moreover, the bioconversion rate was also higher than that detected with the batch bioconversion method. Thus, the continuous feeding method is more effective and suitable for the production of α-KG.

During the random mutagenesis, the entire coding sequence of the enzyme is targeted; however, only a few mutated residues form the substrate binding site (Fig. 4D). As a result, most mutated residues are far away from active site.22 A delicate disruption in the spatial configuration of the active site and some minor alterations in the protein side chain and backbone can be caused by these distant mutations, which can affect the protein secondary structure and cause elusive variations in the organization of the protein tertiary structure, resulting in dramatic changes in the catalytic supremacy of enzyme (Fig. 4 and Table 3).42 Hence, based on the structural model, while the mutations adjacent to the active site seemed to be more valuable in alteration of an enzyme's catalytic activity and substrate selectivity, these distant mutations could also play a role in refining or adapting the catalytic properties of the enzyme (Fig. 5B).

During the last decade, directed evolution has become a prominent method for engineering improved proteins, however, there is still great opportunity for producing experimentally modest and more effective strategies and techniques. We used successive rounds of ep-PCR and gene shuffling experiment to generate variants of P. mirabilis pm1338g4 exhibiting increased biotransformation titer. Our newly developed variants exhibited increased production of α-KG titers from whole-cell biocatalysis, reaching 53.74 g L−1, compared with those of wild type P. mirabilis pm1 (4.65 g L−1) and pm133 (12.79 g L−1). The fed-batch strategy was optimized, further increasing the α-KG titer to 89.11 g L−1. Thus, the productivity obtained in this study was much higher than those described in previous reports. In particular, with additional engineering of L-AAD, the production level of α-KG may be more increased by reducing the product inhibition. In addition, in situ product removal technique can be applied for the removal of product inhibiting the biocatalysis process.43,44 Overall, we have shown that combining ep-PCR and gene shuffling is an effective strategy for the molecular engineering of industrial enzymes.

Conflict of interest

The authors declare that they have no conflict of interest.

Ethical approval

This article does not contain any studies with human participants or animals performed by any of the authors.

Acknowledgements

This work is supported by 863 project (2014AA021200), the Priority Academic Program Development of Jiangsu Higher Education Institutions, the 111 Project (No. 111-2-06), and the Open Funding Project of the State Key Laboratory of Bioreactor Engineering.

Notes and references

  1. C. Jäckel, P. Kast and D. Hilvert, Annu. Rev. Biophys., 2008, 37, 153–173 CrossRef PubMed.
  2. S. Fong, T. D. Machajewski, C. C. Mak and C. Wong, Chem. Biol., 2000, 7, 873–883 CrossRef CAS PubMed.
  3. S. Melzer, C. Sonnendecker, C. Föllner and W. Zimmermann, FEBS Open Bio, 2015, 5, 528–534 CrossRef CAS PubMed.
  4. H. E. Schoemaker, D. Mink and M. G. Wubbolts, Science, 2003, 299, 1694–1697 CrossRef CAS PubMed.
  5. A. J. Straathof, S. Panke and A. Schmid, Curr. Opin. Biotechnol., 2002, 13, 548–556 CrossRef CAS PubMed.
  6. N. Buschke, R. Schäfer, J. Becker and C. Wittmann, Bioresour. Technol., 2013, 135, 544–554 CrossRef CAS PubMed.
  7. A. R. Fernie, F. Carrari and L. J. Sweetlove, Curr. Opin. Plant Biol., 2004, 7, 254–261 CrossRef CAS PubMed.
  8. U. Stottmeister, A. Aurich, H. Wilde, J. Andersch, S. Schmidt and D. Sicker, J. Ind. Microbiol. Biotechnol., 2005, 32, 651–664 CrossRef CAS PubMed.
  9. C. Otto, V. Yovkova and G. Barth, Appl. Microbiol. Biotechnol., 2011, 92, 689–695 CrossRef CAS PubMed.
  10. S. Verseck, A. Karau and M. Weber, Patent WO200905348, Evonik Degussa GmbH, 2009.
  11. T. V. Finogenova, I. G. Morgunov and O. G. Chernyavskaya, Appl. Biochem. Microbiol., 2005, 41, 418–425 CrossRef CAS.
  12. D. D. Zhang, N. Liang, Z. P. Shi, L. M. Liu, J. Chen and G. C. Du, Biotechnol. Bioprocess Eng., 2009, 14, 134–139 CrossRef CAS.
  13. J. W. Zhou, H. Y. Zhou, G. C. Du, L. M. Liu and J. Chen, Lett. Appl. Microbiol., 2010, 51, 264–271 CrossRef CAS PubMed.
  14. P. Niu, X. Dong, Y. Wang and L. Liu, J. Biotechnol., 2014, 179, 56–62 CrossRef CAS PubMed.
  15. G. S. Hossain, J. Li, H. D. Shin, L. Liu, M. Wang, G. Du and J. Chen, J. Biotechnol., 2014, 187, 71–77 CrossRef CAS PubMed.
  16. Y. Zhang, BMC Bioinf., 2008, 9, 40 CrossRef PubMed.
  17. A. Crameri, S. A. Raillard, E. Bermudez and W. P. Stemmer, Nature, 1998, 391, 288–291 CrossRef CAS PubMed.
  18. G. S. Hossain, J. Li, H. D. Shin, G. Du, M. Wang, L. Liu and J. Chen, PLoS One, 2014, 9, e114291 Search PubMed.
  19. G. S. Hossain, J. Li, H. D. Shin, L. Liu, M. Wang, G. Du and J. Chen, J. Biotechnol., 2014, 169, 112–120 CrossRef CAS PubMed.
  20. S. Ahmad, M. Gromiha, H. Fawareh and A. Sarai, BMC Bioinf., 2004, 5, 51–56 CrossRef PubMed.
  21. G. P. Horsman, A. M. Liu, E. Henke, U. T. Bornscheuer and R. J. Kazlauskas, Chem.–Eur. J., 2003, 9, 1933–1939 CrossRef CAS PubMed.
  22. S. Park, K. L. Morley, G. P. Horsman, M. Holmquist, K. Hult and R. J. Kazlauskas, Chem. Biol., 2005, 12, 45–54 CrossRef CAS PubMed.
  23. M. Pedotti, E. Rosini, G. Molla, T. Moschetti and C. Savino, J. Biol. Chem., 2009, 284, 36415–36423 CrossRef CAS PubMed.
  24. M. W. Fraaije and A. Mattevi, Trends Biochem. Sci., 2000, 25, 126–132 CrossRef CAS PubMed.
  25. E. C. Settembre, P. C. Dorrestein, J. H. Park, A. M. Augustine and T. P. Begley, Biochemistry, 2003, 42, 2971–2981 CrossRef CAS PubMed.
  26. M. Mörtl, K. Diederichs, W. Welte, G. Molla and L. Motteran, J. Biol. Chem., 2004, 279, 29718–29727 CrossRef PubMed.
  27. K. E. Jaeger, T. Eggert, A. Eipper and M. T. Reetz, Appl. Microbiol. Biotechnol., 2001, 55, 519–530 CrossRef CAS PubMed.
  28. T. W. Wang, H. Zhu, X. Y. Ma, T. Zhang, Y. S. Ma and D. Z. Wei, Mol. Biotechnol., 2006, 34, 55–68 CrossRef CAS PubMed.
  29. S. Bershtein and D. S. Tawfik, Curr. Opin. Chem. Biol., 2008, 12, 151–158 CrossRef CAS PubMed.
  30. A. V. Shivange, J. Marienhagen, H. Mundhada, A. Schenk and U. Schwaneberg, Curr. Opin. Chem. Biol., 2009, 13, 19–25 CrossRef CAS PubMed.
  31. A. V. Shivange, A. Serwe, A. Dennig, D. Roccatano, S. Haefner and U. Schwaneberg, Appl. Microbiol. Biotechnol., 2011, 95, 405–418 CrossRef PubMed.
  32. C. A. Tracewell and F. H. Arnold, Curr. Opin. Chem. Biol., 2009, 13, 3–9 CrossRef CAS PubMed.
  33. S. Oue, A. Okamoto, T. Yano and H. Kagamiyama, J. Biol. Chem., 1999, 274, 2344–2349 CrossRef CAS PubMed.
  34. H. F. Xu, X. E. Zhang, Z. Zhang, Y. M. Zhang and A. E. G. Cass, Biocatal. Biotransform., 2003, 21, 41–47 CrossRef CAS.
  35. Y. Fan, W. Fang, Y. Xiao, X. Yang, Y. Zhang, M. J. Bidochka and Y. Pei, Appl. Microbiol. Biotechnol., 2007, 76, 135–139 CrossRef CAS PubMed.
  36. D. E. Stephens, K. Rumbold, K. Permaul, B. A. Prior and S. Singh, J. Biotechnol., 2007, 127, 348–354 CrossRef CAS PubMed.
  37. Z. Y. Zuo, Z. L. Zheng, Z. G. Liu, Q. M. Yi and G. L. Zou, Enzyme Microb. Technol., 2007, 40, 569–577 CrossRef CAS.
  38. H. S. Ryu, H. K. Kim, W. C. Choi, M. H. Kim, S. Y. Park, N. S. Han, T. K. Oh and J. K. Lee, Appl. Microbiol. Biotechnol., 2006, 70, 321–326 CrossRef CAS PubMed.
  39. C. C. Chang, T. T. Chen, B. W. Cox, G. N. Dawes, W. P. Stemmer, J. Punnonen and P. A. Patten, Nat. Biotechnol., 1999, 17, 793–797 CrossRef CAS PubMed.
  40. A. Iffland, P. Tafelmeyer, C. Saudan and K. Johnsson, Biochemistry, 2000, 39, 10790–10798 CrossRef CAS PubMed.
  41. A. Iffland, S. Gendreizig, P. Tafelmeyer and K. Johnsson, Biochem. Biophys. Res. Commun., 2001, 286, 126–132 CrossRef CAS PubMed.
  42. K. L. Morley and R. J. Kazlauskas, Trends Biotechnol., 2005, 23, 231–237 CrossRef CAS PubMed.
  43. D. Stark and U. von Stockar, Adv. Biochem. Eng./Biotechnol., 2003, 80, 149–175 CrossRef CAS PubMed.
  44. B. Zelić, S. Gostovic, K. Vuorilehto, D. Vasić-Racki and R. Takors, Biotechnol. Bioeng., 2004, 85, 638–646 CrossRef PubMed.
  45. L. J. McGuffin, K. Bryson and D. T. Jones, Bioinformatics, 2000, 16, 404–405 CrossRef CAS PubMed.
  46. M. T. Reetz, M. Bocola, J. D. Carballeira, D. Zha and A. Vogel, Angew. Chem., Int. Ed., 2005, 44, 4192–4196 CrossRef CAS PubMed.
  47. G. Bratbak and I. Dundas, Appl. Environ. Microbiol., 1984, 48, 755–777 CAS.
  48. P. Motta, G. Molla, L. Pollegioni and M. Nardini, J. Biol. Chem., 2016, M115.703819 CrossRef PubMed.
  49. L. L. C. Schrodinger, The PyMOL Molecular Graphics System. Version 1.3r1, 2010 Search PubMed.
  50. D. Schneidman-Duhovny, Y. Inbar, R. Nussinov and H. J. Wolfson, Nucleic Acids Res., 2005, 33, W363–W367 CrossRef CAS PubMed.
  51. J. O. Baek, J. W. Seo, O. Kwon, S. I. Seong, I. H. Kim and C. H. Kim, J. Basic Microbiol., 2011, 51, 129–135 CrossRef CAS PubMed.

Footnote

Electronic supplementary information (ESI) available. See DOI: 10.1039/c6ra02940j

This journal is © The Royal Society of Chemistry 2016
Click here to see how this site uses Cookies. View our privacy policy here.