Vanadium-doped lithium-rich layered-structured cathode material Li1.2Ni0.2Mn0.6O2 with a high specific capacity and improved rate performance
Yong Zanga,
Xin Suna,
Zhong-Feng Tanga,
Hong-Fa Xiangb and
Chun-Hua Chen*a
aCAS Key Laboratory of Materials for Energy Conversions, Department of Materials Science and Engineering, Collaborative Innovation Center of Suzhou Nano Science and Technology, University of Science and Technology of China, Hefei 230026, Anhui, China. E-mail: cchchen@ustc.edu.cn
bSchool of Materials Science and Engineering, Hefei University of Technology, Hefei 230009, China
First published on 16th March 2016
Abstract
Fine powders of Li1.2Ni0.2Mn0.6−xVxO2 (x = 0, 0.002, 0.005, 0.01, 0.02) are prepared by a thermopolymerization method. X-ray diffraction, scanning electron microscopy, X-ray photoelectron spectroscopy and electrochemical measurements are carried out to characterize these samples. The V-doped samples show great improvement in rate performance and cycling stability, as well as mitigation of voltage decline during cycling. For the optimal composition Li1.2Ni0.2Mn0.59V0.01O2, it exhibits a discharge capacity of 245 and 118 mA h g−1 at 0.1C and 10C rates, respectively. It retains a capacity of 234 mA h g−1 at 0.1C after 188 cycles with a capacity retention of 95.5%. This study suggests that the partial substitution of Mn4+ with V5+ can improve both the rate capability and cycle stability of this high-capacity cathode material.
Introduction
With the rapid development of hybrid electric vehicles (HEVs) and electric vehicles (EVs), there are increasing demands for lithium-ion batteries with higher energy density. Currently, the cathode material is the main limiting factor to increase the energy density of a lithium-ion cell, so finding new cathode materials with high energy density is an important challenge.1 Among all the cathode materials investigated so far, the lithium-rich transition metal oxides Li[Li1/3−2x/3NixMn2/3−x/3]O2 reported first by Dahn's group present the highest specific charge–discharge capacities (>250 mA h g−1).2 However, such materials suffer from four serious limitations: (1) first cycle irreversible capacity loss caused by the activation of the Li2MnO3 component; (2) voltage decline caused by the structural conversion (layered to spinel) during cycling; (3) capacity fade caused by either structural conversion or interfacial reactions; and (4) inferior rate capability caused by the low ionic/electronic conductivities.3Great efforts have been made to solve above problems, including synthesizing composites with delithiated cathode materials (e.g. V2O5) and surface coating to increase the initial coulombic efficiency of the Li-rich cathodes;4,5 structural design and ionic doping to relieve the voltage decline;6,7 ionic doping, surface coating and system optimization to improve the cycling performance;8–13 surface coating, ionic doping and nano-sizing to improve the rate performance.14,15
Vanadium has been used as a substitution element in many electrode materials to improve their electrochemical performance, such as LiFePO4,16,17 LiMnPO4,18 LiNi0.5Mn1.5O4,19 Li2FeSiO4![[thin space (1/6-em)]](https://www.rsc.org/images/entities/char_2009.gif) 20 and TiNb2O7.21 But the V-doping has not been studied in the Li-rich cathode materials so far. In our previous work,15 the substitution of Mo6+ for Mn4+ has proved to be effective to improve the rate and cycling performance of the Li-rich materials, and Li et al. reported a similar result by substituting Mn4+ with Nb5+ in LiNi0.2Mn0.6O2.22 Therefore, it is reasonable to use V5+ to substitute Mn4+ to improve the electrochemical performance of the Li-rich cathode materials.
20 and TiNb2O7.21 But the V-doping has not been studied in the Li-rich cathode materials so far. In our previous work,15 the substitution of Mo6+ for Mn4+ has proved to be effective to improve the rate and cycling performance of the Li-rich materials, and Li et al. reported a similar result by substituting Mn4+ with Nb5+ in LiNi0.2Mn0.6O2.22 Therefore, it is reasonable to use V5+ to substitute Mn4+ to improve the electrochemical performance of the Li-rich cathode materials.
Experimental
The Li(Li0.2Ni0.2Mn0.6−xVx)O2 (x = 0, 0.002, 0.005, 0.01, 0.02) powders were synthesized by a thermopolymerization method. Stoichiometric amounts of lithium nitrate (LiNO3, 5% excess, AR), manganese acetate (Mn(CH3COO)2·4H2O, AR), nickel nitrate (Ni(NO3)2·6H2O, AR) and ammonium metavanadate (NH4VO3, AR) were dissolved in deionized water to obtain five solutions (0.4 M). An appropriate amount of nitric acid (HNO3, AR) was added to inhibit the hydrolysis of ammonium metavanadate, followed by the addition of acrylic acid (AA) to control volume ration AA![[thin space (1/6-em)]](https://www.rsc.org/images/entities/char_2009.gif) :
:![[thin space (1/6-em)]](https://www.rsc.org/images/entities/char_2009.gif) H2O = 1
H2O = 1![[thin space (1/6-em)]](https://www.rsc.org/images/entities/char_2009.gif) :
:![[thin space (1/6-em)]](https://www.rsc.org/images/entities/char_2009.gif) 2. The solutions were then dried and decomposed in an oven at 180 °C for 10 h to form fluffy xerogels. After grinding for 20 min, the powders were calcined at 500 °C for 6 h to remove the organics and cooled to room temperature. After another grinding for 10 min, the intermediate products were sintered at 950 °C for 10 h and then quenched in air to obtain the final powder products.
2. The solutions were then dried and decomposed in an oven at 180 °C for 10 h to form fluffy xerogels. After grinding for 20 min, the powders were calcined at 500 °C for 6 h to remove the organics and cooled to room temperature. After another grinding for 10 min, the intermediate products were sintered at 950 °C for 10 h and then quenched in air to obtain the final powder products.
The synthesized powders of the Li-rich materials were analyzed by X-ray diffraction (XRD) using a diffractometer (Philips X'pert Pro Super, Cu Kα radiation) in the 2 theta range from 10 to 70 degree with a scanning rate of 10 degree per minute. The particle morphology of the samples was observed under a scanning electron microscope (SEM, JSM-6390LA).
The electrochemical tests of the materials were carried out in CR2032 coin-type cells. The working electrodes were prepared by mixing above Li-rich materials, acetylene black and polyvinylidene fluoride (PVDF) (80![[thin space (1/6-em)]](https://www.rsc.org/images/entities/char_2009.gif) :
:![[thin space (1/6-em)]](https://www.rsc.org/images/entities/char_2009.gif) 10
10![[thin space (1/6-em)]](https://www.rsc.org/images/entities/char_2009.gif) :
:![[thin space (1/6-em)]](https://www.rsc.org/images/entities/char_2009.gif) 10, w/w/w) in N-methyl-2-pyrrolidone (NMP), and then casting the slurries onto an Al foil current collector and drying at 80 °C. The mass of the active material in each electrode is about 2.6 mg cm−2. The lithium metal foil was used as the counter electrode while the electrolyte was a solution of 1 M LiPF6 in a 1
10, w/w/w) in N-methyl-2-pyrrolidone (NMP), and then casting the slurries onto an Al foil current collector and drying at 80 °C. The mass of the active material in each electrode is about 2.6 mg cm−2. The lithium metal foil was used as the counter electrode while the electrolyte was a solution of 1 M LiPF6 in a 1![[thin space (1/6-em)]](https://www.rsc.org/images/entities/char_2009.gif) :
:![[thin space (1/6-em)]](https://www.rsc.org/images/entities/char_2009.gif) 1 (v/v) mixture of EC and DMC. The coin cells were assembled in an argon-filled glove box and tested on a multi-channel battery test system (NEWARE BTS) with galvanostatic charge and discharge in the voltage range of 2.0–4.8 V.
1 (v/v) mixture of EC and DMC. The coin cells were assembled in an argon-filled glove box and tested on a multi-channel battery test system (NEWARE BTS) with galvanostatic charge and discharge in the voltage range of 2.0–4.8 V.
The cyclic voltammograms (CV) and electrochemical impedance spectroscopy (EIS) measurements of the cells were measured on a CHI 660D electrochemical workstation. The CV tests were carried out after the cells were activated by galvanostatically cycling in the voltage range of 2.0–4.8 V for three times. The voltage range for the CV tests was 2.0 to 4.8 V at a scan rate of 0.1 mV s−1. The EIS tests were performed with a 5 mV AC signal in the frequency range of 0.01–10![[thin space (1/6-em)]](https://www.rsc.org/images/entities/char_2009.gif) 000 Hz. To measure the total impedance of the cells, a galvanostatic cycling at 0.1C (voltage range 2.0–4.8 V) was carried out for three times and then followed by a galvanostatic charge at 0.1C to 4.0 V and then a constant-voltage charge at 4.0 V until the current drops to 0.01C.
000 Hz. To measure the total impedance of the cells, a galvanostatic cycling at 0.1C (voltage range 2.0–4.8 V) was carried out for three times and then followed by a galvanostatic charge at 0.1C to 4.0 V and then a constant-voltage charge at 4.0 V until the current drops to 0.01C.
Results and discussion
Crystal structures and particle morphology of Li1.2Ni0.2Mn0.6−xVxO2 powders
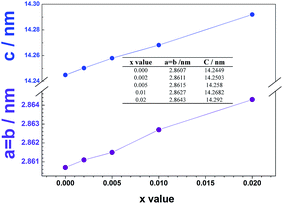
The X-ray diffraction patterns of the synthesized powders are shown in Fig. 1. All diffraction peaks of Li1.2Ni0.2Mn0.6−xVxO2 can be assigned to a rhombohedral lattice with a space group R![[3 with combining macron]](https://www.rsc.org/images/entities/char_0033_0304.gif) m (JCPDS card 16-0427) except for the broad peaks in the range of 20–25 degree, which can be attributed to the superlattice of ordered LiMn6 existing in the monoclinic Li2MnO3 phase with a space group of C2/m.23,24 No apparent impurity phase is detected in the pristine and the V-doped samples with x value below 0.02. When the doping level increases to x = 0.02, an impurity phase identified as Li3VO4 emerges. The generation of this V-containing impurity phase would affect the composition of the main phase, which may result in poor electrochemical performances. Fig. 2 shows the lattice parameters of the powders calculated based on the X-ray diffraction patterns above. It is obvious that the lattice parameters (both a = b and c) gradually increase with the V5+ content. Although the ionic radius of V5+ (0.54 Å) is just slightly larger than that of Mn4+ (0.53 Å), when substituting Mn4+ partially with V5+ in Li1.2Ni0.2Mn0.6O2, Mn4+ are partially reduced to Mn3+ (0.58 Å), which is much larger than Mn4+, leading to the gradually increasing lattice parameters. The increased lattice parameters, especially c, should be beneficial for the diffusion of lithium ions in the lattice so that the rate capability should be improved.
m (JCPDS card 16-0427) except for the broad peaks in the range of 20–25 degree, which can be attributed to the superlattice of ordered LiMn6 existing in the monoclinic Li2MnO3 phase with a space group of C2/m.23,24 No apparent impurity phase is detected in the pristine and the V-doped samples with x value below 0.02. When the doping level increases to x = 0.02, an impurity phase identified as Li3VO4 emerges. The generation of this V-containing impurity phase would affect the composition of the main phase, which may result in poor electrochemical performances. Fig. 2 shows the lattice parameters of the powders calculated based on the X-ray diffraction patterns above. It is obvious that the lattice parameters (both a = b and c) gradually increase with the V5+ content. Although the ionic radius of V5+ (0.54 Å) is just slightly larger than that of Mn4+ (0.53 Å), when substituting Mn4+ partially with V5+ in Li1.2Ni0.2Mn0.6O2, Mn4+ are partially reduced to Mn3+ (0.58 Å), which is much larger than Mn4+, leading to the gradually increasing lattice parameters. The increased lattice parameters, especially c, should be beneficial for the diffusion of lithium ions in the lattice so that the rate capability should be improved.
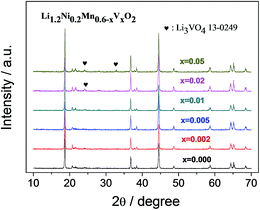 | ||
| Fig. 1 X-ray diffraction patters of Li1.2Ni0.2Mn0.6−xVxO2 (x = 0, 0.002, 0.005, 0.01, 0.02, 0.05) powders. | ||
The SEM images of the pristine and V-doped samples are shown in Fig. 3. It can be seen that all the pristine and V-doped samples show similar particle morphology. All these samples are composed of uniform particles with diameters less than 500 nm.
X-ray photoelectron spectroscopy (XPS) analysis was utilized to identify the oxidation states of the transition metal elements (Ni, Mn and V). For the XPS tests, we activated the cells with a galvanostatic cycling, and disassembling them at fully discharged states at 2.0 V to obtain the working electrodes which were also washed in DMC for 1 h. Comparing the binding energies of the Li1s, Ni2p, and Mn2p in the x = 0 and x = 0.01 samples (Fig. 4a–c), we can conclude that the oxidation states of these three elements have no apparent differences before and after the V-doping, i.e. +1, +4 and +2 for Li, Mn and Ni, respectively. Fig. 4d shows the V2p spectra of x = 0 and x = 0.01 samples. According to literatures,25–27 the peak at binding energy value of 517.2 eV for x = 0.01 sample corresponds to the 2p3/2 peak of V5+, which means that V is present with a high oxidation state of +5 in the doped samples. Therefore, in the V-doped samples, corresponding amount of Mn4+ ions should be reduced to Mn3+, which is in agreement with the XRD results. The existence of Mn4+/Mn3+ pairs can increase the electronic conductivity of these doped samples, resulting in a rate performance better than the pristine sample. Similar phenomenon is found in our Mo-doping work.15
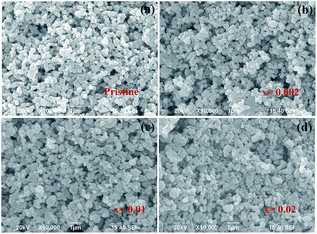 | ||
| Fig. 3 SEM images of V-doped samples Li1.2Ni0.2Mn0.6−xVxO2: (a) x = 0; (b) x = 0.002; (c) x = 0.01; (d) x = 0.02. | ||
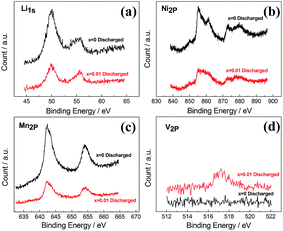 | ||
| Fig. 4 X-ray photoelectron spectroscopy (XPS) results for elements (Li, Ni, Mn, V) in the pristine and V-doped samples. | ||
The electrochemical performance
The initial charge and discharge voltage profiles of the Li1.2Ni0.2Mn0.6−xVxO2 (x = 0, 0.002, 0.01, 0.02) powders at 0.1C are plotted in Fig. 5. All of the samples deliver characteristic profiles of Li-rich cathode materials with the initial charge profiles exhibiting two plateau regions. The sloping region below 4.5 V corresponds to the lithium extraction first from the layered component (LiNi0.5Mn0.5O2), while the plateau region around 4.5 V is related to simultaneous extractions of lithium and oxygen from the rock salt component Li2MnO3 lattice.25 The pristine Li1.2Ni0.2Mn0.6O2 delivers a high discharge capacity of 256 mA h g−1. With increasing the V content, the discharge capacity at 0.1C decreases to 253 (x = 0.002), 245 (x = 0.01) and 216 mA h g−1 (x = 0.02), respectively, which can be ascribed to the gradually increasing amount of active Mn ions substituted partially by inactive V ions. The initial coulombic efficiencies of the pristine and V-doped samples are 81.9%, 80.0%, 79.6% and 74.1% for x = 0, 0.002, 0.01 and 0.02, respectively. It can be seen that the initial coulombic efficiency decreases with increasing the V-content. This phenomenon can be explained by the higher degree of activation of the Li2MnO3 component in the initial charge step of the V-doped samples with higher V-doping level. A similar result is observed in Mo-doped samples in our previous work.15 Furthermore, the polarization represented by the difference between the average charge and discharge potentials shows a slightly decrease with the V-doping. Such a decrease in polarization should be caused by both the increase of electronic conductivity of the material owing to the co-existence of mixed valences Mn4+/Mn3+ and the increased lithium ionic conductivity owing to the increases in the lattice parameters.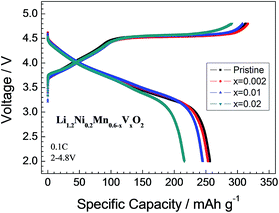 | ||
| Fig. 5 Initial charge–discharge curves for pristine and V-doped samples Li1.2Ni0.2Mn0.6−xVxO2 (x = 0, 0.002, 0.01, 0.02). | ||
Fig. 6 shows the rate performances of the Li1.2Ni0.2Mn0.6−xVxO2 samples. As predicted based on the mixed valence states of Mn4+/Mn3+ and the increased lattice parameters discussed above, the V-doping can remarkably improve the rate capability. Except for the x = 0.02 sample with Li3VO4 impurity, he average discharge capacity increases with increasing the V-doping level. Among all the samples the x = 0.01 sample exhibits the best rate performance with a discharge capacity of 115 mA h g−1 at 10C rate (versus nearly 0 mA h g−1 for the pristine sample).
The cycling performances of the pristine and the x = 0.01 samples are present in Fig. 7. It can be seen that the pristine sample has a higher capacity (about 250 mA h g−1) than the x = 0.01 one in the first 50 cycles (Fig. 7a). However, the capacity of the pristine sample declines more rapidly afterwards, while the x = 0.01 sample maintains a rather stable capacity of about 230 mA h g−1 after 200 cycles. Fig. 7b shows the average discharge potential (Eav) of the pristine and the x = 0.01 samples, which is defined as ratio of energy density (mW h g−1) divided by the specific discharge capacity (mA h g−1). The Eav of the pristine sample is initially 3.56 V and then gradually decreases to 2.79 V after 200 cycles. The x = 0.01 sample shows a little higher Eav of 3.59 V initially. In the first 40 cycles it shows a similar decline rate with the pristine one, but the decline rate gradually slows down after 40 cycles. Especially, the Eav of x = 0.01 sample is nearly unchanged after 140 cycles. Fig. 7c and d demonstrate the charge–discharge profile of the pristine and x = 0.01 samples, respectively. It is clearly shown that the voltage decay of the material has been significantly suppressed. Considering that the energy density of the material is the integration of the specific capacity and the cell voltage, the relief of the voltage decay is meaningful to maintain the high energy density of lithium rich materials. The improved cycling performance of the V-doped material may result from the uniformly distributed V ions that serve as a sort of pinning points to suppress the conversion from layered to spinel structures, but this mechanism is to be studied further.
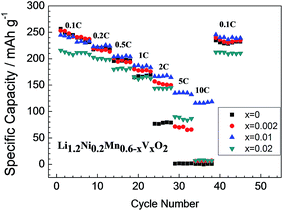 | ||
| Fig. 6 Rate capability of pristine and V-doped samples Li1.2Ni0.2Mn0.6−xVxO2. All the cells are charged at 0.1C and discharged at different C-rate (theoretical specific capacity is 250 mA h g−1). | ||
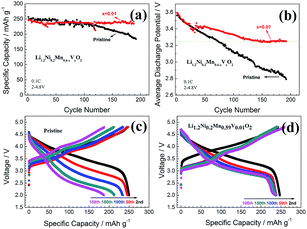 | ||
| Fig. 7 Cycle performance and Eav of the pristine and V-doped sample Li1.2Ni0.2Mn0.6−xVxO2 (x = 0, 0.01). | ||
Fig. 8 shows the EIS results (Fig. 8a) and the CV curves (Fig. 8b). Each of the impedance spectra consists of two semi-circles and a straight line in all the frequency range. The semi-circle at high frequency refers to the charge-transfer resistance of the working electrode, while the semi-circle at middle frequency refers to the charge-transfer resistance of the lithium foil electrode. The straight line at low frequency refers to the Warburg resistance of the working electrode. It can be seen that the charge-transfer resistance of the working electrode decreases considerably after the V-doping. That is why the V-doped material shows better rate performance. The CV curves (Fig. 8b) present the similar results that the polarization of the V-doped sample is less than that of the pristine one.
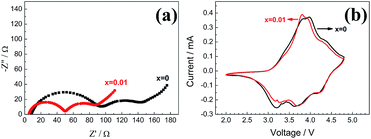 | ||
| Fig. 8 EIS spectra (a) and CV curves (b) of the pristine and V-doped samples Li1.2Ni0.2Mn0.6−xVxO2 (x = 0, 0.01). | ||
Conclusions
V-doped Li-rich cathode materials Li1.2Ni0.2Mn0.6−xVxO2 are successfully synthesized by a thermopolymerization method. The V-doping can improve both the lithium ion conductivity and electronic conductivity because of the increased lattice parameters and the introduction of Mn3+/Mn4+ pairs. As a result, the charge-transfer resistance and the polarization of the electrode are significantly reduced, leading to the improved rate performance. For the optimal composition Li1.2Ni0.2Mn0.59V0.01O2, it exhibits a discharge capacity of 245 and 118 mA h g−1 at 0.1C and 10C rates, respectively. Meanwhile, the cycling performance of the V-doped material is also improved with a capacity of 234 mA h g−1 at 0.1C after 188 cycles.Acknowledgements
This study was supported by National Science Foundation of China (grant no. 51577175), Hefei Center of Materials Science and Technology (grant no. 2014FXZY006) and Education Department of Anhui Province (grant no. KJ2014ZD36). We are also grateful to Elementec Ltd in Suzhou.References
- J.-M. Tarascon, Philos. Trans. R. Soc., A, 2010, 368, 3227–3241 CrossRef PubMed.
- Z. H. Lu, L. Y. Beaulieu, R. A. Donaberger, C. L. Thomsa and J. R. Dahn, J. Electrochem. Soc., 2002, 149, A778–A791 CrossRef CAS.
- L. Li, K. S. Lee and L. Lu, Funct. Mater. Lett., 2014, 7, 1430002 CrossRef.
- J. Gao, J. Kim and A. Manthiram, Electrochem. Commun., 2009, 11, 84–86 CrossRef CAS.
- Y. Wu and A. Manthiram, Solid State Ionics, 2009, 180, 50–56 CrossRef CAS.
- J. R. Croy, D. Kim, M. Balasubramanian, K. Gallagher, S.-H. Kang and M. M. Thackeray, J. Electrochem. Soc., 2012, 159, A781–A790 CrossRef CAS.
- X. K. Yang, D. Wang, R. Z. Yu, Y. S. Bai, H. B. Shu, L. Ge, H. P. Guo, Q. L. Wei, L. Liu and X. Y. Wang, J. Mater. Chem. A, 2014, 2, 3899 CAS.
- D. Wang, Y. Huang, Z. Q. Huo and L. Chen, Electrochim. Acta, 2013, 107, 451–466 Search PubMed.
- A. Ito, D. C. Li, Y. Ohsawa and Y. Sato, J. Power Sources, 2008, 183, 344–346 CrossRef CAS.
- S. J. Shi, J. P. Tu, Y. J. Zhang, Y. D. Zhang, X. Y. Zhao, X. L. Wang and C. D. Gu, Electrochim. Acta, 2013, 108, 441–448 CrossRef CAS.
- Y. J. Liu, Q. L. Wang, Y. F. Lu, B. L. Yang, M. R. Su, Y. Y. Gao, A. C. Dou and J. Pan, J. Alloys Compd., 2015, 638, 1–6 CrossRef CAS.
- Y. J. Liu, Y. Y. Gao, Q. L. Wang and A. C. Dou, Ionics, 2014, 20, 739–745 CrossRef CAS.
- Y. J. Liu, S. B. Liu, Y. P. Wang, L. Chen and X. H. Chen, J. Power Sources, 2013, 222, 455–460 CrossRef CAS.
- G. Z. Wei, X. Lu, F. S. Ke, L. Huang, J. T. Li, Z. X. Wang, Z. Y. Zhou and S. G. Sun, Adv. Mater., 2010, 22, 4364–4367 CrossRef CAS PubMed.
- Y. Zang, C. X. Ding, X. C. Wang, Z. Y. Wen and C. H. Chen, Electrochim. Acta, 2015, 168, 234–239 CrossRef CAS.
- M. Chen, L. L. Shao, H. B. Yang, T. Z. Ren, G. H. Du and Z. Y. Yuan, Electrochim. Acta, 2015, 167, 278–286 CrossRef CAS.
- I. D. Johnson, M. Lübke, O. Y. Wu, N. M. Makwana, G. J. Smales, H. U. Islam, R. Y. Dedigama, R. I. Gruar, C. J. Tighe, D. O. Scanlon, F. Corà, D. J. L. Brett, P. R. Shearing and J. A. Darr, J. Power Sources, 2016, 302, 410–418 CrossRef CAS.
- E. R. Dai, H. S. Fang, B. Yang, W. H. Ma and Y. N. Dai, Ceram. Int., 2015, 41, 8171–8176 CrossRef CAS.
- G. H. Lee, H. S. Kim, S. G. Baek, H. J. Choi, K. Y. Chung, B. W. Cho, S. Y. Lee and Y.-S. Lee, J. Power Sources, 2015, 298, 379–384 CrossRef CAS.
- L. L. Zhang, H. B. Sun, X. L. Yang, Y. W. Wen, Y. H. Huang, M. Li, G. Peng, H. C. Tao, S. B. Ni and G. Liang, Electrochim. Acta, 2015, 152, 496–504 CrossRef CAS.
- X. Y. Wen, C. X. Ma, C. Q. Du, J. Liu, X. H. Zhang, D. Y. Qu and Z. Y. Tang, Electrochim. Acta, 2015, 186, 58–63 CrossRef CAS.
- X. J. Li, H. X. Xin, Y. F. Liu, D. Li, X. Q. Yuan and X. Y. Qin, RSC Adv., 2015, 5, 45351 RSC.
- K. A. Jarvis, Z. Q. Deng, L. F. Allard, A. Manthiram and P. J. Ferreira, Chem. Mater., 2011, 23, 3614–3621 CrossRef CAS.
- K. A. Jarvis, Z. Q. Deng, L. F. Allard, A. Manthiram and P. J. Ferreira, J. Mater. Chem., 2012, 22, 11550 RSC.
- A. M. Bakhshayesh and N. Bakhshayesh, Mater. Sci. Semicond. Process., 2016, 41, 92–101 CrossRef CAS.
- D. Z. Lu, B. Zhao, P. F. Fang, S. B. Zhai, D. L. Li, Z. Q. Chen, W. H. Wu, W. Q. Chai, Y. C. Wu and N. Qi, Appl. Surf. Sci., 2015, 359, 435–448 CrossRef CAS.
- G. N. Shao, S. M. Imran, S. J. Jeon, S. J. Kang, S. M. Haider and H. T. Kim, Appl. Surf. Sci., 2015, 351, 1213–1223 CrossRef CAS.
| This journal is © The Royal Society of Chemistry 2016 |

