Study on the interaction of berberine with nucleic acids in the presence of silver nanoparticles, and the fluorometric determination of nucleic acids

Yanyan Zhaoa, Haiping Zhoua, Jin Shena, Minqin Wangb and Xia Wu*a
aKey Laboratory of Colloid and Interface Chemistry (Shandong University), Ministry of Education, School of Chemistry and Chemical Engineering, Shandong University, Jinan 250100, P. R. China. E-mail: wux@sdu.edu.cn; Fax: +86 53188564464; Tel: +86 53188365459
bCollege of Life Science Shandong University, Jinan 250100, P. R. China

Received 26th January 2016 , Accepted 16th March 2016

First published on 17th March 2016


Abstract

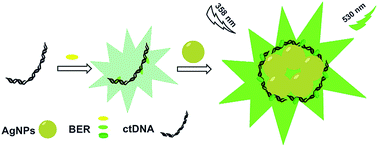
In this paper, the metal-enhanced fluorescence effect of AgNPs to berberine (BER) was found and applied in the sensitive determination of nucleic acids. Under optimum conditions, the enhanced fluorescence intensity of the system exhibited a linear response with concentrations of nucleic acids in the range of 4.0 × 10⁻⁸ to 6.0 × 10⁻⁶ g mL−1 for fish sperm DNA (fsDNA) and 1.0 × 10⁻⁸ to 4.0 × 10⁻⁶ g mL−1 for calf thymus DNA (ctDNA). Their corresponding detection limits (S/N = 3) are 21 ng mL−1 and 7.9 ng mL−1. This method had been successfully used to detect plasmid DNA in actual samples. In addition, the results of this study on the interaction mechanism of the system evidenced that the partial intercalation binding action between BER and ctDNA was strengthened by AgNPs. The ctDNA could induce the aggregation of AgNPs and provide an appropriate distance for BER and AgNPs, which resulted in the enhancement of the fluorescence intensity and the anti-photobleaching activity of BER.


Introduction

Berberine (BER), a kind of nucleic acid binding isoquinoline alkaloid extracted from traditional Chinese medicine Coptis Chinensis, has diverse biological activities and wide potential therapeutic properties such as antimicrobial activity, antiviral activity and antitumor effects.1–3 The structure of berberine is shown in Scheme 1.
image file: c6ra02346k-s1.tif
Scheme 1 The chemical structure of BER.

BER is used as a fluorescent stain for cells, chromosomes and energized mitochondria.4,5 However, some studies reported that the overuse of BER could produce phototoxicity and induce photo damage to HaCaT keratinocytes.6,7 To understand the interaction mechanism between BER and DNA, several researches were performed on the binding mode between them. Sarah et al. proposed a partial intercalation mode of BER with calf thymus DNA (ctDNA).8 However, Li et al. suggested a groove binding rather than an intercalation process between BER and ctDNA.9 Then, the research group of Mazzini indicated that BER bound preferentially to the AT-rich minor groove of DNA.10 Recently, Liu and his coworkers thought that the interactive pattern of BER with DNA was groove binding.11 Whereas, according to the modeled results of the spectroscopic and photophysical behavior of palmatine, a kind of protoberberine molecule, in water solution, Dumont et al. proposed a competition mode of minor groove binding with insertion coexisted between palmatine and DNA.12 Nowadays, there is still no consensus opinion on the interaction between BER and DNA. This problem still need further study. Our research aims to provide evidence for solving the problem.

Silver nanoparticles (AgNPs) possess outstanding particular optical, magnetic, electronic and catalytic properties. They are widely used in material science, physics and chemistry fields.13 Especially, the signal amplification strategies based on surface-enhanced Raman scattering (SERS) and surface-enhanced fluorescence of AgNPs have been utilized for the sensitive detection and quantitation of target analytes.14,15 The excellent effect of metal-enhanced fluorescence (MEF) is not only related to the shape and size of metal particles, and the spectral overlap efficiency between surface plasmon resonance absorption of metal nanoparticles and excitation or emission spectra of dyes, but also affected by the distance between the dye molecules and nanometal particle surfaces.16–19 To obtain stronger MEF effect, many studies have been focused on tuning the distance of dye molecules to metal particle surface. Zhang et al. proposed that regulating the distance from Eu-complexes to Ag surface by changing the shell thickness of Ag@SiO2 could give 5.1-fold fluorescence enhancements on the Eu-complexes.20 The research team of Akbay reported that a 9-fold increase in the fluorescence intensity was obtained when the thickness of poly(styrene sulfonate) and poly(allylamine hydrochloride) layer-by-layer assembly on aluminum nanostructured surface was at about 9 nm.21 Zhang et al. presented the quenched fluorescence, causing by the adsorption of dye-labeled single-stranded DNA (ssDNA) on core–shell nanoparticles of Ag@poly(m-phenylenediamine), could be recovered by the desorption of ssDNA owing to its hybridization with target DNA.22 Our previous studies showed that surfactants and nucleic acids could also act as distance regulators to enhance the fluorescence intensities of flavonoids based on the MEF of AgNPs.23,24

In this work, our investigation aims to provide evidence for the interaction mode between BER and DNA, and improve the sensitivity of the detection method of DNA and then lower the usage of BER based on the MEF effect of AgNPs. Herein, the new-prepared AgNPs were set as an enhancement factor for the fluorescence of BER–nucleic acids. Based on this, a novel fluorescence enhancement method for the determination of nucleic acids was developed. The detection limits (S/N = 3) were reduced to the nanogram per milliliter level. And the anti-photobleaching activity of the system was also improved. The interaction mechanism of the AgNPs–ctDNA–BER system was also studied from aspects of fluorescence polarization, absorption spectra, circular dichroism spectra (CD), fluorescence enhancement mechanism and so on.

Experimental

Apparatus

The fluorescence spectra, fluorescence polarization values and resonance light scattering spectra were measured using a LS-55 spectrofluorimeter (PE, USA). All the fluorescence lifetimes were obtained by using an FLS920 fluorescence spectrometer (Edinburgh Instruments, UK). TEM images were measured on JEM-1011 CXII Transmission Electron Microscopes (JEOL, Japan). All the absorption spectra of the AgNPs–ctDNA–BER system were measured using a U-4100 spectrophotometer (Hitachi, Japan). All CD spectra were collected on a J-810S Circular Dichroism Spectrometer (JASCO, Japan). All pH measurements were made with a Delta 320-S acidity meter (Mettler Toledo, Shanghai).

Reagents

Stock solutions of nucleic acids (1.0 × 10⁻⁴ g mL−1) were prepared by dissolving commercial fish sperm DNA (fsDNA, Sigma) and calf thymus DNA (ctDNA, Beijing Baitai Co., China) in 0.05 mol L−1 sodium chloride solutions. A stock solution of AgNPs (2.0 × 10⁻⁴ g mL−1) was prepared by dissolving 0.0158 g of AgNO3 in 40 mL of 0.22 μm-filtered doubly distilled water, 2 mL sodium citrate (1%) was added slowly in above AgNO3 solution by heating at 86 °C with stirring for 30 min, the solution color changed from colorless to olivine gradually, then diluted to 50 mL finally. The maximum absorption peak of AgNPs is at 423 nm. Above solutions were stored at 0–4 °C. A stock solution of BER (5.0 × 10⁻⁴ mol L−1) was prepared by dissolving 0.0474 g BER in 250 mL volumetric flask with water. All the chemicals used were of analytical reagent grade and double-distilled water was used throughout.

Procedure

To a 25 mL colorimetric tube, the solutions were added in the following order: 0.80 mL of 4.0 × 10⁻⁶ g mL−1 AgNPs, 0.16 mL of 5.0 × 10⁻⁴ mol L−1 BER and appropriate amount of nucleic acids. The mixture was diluted to 10 mL with water. The excitation and emission wavelengths were 358 and 530 nm, respectively. The excitation and emission slits were both 10 nm with a scan speed of 500 nm min−1. The enhanced fluorescence intensity of the system was represented as ΔI = IfI0. Here If and I0 were the fluorescence intensities of the system with and without nucleic acid, respectively.

Results and discussion

Fluorescence spectra

The fluorescence spectra of BER, AgNPs–BER, BER–ctDNA, AgNPs–fsDNA–BER and AgNPs–ctDNA–BER systems are shown in Fig. 1. It can be seen that the fluorescence intensities of BER or BER–AgNPs system are weak under selective conditions. When nucleic acids combined with BER, their fluorescence intensities at 530 nm were obviously enhanced under the excitation of 358 nm wavelength. Furthermore, the fluorescence intensity of the system of nucleic acids–BER got further enhanced in the presence of AgNPs, which suggested that there were interactions among AgNPs, BER and nucleic acids and the AgNPs-based metal-surface fluorescence enhancement was achieved. In this study, 358 nm and 530 nm were chosen as the excitation and emission wavelength, respectively.
image file: c6ra02346k-f1.tif
Fig. 1 Fluorescence spectra. (a) Excitation spectra (λem = 530 nm) (b) emission spectra (λex = 358 nm). (1) BER (2) AgNPs–BER (3) BER–ctDNA (4) AgNPs–fsDNA–BER (5) AgNPs–ctDNA–BER. Conditions: AgNPs: 3.2 × 10⁻⁷ g mL−1; BER: 8.0 × 10⁻⁶ mol L−1; ctDNA: 4.0 × 10⁻⁶ g mL−1; fsDNA: 4.0 × 10⁻⁶ g mL−1.

Optimization of the general procedure

Effect of pH and the choice of buffer solution. The effect of solution pH on the fluorescence intensity of the system was tested (Fig. S1, in the ESI). The maximum enhanced fluorescence is at pH 7.0, and the effect of different buffers on the fluorescence intensity shows that H2O was the most suitable medium.
Effects of concentrations of AgNPs and BER. The effects of the concentrations of AgNPs and BER on the fluorescence intensity of the system were monitored, respectively. (Fig. S2 and S3, in the ESI). The enhanced extents of the fluorescence intensities reached maximum values when the concentrations of AgNPs and BER were 3.2 × 10⁻⁷ g mL−1 and 8.0 × 10⁻⁶ mol L−1, respectively. So they were chosen for the further experiment.
Effect of the order of adding reagents and signal stability. The effect of the adding order of the reagents on the enhanced fluorescence intensity was investigated. The results indicated that the order of AgNPs, BER and ctDNA was the best. Under the optimum condition, the effect of incubation time on the fluorescence intensity was also investigated. The results showed that the value of ΔI reached a maximum within 3 min and remained stable at least for 50 min.

The fluorescence photobleaching property of the system was monitored under continuous irradiation of the excitation light (λex = 358 nm) with a pulsed-xenon flash lamp as the source lamp with 20 kW for 8 μs duration. The result indicated that owing to the addition of AgNPs, the maintain time of the fluorescence intensity of the BER–ctDNA system was lengthened from 8 to 20 min with relative error less than ±5%. Therefore, the system of BER–ctDNA with AgNPs appeared high stability against fluorescence photobleaching compared to the system without AgNPs.

Effects of foreign substances. The interferences of foreign substances were tested and shown in Table 1. The results indicated that most of tested metal ions and amino acids had little effect on the fluorescence intensity within ±5% relative error, excepted for Ni2+, Cu2+, AMP and CMP.
Table 1 Interferences from foreign substancesa
Foreign substances Concentration coexisting × 10−6 mol L−1 Change of ΔIf (%)
a Conditions: AgNPs: 3.2 × 10⁻⁷ g mL−1; BER: 8.0 × 10⁻⁶ mol L−1; ctDNA: 1.0 × 10⁻⁶ g mL−1.
Al3+, Cl 4.6 −3.1
Na+, Cl 25 −4.9
Ni2+, SO42− 1.6 −4.9
Ca2+, Cl 15 −5.1
Na+, CH3COO 10 +4.1
NH4+, Cl 20 −4.6
Cu2+, SO42− 1.0 −5.6
AMP 1.0 −3.3
TMP 3.0 −3.2
CMP 6.0 −3.7
UMP 1.8 −3.2
L-Phe 12 −5.2
Trp 5.0 −5.0
Cys 4.0 −5.4
L-Asp 10 −4.5
L-His 20 −5.3


Analytical applications

Calibration graphs and detection limits. Under the optimal condition, the value of ΔI and the concentrations of nucleic acids is a linear relationship. The calibration curves and the analytical parameters are shown in Fig. S4 (in the ESI) and Table 2. There are good linear relationships between ΔI and the concentration of nucleic acid in the range of 4.0 × 10⁻⁸ to 6.0 × 10⁻⁶ g mL−1 for fsDNA and 1.0 × 10⁻⁸ to 4.0 × 10⁻⁶ g mL−1 for ctDNA, respectively. And their corresponding relative standard deviations (RSD) of the slopes of their calibration curves are 4.4% for fsDNA and 1.0% for ctDNA. The correlation coefficient of fsDNA is 0.9886 and that of ctDNA is 0.9998, and their detection limits (S/N = 3) are 2.1 × 10⁻⁸ g mL−1 and 7.9 × 10⁻⁹ g mL−1, respectively.
Table 2 Analytical parameters of this method
DNA Linear equation Correlation coefficient LOD (g mL−1)
fsDNA ΔI = 23.32 + 4.89 × 10⁷CfsDNA 0.9886 2.1 × 10⁻⁸
ctDNA ΔI = 21.87 + 6.10 × 10⁷CctDNA 0.9998 7.9 × 10⁻⁹


Sample determination. An actual sample of plasmid DNA, isolated from E. coli as described by Birnboim, was tested by the standard addition method.25 The concentration of plasmid DNA in the sample was 7.0 × 10⁻⁴ g mL−1 by using a Biophotometer (Eppendorf Co.). The sample was diluted 2000 times and determined by this proposed method, the mean value of the three measurements was 6.9 × 10⁻⁴ g mL−1 and the relative standard deviation was 4.6% (n = 3). Hence, the proposed method is suitable for the determination of trace amount of nucleic acids in this sample.

Interaction mechanism of the system

Assembly behavior of AgNPs. Resonance light scattering is a powerful tool to study properties of aggregations. In this paper, the effects of BER and ctDNA on the aggregation of AgNPs were characterized by the RLS spectra (see Fig. 2). The results showed that the RLS intensity of AgNPs was weak. When BER or ctDNA were added in AgNPs solution, respectively, the RLS intensities of AgNPs–BER and AgNPs–ctDNA both increased while the increased extent of the RLS intensity of AgNPs–BER was obviously lower than that of AgNPs–ctDNA. Particularly, the profiles of their RLS spectra exhibited obvious difference that the maximum spectrum peak positions of AgNPs–BER and AgNPs–ctDNA were located at 358 nm and 386 nm, respectively. Those might be attributed to the assemblies of AgNPs with BER or ctDNA and to the absorptions of AgNPs, BER and ctDNA in the range of 250–280 nm. Moreover, when AgNPs, BER and ctDNA coexisted in the system, the RLS intensity increased dramatically. And the profile of the RLS spectrum was similar to that of AgNPs–BER system. The two peaks shown in the spectrum were located at about 310 nm and 386 nm, respectively. We thought that they should be largely ascribed to the absorption of BER. In addition, according to the RLS theory, the increase in aggregation extent of particles was a main reason for the RLS enhancement.26,27 Therefore, we consider that the AgNPs coexisted with BER and ctDNA form the larger aggregates in the system.
image file: c6ra02346k-f2.tif
Fig. 2 Resonance light scattering spectra. (1) BER (2) AgNPs (3) AgNPs–BER (4) AgNPs–ctDNA (5) AgNPs–ctDNA–BER. Conditions: AgNPs: 3.2 × 10⁻⁷ g mL−1; BER: 8.0 × 10⁻⁶ mol L−1; ctDNA: 1.0 × 10⁻⁶ g mL−1.

The aggregation of AgNPs can be directly supported by the TEM results. The TEM images of AgNPs (a), AgNPs–BER (b) and AgNPs–ctDNA–BER (c) are shown in Fig. 3. It is suggested that the AgNPs are spherical in shape, about 15 nm in size, and well dispersed (Fig. 3a). The nanoparticles of AgNPs–BER partly congregate and their sizes are about 30–80 nm (Fig. 3b). In the system of AgNPs–ctDNA–BER, the particles are about 250–400 nm in size (Fig. 3c). It proves that AgNPs coexisted with BER and ctDNA can form larger aggregates.


image file: c6ra02346k-f3.tif
Fig. 3 Transmission electronic microscopy (a–c). (a) AgNPs (b) AgNPs–BER (c) AgNPs–ctDNA–BER. Conditions: AgNPs: 1.8 × 10⁻⁶ g mL−1; ctDNA: 8.0 × 10⁻⁶ g mL−1; BER: 8.0 × 10⁻⁵ mol L−1.

The fluorescence polarization value is related to the molecular size. A smaller molecule owns a lower polarization value owing to its faster rotation rate, vice versa.28 To investigate the effect of AgNPs on the interaction between BER and ctDNA, the fluorescence polarizations are examined. The polarization values (P) of BER, BER–ctDNA, AgNPs–BER and AgNPs–ctDNA–BER are 0.16, 0.19, 0.17 and 0.23, respectively. The results show that the P of AgNPs–BER is bigger than that of BER, which indicates that the rotation of BER is restricted. We think that BER should be adsorbed on the surface of AgNPs. In addition, the fluorescence polarization is commonly used to study the binding mode between fluorophores and nucleic acids. It is generally believed that the intercalation combination between them is the main reason for the increase in the fluorescence polarization value.29 Herein, when binding with ctDNA, BER gets a higher P, indicating that the intercalation binding mode plays the main role between them. The biggest P generates in the system of AgNPs–ctDNA–BER and the enhancement extent of P is larger than that of the system without AgNPs. We guess that the complexes of BER–ctDNA are adsorbed on the surface of AgNPs whilst AgNPs in turn strengthen the intercalation binding between them.

In order to gain deeper insight into the interaction mechanism of the system, the absorption spectra are also tested. As shown in Fig. 4, BER has four absorption bands in the visible region which are located at 229 nm, 264 nm, 344 nm and 422 nm, respectively. According to the molecule structure of BER, we infer that the former two shorter absorption bands may originate from the benzodioxolo moieties of BER and the latter two peaks derive from the absorptions of isoquinoline quinolizinium moieties of BER. When BER combined with ctDNA, the red-shift and hypochromic effect only occurred in the two long wave bands, but the two peak positions at 229 nm and 264 nm underwent unchanged and the intensities both decline. Moreover, three isosbestic points are shown at 355, 382 and 445 nm, respectively. According to the reported literature, we think that there are at least two combination modes between BER and ctDNA, the intercalation of isoquinoline moieties and the groove binding of benzodioxolo moieties of BER.10,30,31 Furthermore, in the system of AgNPs–ctDNA–BER, the intensities of the four absorption peaks all decrease, but more red-shift both occur in the peaks located at 264 nm and 422 nm and the other two wavelength absorption bands remain constant. And the three isosbestic points shift to 358, 382 and 440 nm, respectively. The results indicate that AgNPs can effectively promote the interactions between BER and ctDNA.


image file: c6ra02346k-f4.tif
Fig. 4 Absorption spectra of AgNPs–ctDNA–BER system; figure (inset): the absorption spectrum at 422 nm. Conditions: AgNPs: 3.2 × 10⁻⁷ g mL−1; BER: 8.0 × 10⁻⁶ mol L−1; ctDNA: (2 and 3): 3.3 × 10⁻⁶ g mL−1, (5 and 6): 2.0 × 10⁻⁵ g mL−1; (1) BER; (2 and 6) BER–ctDNA (vs. ctDNA); (3 and 5) AgNPs–ctDNA–BER (vs. AgNPs–ctDNA); (4) AgNPs–BER (vs. AgNPs).

The CD-spectra of nucleic acids in the UV range are useful in monitoring the conformational changes to explain the interaction of dye molecules with them.32 The CD spectra of the system are tested (Fig. 5). A positive Cotton effect at 275 nm and a negative Cotton effect at 245 nm correspond to base stacking of ctDNA and its helicity structure, respectively.33 Compared with ctDNA, the intensity of the positive band of the BER–ctDNA increases and that of the negative band slightly decrease. We think that the intercalative binding mode between BER and base-pair of ctDNA get further proved which is consistent with literatures. Many research reported that the intercalation binding mode could result in the increase in the intensity of the positive CD peak and the decrease in the intensity of the negative CD peak of ctDNA.34–36 Additionally, the two CD bands of ctDNA decrease significantly in intensity in presence of AgNPs, the peak positions both shift to longer wavelength, which indicates that AgNPs can induce conformational changes in the base stacking and in the helical structure of ctDNA. When AgNPs, BER and ctDNA coexist in the system, the intensity of the negative CD peak further decreases, while that of the positive CD peak increases. In addition, the change extents of the ellipticities are larger than that of without AgNPs. These results further testify that the intercalation binding mode and the groove binding mode between BER and ctDNA are both strengthened with the conformational changes of ctDNA by AgNPs.37,38


image file: c6ra02346k-f5.tif
Fig. 5 The CD spectra of the AgNPs–ctDNA–BER system. (1) ctDNA (2) BER–ctDNA (3) AgNPs–ctDNA (4) AgNPs–ctDNA–BER. Conditions: AgNPs: 3.2 × 10⁻⁶ g mL−1; BER: 8.0 × 10⁻⁵ mol L−1; ctDNA: 5.0 × 10⁻⁶ g mL−1.

The fluorescence lifetime is always used to study the binding of fluorophores to nucleic acids. Literatures showed that the alteration of the fluorescence lifetime was related to the binding modes between fluorophores and nucleic acids. The intercalative binding mode caused increase in fluorescence lifetime (τ), whereas the groove binding mode induced decrease in τ.39,40 In this paper, the τ values of the systems are measured by the single photon counting technique. The fluorescence lifetime decay curves of the systems are fitted well by double-exponential functions which are shown in Fig. S5 (in the ESI) and Table 3. It can be seen in Table 3 that the τ1 value of BER is shortened while its τ2 value is markedly elongated by the addition of ctDNA. The results also imply that the binding modes between BER and ctDNA are complex. It is further explained that two chromophore moieties of BER, benzodioxolo and quinolizinium, bind with ctDNA by means of the groove binding and the intercalative modes, respectively. In contrast, the τ2 value of AgNPs–ctDNA–BER markedly decreases due to the MEF effect of AgNPs.41 But its τ1 value increases, indicating that ctDNA could provide a more hydrophobic environment for BER and the interactions between them are strengthened.

Table 3 The fluorescence lifetimes of the system
  τ1 (rel%) τ2 (rel%) χ2
BER 4.31 (53) 0.52 (47) 0.979
BER–ctDNA 1.41 (37) 6.19 (63) 1.007
AgNPs–BER–ctDNA 6.47 (67) 1.25 (33) 1.054


Fluorescence enhancement mechanism. Based on the MEF theory and the above experimental data, we believe that the MEF effect of AgNPs mainly occurs in intercalative moieties.41 In this case, ctDNA, as a bridge between BER and AgNPs, could provide a suitable distance from BER to AgNPs and increase the radiative decay rate of BER, and then enhance the fluorescence intensity. The ctDNA conformations altered by AgNPs provide a more hydrophobic environment for the groove binding moieties of BER and make BER emit stronger fluorescence. The synergistic interaction of the MEF and the ctDNA conformational changes based on AgNPs results in higher photostability and in the enhancement of fluorescence intensity in the AgNPs–ctDNA–BER system.

Conclusions

In the presence of AgNPs, nucleic acids can observably enhance the fluorescence intensity of BER. A simple and sensitive method based on the metal-enhanced fluorescence effect of AgNPs has been established for the determination of nucleic acid. The results are satisfied for the determination of DNA in actual samples. The study on the interaction mechanism indicated that the ctDNA as a bridge-linker could tune the distance from BER to AgNPs and induce AgNPs-based metal-enhanced fluorescence effect. Moreover, AgNPs can strengthen the partial intercalation binding mode between BER and ctDNA and improve the anti-photobleaching activity of the ctDNA–BER system.

Acknowledgements

This work is supported by National Natural Science Foundation of China (21545001) and Shandong Provincial Natural Science Foundation, China (ZR2013BM025).

Notes and references

  1. Y. Cai, Q. Xia, R. Luo, P. Huang, Y. Sun, Y. Shi and W. Jiang, J. Nat. Med., 2014, 68, 53–62 CrossRef CAS PubMed.
  2. S. Chatterjee, S. Mallick, F. Buzzetti, G. Fiorillo, T. M. Syeda, P. Lombardi, K. D. Saha and G. S. Kumar, RSC Adv., 2015, 5, 90632–90644 RSC.
  3. K. Bhadra and G. S. Kumar, Med. Res. Rev., 2011, 6, 821–826 CrossRef PubMed.
  4. V. M. Borodina, E. E. Kiranova, O. V. Fedorova and A. V. Zelenin, Exp. Cell Res., 1979, 122, 391–394 CrossRef CAS PubMed.
  5. R. Vaidya, A. Vaidya, C. Godse, A. B. Vaidya and S. S. Talwalkar, Am. J. Clin. Pathol., 2005, 124, 408–412 CrossRef.
  6. J. J. Inbaraj, B. M. Kukielczak, P. Bilski, S. L. Sandvik and C. F. Chignell, Chem. Res. Toxicol., 2001, 14, 1529–1534 CrossRef CAS PubMed.
  7. L. Zhu, B. Huang, X. Ban, J. He, Y. Chen, L. Han and Y. Wang, Food Chem. Toxicol., 2012, 50, 2584–2588 CrossRef CAS PubMed.
  8. A. Sarah, S. Srivastava, E. Coutinho and M. Maiti, Indian J. Biochem. Biophys., 1995, 32, 74–77 Search PubMed.
  9. W. Y. Li, H. Lu, C. X. Xu, J. B. Zhang and Z. H. Lu, Spectrosc. Lett., 1998, 31, 1287–1298 CrossRef CAS.
  10. S. Mazzini, M. C. Bellucci and R. Mondelli, Bioorg. Med. Chem., 2003, 11, 505–514 CrossRef CAS PubMed.
  11. B. M. Liu, J. Zhang, X. Wang, L. P. Zhang and Y. Liu, J. Lumin., 2015, 159, 128–133 CrossRef CAS.
  12. D. Élise and M. Antonio, J. Phys. Chem. B, 2015, 119, 410–419 Search PubMed.
  13. A. G. Wu, W. L. Cheng, Z. Li, J. G. Jiang and E. Wang, Talanta, 2006, 68, 693–699 CrossRef CAS PubMed.
  14. D. Cialla, A. März, R. Böhme, F. Theil, K. Weber, M. Schmitt and J. Popp, Anal. Bioanal. Chem., 2012, 403, 27–54 CrossRef CAS PubMed.
  15. G. Braun, S. J. Lee, M. Dante, T. Q. Nguyen, M. Moskovits and N. Reich, J. Am. Chem. Soc., 2007, 129, 6378–6379 CrossRef CAS PubMed.
  16. H. Li, W. Qiang, M. Vuki, D. Xu and H. Y. Chen, Anal. Chem., 2011, 83, 8945–8952 CrossRef CAS PubMed.
  17. Y. H. Chan, J. Chen, S. E. Wark, S. L. Skiles, D. H. Son and J. D. Batteas, ACS Nano, 2009, 3, 1735–1744 CrossRef CAS PubMed.
  18. D. Cheng and Q. H. Xu, Chem. Commun., 2007, 248–250,  10.1039/b612401a.
  19. C. Farcău and S. Aştilean, Appl. Phys. Lett., 2009, 95, 193110–193113 CrossRef.
  20. H. X. Zhang, X. M. Lin, A. L. Wang, Y. L. Zhao and H. B. Chu, Spectrochim. Acta, Part A, 2015, 151, 716–722 CrossRef CAS PubMed.
  21. N. Akbay, J. R. Lakowicz and K. Ray, J. Phys. Chem. C, 2012, 116, 10766–10773 CAS.
  22. Y. W. Zhang, L. Wang, J. Q. Tian, H. L. Li, Y. L. Luo and X. P. Sun, Langmuir, 2011, 27, 2170–2175 CrossRef CAS PubMed.
  23. X. Liu and X. Wu, RSC Adv., 2015, 5, 7433–7439 RSC.
  24. Y. H. Cao, X. Wu and M. Q. Wang, Talanta, 2011, 84, 1188–1194 CrossRef CAS PubMed.
  25. H. C. Birnboim, Methods Enzymol., 1983, 100, 243–255 CAS.
  26. C. Z. Huang, K. A. Li and S. Y. Tong, Anal. Chem., 1997, 69, 514–520 CrossRef CAS PubMed.
  27. Q. E. Cao, Y. K. Zhao, X. J. Yao, Z. D. Hu and Q. H. Xu, Spectrochim. Acta, Part A, 2000, 56, 1319–1327 CrossRef.
  28. B. C. Ye and B. C. Yin, Angew. Chem., 2008, 47, 8386–8389 CrossRef CAS PubMed.
  29. F. Cui, R. Huo, G. Hui, X. Lv, J. Jin, G. Zhang and W. Xing, J. Mol. Struct., 2011, 1001, 104–110 CrossRef CAS.
  30. R. Sinha, M. M. Islam, K. Bhadra, G. S. Kumar, A. Banerjee and M. Maiti, Bioorg. Med. Chem., 2006, 14, 800–814 CrossRef CAS PubMed.
  31. M. Mónika and L. Biczósk, J. Phys. Chem. B, 2007, 111, 5635–5639 CrossRef PubMed.
  32. Y. L. Zhou and Y. Z. Li, Biophys. Chem., 2004, 107, 273 CrossRef CAS PubMed.
  33. Y. He, Y. Shang, Z. Liu, S. Shao, H. Liu and Y. Hu, Colloids Surf., B, 2013, 101, 398–404 CrossRef CAS PubMed.
  34. C. Liu, S. Liu, Y. Wang, S. Wang, J. Zhang, S. Li, X. Qin, X. Li, K. Wang and Q. Zhou, Med. Chem. Res., 2013, 23, 1899–1907 CrossRef.
  35. L. Xie, J. Cui, X. Qian, Y. Xu, J. Liu and R. Xu, Bioorg. Med. Chem., 2011, 19, 961–967 CrossRef CAS PubMed.
  36. H. Kumar, V. Devaraji, R. Prasath, M. Jadhao, R. Joshi, P. Bhavana and S. K. Ghosh, Spectrochim. Acta, Part A, 2015, 151, 605–615 CrossRef CAS PubMed.
  37. W. Zhong, J. S. Yu, Y. Liang, K. Fan and L. Lai, Spectrochim. Acta, Part A, 2004, 60, 2985–2992 CrossRef PubMed.
  38. M. Bordbar, M. Tabatabaee, A. Yeganeh Faal, Z. Mehri Lighvan and R. Fazaeli, Synth. React. Inorg., Met.-Org., Nano-Met. Chem., 2015, 45, 1882–1888 CrossRef CAS.
  39. L. Nardo, M. Bondani and A. Andreoni, Photochem. Photobiol., 2008, 84, 101–110 CAS.
  40. V. Zozulya, Y. Blagoi, G. Löber, I. Voloshin, S. Winter, V. Makitruk and A. Shalamay, Biophys. Chem., 1997, 65, 55–63 CrossRef CAS PubMed.
  41. C. D. Geddes and J. R. Lakowicz, J. Fluoresc., 2002, 12, 121–129 CrossRef.

Footnote

Electronic supplementary information (ESI) available. See DOI: 10.1039/c6ra02346k

This journal is © The Royal Society of Chemistry 2016
Click here to see how this site uses Cookies. View our privacy policy here.