Fabrication of laminated and coated Nafion 117 membranes for reduced mass transfer in microbial fuel cells

Vikash Kumar, Piyush Kumar, Arpita Nandy and Patit P. Kundu*
Advanced Polymer Laboratory, Department of Polymer Science & Technology, University of Calcutta, 92 A. P. C. Road, Kolkata – 700009, India. E-mail: ppk923@yahoo.com; Fax: +91-33-2352-510; Tel: +91-33-2352-510

Received 25th January 2016 , Accepted 15th February 2016

First published on 16th February 2016


Abstract

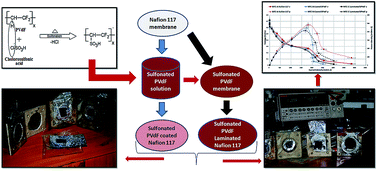
Sulfonation of polyvinylidinefluoride (PVdF) with chlorosulfonic acid for 2 hours revealed a respective 33% degree of sulfonation (DS) in a SPVdF membrane. The resulting sulfonated PVdF resins were used for Nafion 117 modification as coat and laminating materials, where the modified Nafion 117 membranes (laminated and coated with SPVdF) were used as polymer electrolyte membranes in microbial fuel cells (MFCs). Coating/lamination exhibited reduced oxygen diffusion across membranes by a magnitude of less than two orders over a pristine Nafion 117 membrane. This resulted in higher open circuit voltages (OCVs) with increased coulombic efficiency (CE) in MFCs. With SPVdF coated and laminated Nafion 117 membranes, respective IEC values of 0.57 and 0.46 meq g−1 and proton conductivities of 5.91 × 10⁻³ and 5.11 × 10⁻³ S cm−1 were observed, indicating maximum power and current densities of 446.45 ± 21 mW m−2 & 1721.78 ± 86 mA m−2 and 413.79 ± 20 mW m−2 & 1657.57 ± 82 mA m−2 in MFCs using mixed Firmicutes as biocatalysts. The obtained coulombic efficiencies were higher (approx. 1–2%) than those of pristine Nafion 117, indicative of its reduced oxygen diffusion at the anode. In effect, the study enumerates the efficiency of modified Nafion 117 with sulfonated PVdF coated and laminated membranes as a separating barrier in single-chambered MFCs for microbial bio-energy conversion.

Introduction

A microbial fuel cell (MFC) is a bacteria-catalyzed electrochemical green energy device that not only reduces the fossil fuel crisis, but also harnesses available bio-energy from the given substrate.1,2 In the early 1980s, Bennetto et al. were one of the first groups that exploited microbial electrochemical potential in MFC research.3,4 This involved microbial substrate oxidation that generated potential at the anode, ensuring the liberation of protons and electrons in the system. In principle, electrons move towards cathode through an external circuit, indicating current flow where, proton gets simultaneously transferred via polymer electrolyte membranes (PEM). This completes the circuit and ultimately allows conversion of chemical energy into electrical energy via microbes.

PEM serves as a decisive factor in MFCs, where, it alone contributes to more than 38% of the overall expense of the system.5 One good example is Nafion® that has been used widely because of its excellent chemical stability and higher proton conductivity. Relatively, in order to reduce the high cost, several other materials and its optimization have been conducted e.g., polystyrene, polyether ether ketone (PEEK), poly (arylene ether sulfone), phenylated polysulfone, polyphosphazenes, polyimides, polybenzimidazole (PBI) and polypropylene (PP).6–9 As an alternate, membranes like sulfonated polystyrene–ethylene–butylene–polystyrene (SPSEBS) and sulfonated polyether ether ketone (PEEK) have been reported to be producing respectively approx. ∼106.9% and 55.2% higher power density over Nafion 117 membrane.10,11

Recently, polyvinylidinefluoride (PVdF) and its co-polymer have been reported to enhance membrane property in Nafion. Its application as a blend/composite, coating and/or laminate material has been widely reported.12–16 Having a similar fluorinated-carbon backbone structure as Nafion, numerous studies on sulfonation, IPNs and varied blend compositions have been reported to enhance membrane's intrinsic properties.17–24 Generally, any ion permeable material with least mass transfer can function as efficient barrier in fuel cells. Nafion with its high cost and increased diffusion coefficient adds as a major drawback in fuel cell operation.25,26 This result in increased cross potentials in Nafion, which on coating/laminating with any mild-hydrophobic polymer could be minimized to some extent. In a related study, Kim et al. showed PVdF as a laminate material and concluded that the PEM consisting of 20% PVdF exhibits better cell performance at higher temperature (>100 °C).16 Further, these laminated/coated membranes resulted in better membrane properties over their blend compositions in DMFC, due to their excellent inbuilt pore blocking efficiencies in the system.27,28 However, being extremely hydrophobic, PVdF also reduces the resulting ion exchange and proton conductive capacity of the membranes. To minimize the effect, dehydrofluorination of PVdF with H2SO4 doping has been shown to enhance its ion conductivity as comparable to Nafion 115.29 Further, electrophilic substitutions induced by sulfonation could also enhance PVdF intrinsic properties with adequate mechanical and chemical stability for membrane preparation.24

Based on the above ideas, we conducted (a) the sulfonation of PVDF (SPVDF) with chlorosulfonic acid and (b) used it as coat and laminate over Nafion 117 membrane, to study its effect on membrane water uptake, mass transfer, ion exchange and proton conductive capacities. Further, the casted SVPDF coated/laminated membranes have been analyzed in single chambered open air MFCs for bio-energy generation, using mixed electrogenic Firmicutes as biocatalysts.

Result and discussion

Fourier transform infrared (FTIR) analysis

Sulfonation of polyvinylidinefluoride (PVdF) was carried out with treatment of chlorosulfonic acid for 2 hours. The structural identities of various functional groups were characterized by FT-IR spectroscopy. Fig. S1 (ESI) features the major peak differences in casted pure and sulfonated PVdF membranes. The corresponding IR peak intensities at 1164 cm−1 and 1399 cm−1 were assigned to the symmetrical and asymmetrical stretching of the constituent S[double bond, length as m-dash]O bonds of –SO3H groups. Another peak at 1070 cm−1 revealed the presence of pendent sulfonic groups in the membrane structure. Relatively, the characteristic peak intensities at 3200–3390 cm−1 were observed in sulfonated membranes, corresponding to –OH group stretching. Since, all these peaks were found absent in pure PVdF, the latter ensured the effect of sulfonation on PVdF membrane structure. The peak intensities near 1458 cm−1 were found unchanged for both pure and sulfonated PVdF membranes, where, relatively different prominent peak intensities in S-PVdF ensured the incorporation of sulfonate groups within PVdF structure. The particular peak areas at 1164 cm−1 were used for comparing the obtained area (X) in sulfonated PVdF with that of pure PVdF membrane (Y). From the obtained X[thin space (1/6-em)]:[thin space (1/6-em)]Y ratio, the degree of substitution (DS) were calculated for the samples. In effect, with membrane darkening, the peak intensities revealed a maximum of 33% degree of substitution (DS) in sulfonated PVdF membrane, as obtained in earlier studies.30

Water uptake and swelling ratio analysis

Using eqn (1), water uptake (WU) values for the samples were obtained. Fig. 1 depicts the respective water uptake values of the membranes. The sulfonation of the otherwise hydrophobic PVdF, showed subsequent increase in hydrophilicity, where increasing degree of sulfonation (∼33%) indicated relatively an enhanced 8.7% water uptake in SPVdF membranes. Water absorption prevailed via hydrogen bond interactions between surface –SO3H groups and water molecules. As a result, the water retention capacity increased within sulfonated PVdF membranes.
image file: c6ra02234k-f1.tif
Fig. 1 Water uptake and swelling ratios of membranes.

Enhanced water uptake capacities were observed in Nafion 117 membranes with an approximate value of 17.1%. In cases of SPVdF-coated and laminated Nafion 117 membranes, a respective water uptake of 14.2 and 12.6% were observed. These marked reductions were due to the incorporated SPVdF coats and laminates over Nafion 117 membrane that resulted in less available sulfonic acids in the corresponding Nafion 117 membranes to interact with water molecules. The additional layer of SPVdF polymer constricted the straight channels in Nafion that slightly lowered its water affinity in the membranes.

A direct correlation existed between DS and water retention capacity of SPVdF membranes, where 2 hours sulfonation directly influenced the membrane structure with increased sulfonic group incorporation in the membranes. To rationalize the results, swelling ratio of the membranes were analyzed using eqn (2). This followed the same trend as that obtained for the water uptake analysis. A respective swelling ratio (SR) of 3%, 5.7%, 7.1% and 9.3% were observed in SPVdF, SPVdF laminated Nafion 117, SPVdF coated Nafion 117 and pristine Nafion 117 membranes. The decline in the swelling ratios of SPVdF coated and laminated membranes, compared to pristine Nafion 117 were due to the same aforementioned reason that reduced the water uptake capacities in the membranes. Nevertheless, reductions in both the parameters (water uptake and swelling ratios), obtained for SPVdF coated and laminated membranes, were considered better for reduced mass transfer over naive Nafion 117 membrane.

Analysis of IEC and proton conductivity

Membrane ion-exchange capacities (IEC) were calculated by displacing the initially attached/incorporated ions by an oppositely charged ion present in the surrounding solution.31 Fig. 2 illustrates the IECs obtained for the respective SPVdF, SPVdF laminated Nafion 117, SPVdF coated Nafion 117 and pristine Nafion 117 membranes. A respective values of 0.13 meq g−1, 0.46 meq g−1, 0.57 meq g−1, and 0.081 meq g−1 were observed from SPVdF, SPVdF laminated/coated and Nafion 117 membranes.
image file: c6ra02234k-f2.tif
Fig. 2 Ion exchange and proton conductive capacities of casted membranes.

The values clearly signified the effect of 33% sulfonated PVdF incorporation as coat and laminate that showed approximately 30–45% reduced IEC over pristine Nafion 117 membrane. With constriction, reduced –SO3H groups and lower water interaction, directly hindered the resulting IECs in SPVdF coated and laminated membranes. Similarly, the differences in IECs correspondingly influenced the proton conductivity of the membranes. Significant differences in membrane proton conductivity (from 10−1 to 10−4 range) has been has been reported, indicating the effect of membrane nano-filler modification and compressions on transversal ion exchange.32 Corresponding to that, a respective proton conductive values of 1.01 × 10⁻⁴, 5.11 × 10⁻³, 5.91 × 10⁻³ and 3.03 × 10⁻³ S cm−1 were observed in SPVdF, SPVdF laminated Nafion 117, SPVdF coated Nafion 117 and naive Nafion 117 membranes. The incorporation of SPVdF as coats and laminates reduced the availability of surface –SO3H groups within Nafion 117 membranes. This, eventually aided in lowering of the transverse protonic conduction across SPVdF coated and laminated membranes. Nevertheless, it was expected as SPVdF layers on Nafion 117 membrane ensures the constriction of water channels, and thus, resulting in hampering the cross sectional ionic mobility of hydrogen ions in the form of hydronium ions. In effect, the obtained IEC and proton conductivity of SPVdF coated and laminated membranes corresponded towards its decreased WU and SR over Nafion 117 with limited availability of free –SO3H groups, as observed earlier.

Oxygen diffusivity across membranes

Oxygen diffusivity across the membranes was analyzed, indicating the periodic variations in the dissolved oxygen content at anode. The increasing oxygen flux from cathode to anode ensued a respective mass transfer coefficient of 2.7 × 10⁻⁴ cm s−1, 6.27 × 10⁻³ cm s−1 and 8.73 × 10⁻² cm s−1 for Nafion 117, SPVdF-coated and laminated Nafion 117 membranes (Fig. 3). Membrane compactness directly influences the mass transfers where, a similar study showed a respective mass transfer values of ∼5.0 × 10⁻⁵ cm s−1, 7.5 × 10⁻⁴ cm s−1, 290 × 10−5 cm s−1 and 9.4 × 10⁻⁵ cm s−1 in glass fibers (1.0–0.4), J-cloth and CEM as separators.33 Membrane porosity was observed as the crucial factor in deciding the overall oxygen diffusion in the cell. Here, a direct relation with available sulfonated groups and oxygen permeability was observed. Nafion 117 with increased water uptake (∼17.1%), showed higher oxygen pervasion in comparison to SPVdF-coated and laminated membranes. The reason was attributed to the reduction of straight water channels due to blocked pores by means of lamination and coating on Nafion membrane. In contrast, SPVdF-coated and laminated membranes with reduced pores and surface available –SO3H groups, showed limited mass transfer with an approximate 17% and 31% lower oxygen diffusions over pristine Nafion 117 membrane.
image file: c6ra02234k-f3.tif
Fig. 3 Oxygen diffusivity across the membranes.

Increased mass transfer limits the overall cell efficiency, as direct anolyte oxidation generates cross-potential in the system that in turn, results in energy loss and limited energy recovery from the system. SPVdF soaking and compression over Nafion 117 membrane as coat and laminate showed least mass transport, which were considered as efficient qualities to be applied in MFCs for further analysis.

Open circuit voltages (OCVs)

Three fed batch MFCs were maintained under identical experimental conditions. The air facing side of cathode was kept covered with parafilm without employing any external load initially. This allowed favourable start-up conditions in MFCs, ensuing increased potentials at respective anode and cathode terminals. With random fluctuations, an average anode and cathode potentials of −225 mV and +171 mV were observed in MFCs using Ag/AgCl as reference electrode (data not shown). Ensuing stabilization, gradual increments in MFC open circuit voltages (OCV) were observed. A respective maximum OCV of 648 ± 20 mV, 702 ± 15 mV and 748 ± 12 mV were observed in MFC-A, B and C, indicating the developed potentials at both ends (Fig. 4).
image file: c6ra02234k-f4.tif
Fig. 4 Open circuit potential of MFCs.

The corresponding lower OCV in MFC-A was attributed to the fitted Nafion 117 membrane, where its higher mass transfer resulted in direct anolyte exhaustion, leading to cross potential generation in the system. Further, this resulted in cell flooding and enhanced oxygen stoichiometry at anode that overall allowed lower OCVs in the system due to increased oxygen permeation.34 In contrast, MFC-B and C (with SPVdF-coated and laminated) were observed with higher OCVs. Comparatively, the lower mass transfer and constricted inter-space volume in SPVdF-coated/laminated membranes showed increased OCVs over Nafion 117 (in MFC-A).

Electrochemical impedance spectroscopy (EIS) analysis

Two probe configurations were employed for measuring the internal resistance (Rin) in MFCs.35 Anode was considered as working electrode, whereas cathode was connected to the reference and counter terminals. The obtained Nyquist graphs were used to calculate the specific resistive components like activation resistance, ohmic resistance (Rm-attributed to electrode resistance, membrane resistance, etc.) and concentration resistance of the whole unit (Fig. 5).
image file: c6ra02234k-f5.tif
Fig. 5 Electrochemical impedance spectroscopy (EIS) of MFCs.

Ohmic resistances (Rm), as calculated from the equivalent circuit (S2, ESI), were observed as ∼5.7 Ω, ∼9.42 Ω and ∼14.7 Ω for MFC-A, B and C respectively. Minimal ionic resistance with fitted Nafion 117 was observed in MFC-A, which was mainly due to its increased proton conduction and ion exchange capacity. Further, higher water retention in Nafion 117 allowed increased transverse ionic conduction across MEA. Significant increments in ohmic resistances were observed in MFC-B and C, revealing their higher membrane impedance with increased charge transfer hindrances. Nevertheless, it was expected, as constricted inter-space volume in SPVdF-coated and laminated membranes allowed least proton and ionic conduction, relative to higher charge transfer resistance. Comparatively, this higher internal resistance in SPVdF-coated and laminated membranes provided increased ionic hindrance in MFC-B and C, ensuing in their lower performance over naive Nafion 117 membrane.

Polarization

Despite of reduced OCV, MFC-A showed enhanced cell efficiency over other employed units, with increased voltage drops and currents. A respective maximum current of 1.07 mA, 1.03 mA and 0.99 mA were observed from MFC-A, B and C, indicating Nafion 117 progressive hike over SPVdF-coated and laminated membranes (S3, ESI). The reason was attributed to the higher proton and ionic conductivity of Nafion 117 that aided in enhanced MFC-A performance. Applying multiple resistances (107 to 10 Ω), polarization curves for individual MFCs were obtained (Fig. 6). Here, MEA was an inclusive factor, where close electrode spacing resulted in increased cell efficiency that in turn, reduced the overlaying electrolyte resistance between the electrodes.36
image file: c6ra02234k-f6.tif
Fig. 6 Polarization curves of MFCs (V – voltage, p – power density).

At higher resistances, frequent voltage drops were observed, indicating the increased activation losses in the system. This was indicative of the energy lost in initiating the charge transfer redox reaction, from microbes to the anode surface. In addition, higher voltage drops were observed at lower external resistances, indicating the electron flow ease within the circuit. In effect, MFC-A (with Nafion 117) showed a highest power and current density of 481.55 ± 27 mW m−2 and 1788.18 ± 84 mA m−2 at 251 Ω. Comparatively, a respective power and current density of 446.45 ± 21 mW m−2 & 1721.78 ± 86 mA m−2 and 413.79 ± 20 mW m−2 & 1657.57 ± 82 mA m−2 were observed from MFC-B and C. In overall, the relative higher polarity, IEC and proton conductivity of Nafion 117, showed an approximate 7% and 14% enhanced MFC-A performance over MFC-B and C. Although, the differences were marginal, the results indicated the effectiveness of SPVdF coating/lamination over Nafion 117 membrane. The obtained power output was compared with other relevant studies, to indicate the effectiveness of SPVdF coated/laminated membrane in MFC (T1, ESI). Different lower cost materials (e.g., SPEEK/PES, sulfonated PE/poly styrene-DVB) showed reduced power densities with respect to SPVdF coated/laminated membranes used here, however, other parameters like anolyte, microbes and electrode configurations (such as MEAs) were altogether different in these cases. Nevertheless, the reduced mass transfer in SPVdF coated/laminated membranes could well be enumerated as efficient membrane property that showed increased OCV with relatively comparable (with ∼7–14% lower) performance with respect to pristine Nafion 117 membrane.

Bio-electrochemical analysis

EPS (exo-polysaccharide) present on the microbial cell wall plays crucial role in its surface attachment as support. This thereby results in biofilm formation that electro-actively oxidizes substrate and allows potential development at anode. Fig. 7 shows the SEM images of predominant microbial colonies associated at electrode's surface (carbon cloth fibers), which were evidently engaged in the electrochemical oxidation of substrates. Cyclic voltammogram (CV) analysis, showed prominent redox activities at 856.5 mV (at 10.79 μA vs. ref as oxidation peak), with two distinct reduction peaks at 256.6 mV and −236.7 mV vs. ref at −10.7 μA and −7.7 μA were observed. Electron transfer from biofilm to electrode indicated microbial oxidation, whereas reduction peaks corresponded towards the microbial reduction (charge transfer from electrode to biofilm). This redox activity was attributed to the microbial cell surface proteins that evidently ensured its biocatalytic activity, resulting in subsequent substrate utilization from the employed Firmicutes on repeated potential cycling (S4, ESI).
image file: c6ra02234k-f7.tif
Fig. 7 SEM images of bio-films at electrode surface.

Substrate removal analysis

To analyze the relative substrate exhaustions (as anolyte), chemical oxygen demand (COD) removals were measured periodically in the system. Fig. 8 depicts the respective % COD removals in MFCs in 30 days run. A respective COD removal of ∼93.97%, ∼90.27% and ∼84.15% were observed in MFC-A, B and C, where these variations were primarily indicative of the employed membranes in the unit. Increased substrate exhaustion in MFC-A corresponded with its enhanced cell performance, as Nafion 117 bestowed highest polarity amongst all fitted membranes.
image file: c6ra02234k-f8.tif
Fig. 8 COD removal from MFCs.

However, despite of its relatively enhanced proton conductive and ion exchange capacity, lower coulombic efficiency (CE) was observed in MFC-A over SPVdF-coated and laminated membranes (Fig. 9).


image file: c6ra02234k-f9.tif
Fig. 9 Coulombic efficiency of the membranes.

The reason was the reduced oxygen diffusion in SPVdF-coated and laminated membranes that resulted in higher coulombic efficiencies in MFC-B and C. Generally, COD removal is largely influenced by the employed microbes and it is necessary to keep them electrogenetically active without oxygen intrusion. Here, air cathode influenced the cell efficiency with configured cell electrodes, as MEA reduces the cell overall impedance with sustained energy recovery from the system.37,38 Direct substrate exhaustion showed higher COD removal, but lower CE in Nafion 117, establishing an inverse relation between COD removal and CE in MFCs. A clear reduction of approx. ∼1–2% CE was observed in Nafion 117 over SPVdF coated and laminated Nafion 117 membranes. The generated cross potentials showed lower CE in MFC-A with relatively higher COD removal because of its increased mass transfer through Nafion 117 membrane. In contrast, SPVdF-coated and laminated Nafion 117 membranes with lower oxygen diffusion showed higher coulombic efficiency (CE) over pristine Nafion 117 membrane. Minimal ionic conduction resulted in lower current extracts with higher cell impedance in MFC-B and C but, the reduced oxygen diffusion across SPVdF-coated and laminated membranes enhanced its OCV and relative CE, in comparison to Nafion 117 membrane.

Microbial sustenance gets adversely affected with other fermentative and methanogenic reactions that predominate in the system. This further aids in limiting microbial metabolism with increased oxygen diffusion.39–43

Nevertheless, microbial adequacy with successive COD removals corresponded with the energy performance of the units, where SPVdF laminated/coated Nafion 117 membrane showed highest energy recovery (in terms of CE) from the system. In addition, this lower mass transfer and comparable power generation ability enabled them as promising coat/laminate separator for harvesting increased energy from bio-electrochemical systems.

Materials and methods

General conditions

All chemicals used were of analytical and biochemical grade. PVdF (Avg. Mw – 530[thin space (1/6-em)]000) and Nafion resin were obtained from Sigma Aldrich. Chlorosulfonic acid was bought from Merck Millipore, India. Under strict sterile conditions, all microbial experiments were performed.

Preparation of membranes

PVdF sulfonation. PVdF granules (3 g) were sulfonated using chlorosulfonic acid as sulfonating agent at 60 °C for 2 h.30 The resulting dark brown pellets (on sulfonation) were neutralized with 1,2-dichloroloethane and rinsed thoroughly with de-ionized water. Further, this was dissolved at NMP at 80 °C and casted as sulfonated PVdF (SPVdF) membranes.

The obtained pure and sulfonated SPVdF membranes were subjected for Fourier transform infra red spectroscopy (FT-IR), for reference. Degree of substitution (DS) as calculated from IR peak intensities were calculated from the characteristic X[thin space (1/6-em)]:[thin space (1/6-em)]Y peak ratios.24

Coating of SPVdF on Nafion 117 membrane. The dissolved sulfonated PVdF solution was used to coat Nafion 117 membrane. Nafion 117 was dipped in viscous SPVdF solution for 15 minutes, followed by air drying. This was repeated 4–5 times and further allowed to soak overnight at 80 °C.
Nafion 117 lamination. The obtained sulfonated PVdF solution (10% w/v each) were used to cast two ∼50 μm thick SPVdF membranes. Further, Nafion 117 were sandwiched between the casted SPVdF membranes and hot pressed at 130 °C under 30 MPa pressure for 3 min. The resulted in a compressed SPVdF laminated Nafion 117 membrane of ∼213 μm thickness. Further, these membranes were subjected for water uptake, ion exchange and proton conductivity measurements as described earlier.44

Water uptake and swelling study

Small piece of membranes were used for water uptake (WU) and swelling ratio (SR) analysis. Water uptakes and swelling ratios were measured using the following equations:
 
Water uptake (%) = (WwetWdry) × (100)/Wdry (1)
 
Swelling ratio (%) = (TwetTdry) × (100)/Tdry (2)
where, Wwet/Twet represented the wet weight/thickness of the membranes after soaking in water for 24 h, and Wdry/Tdry were the respective dry weight/thickness of the membranes.

Ion exchange capacity (IEC)

Using the conventional titration method, ion exchange capacities (IECs) of the membranes were determined. Membranes were allowed to soak in 1 M H2SO4 solution overnight and later rinsed with DI water. The samples were again soaked in 50 mL (1 M NaCl solution) overnight, in order to allow replacement of protons with sodium ions. The remaining solution was titrated with 0.01 N NaOH solution, using phenolphthalein as indicator. The IEC value (in meq g−1) was calculated using the following equation:
 
IEC = (VNaOH) × (SNaOH)/Wdry (3)
where, VNaOH is the volume of NaOH used in the titration, and Wdry is the dry weight of the membrane in g. SNaOH is the strength of NaOH used in the experiment for determination of IEC.

Proton conductivity

To measure the conductivity of membrane, AC impedance spectroscopy was employed in transverse direction at a frequency range of 1 Hz to 105 Hz of 10 mV amplitude (Gamry Reference-600) (S5, ESI). The conductivities of the samples (σ) were calculated from the Nyquist data, using the following equation:
 
σ = T/RA (4)
where, T is the thickness of the sample, A is the cross-sectional area of the sample, R is the resistance derived from the lower intercept of the high frequency semi-circle on a complex impedance plane with the real (Z) axis.

Cell configuration

Membrane electrode assemblies (MEAs). For MEA preparation, carbon cloths (6 cm2) (Zoltek pvt. Ltd, USA) were used as electrodes, where the membranes (Nafion 117, SPVdF coated and SPVdF laminated Nafion 117) were sandwiched between carbon cloth electrodes (as anodes and cathodes). These assemblies were further hot pressed in compression moulding at 130 °C for 25 seconds at 6.84 MPa pressure. This condition was optimized for perfect assembling, as on higher ranges, the fabric became brittle and carbon cloth lost its texture. Further, a total of 3 mg cm−2 catalyst mixture of 10[thin space (1/6-em)]:[thin space (1/6-em)]90 wt% (Pt/C) with 5% Nafion resin was loaded on the cathode side of the carbon cloth by paint coating.
MFC fabrication. Three single chambered identical MFC units of 150 mL liquid volume (anode chamber) containing Nafion 117, SPVdF coated and laminated Nafion 117 membranes as MEAs were named as MFC-A, B and C respectively (S6, ESI). For oxygen reduction, the catalyst loaded air facing side of cathode was kept facing outward. Other requisite fabrications e.g. inlet/outlet sealing, electrode fixing, electrical connections etc. were done accordingly.
Oxygen diffusivity measurement. A dissolved oxygen probe (Horiba Pvt. Ltd, Kyoto Japan) was fixed in the anode chamber. In order to remove the dissolved oxygen content at anode, purified N2 gas was purged in the chamber. The mass transfer coefficient k (cm s−1), as characterized by oxygen diffusivity was calculated from cathode to anode chamber over time, using the mass balance equation
 
k1/4 = −V/At[thin space (1/6-em)]ln[CsC/Cs] (5)
where, V is the anode chamber volume, A is membrane cross-sectional area, C is the anode oxygen concentration, and Cs is cathode oxygen concentration (assumed to be the saturation concentration of oxygen in water, or 7.8 mg L−1). Oxygen diffusivity was recorded periodically (in triplicate) to monitor the diffused oxygen content in the chamber.

Microbes

DNA isolation and PCR amplification. Microbial genomic DNA isolation was done using standard phenol–chloroform method.45 Using universal primers Y1 forward (40th) 5′-TGGCTC AGAACGAACGCGGCGGC-3′ and Y2 reverse (337th) 5′-CCCACTGCTGCCTCC CGTAGGAGT-3′ 16S rRNA gene amplification was conducted in polymerase chain reaction (PCR) (Applied biosystem, US). For microbial identification, sequencing and BLAST tools were employed to allot accession numbers to the strains (EMBL accession no. HE648059, HE648060, HF548664). These were Firmicute class Lysinibacillus species that were found facultative anaerobes when tested for viability in gas pack jar.
Anolyte feed. Mixed microbial strains were suspended in 50 mM phosphate buffer (50 mL volume) and subsequently transferred to 100 mL synthetic wastewater (pH ∼ 6.9). The COD composition of the feed wastewater was 1500 ± 210 mg L−1 (total nitrogen: 117 ± 24 mg L−1, PO4-P: 27 ± 3 mg L−1, MgSO4: 45 mg L−1). A final volume of 150 mL (with microbe) anolyte was used as feed in MFCs.

Start-up and measurements

Initially, MFC units were assembled with sterilized de-ionized water at anode. This was later replaced with anolyte using peristaltic pump. Using multimeter (Keithley Instruments, Cleveland, OH, USA), and a potentiometer (G600; Gamry Instrument Inc., Warminster, PA, USA), connected to a personal computer, periodic monitoring of MFCs (at 24 h intervals) were conducted. Current (I) and potential (V) measurements were recorded after allowing the circuit to stabilize for 8–10 minutes. Power (W) was calculated using relation P = IV, where I and V represented the recorded respective current and voltages. Normalizing the power with anode surface area (6 cm2), power densities (mW m−2) of the respective MFCs were calculated.

Substrate removals were analyzed by periodically measuring the chemical oxygen demand (COD) at 420 nm (Anatech Labs India Pvt. Ltd.) in triplicate. The coulombic efficiency (CE) of the fed-batch MFCs were calculated from the following equation:

 
image file: c6ra02234k-t1.tif(6)
where ‘M’ represents the molecular weight of oxygen (M = 32), ‘F’ is Faraday's constant, ‘b’ denotes the number of electrons exchanged per mole of oxygen (b = 4), ‘Van’ is the liquid volume in anode, and ΔCOD is the change in the chemical oxygen demand over time t.44

Electrochemical impedance spectroscopy (EIS)

In order to measure the internal resistance of the units, potentiostatic EIS at a frequency range of 103 kHz to 1 MHz were performed employing 10 mV AC voltage. The internal resistances (Rin) were determined from the plotted Nyquist graphs of all MFCs.35

Cyclic voltammetry (CV)

To assess microbial electrochemical activity, cyclic voltammograms at a scan rate of 1–2 mV s−1 were analyzed (G600; Gamry Instrument, USA). Three electrode setup containing, anode as the working, cathode as the counter, and Ag/AgCl as reference electrode were used. Reference electrode (Ag/AgCl) was placed near anode terminal to minimize iR drop at solution–electrode interface. To ensure microbial activity, control experiments (without microbes) were conducted separately.

Scanning electron microscopy (SEM)

For SEM analysis, biofilms were fixed on the electrode using 2.5% glutaraldehyde with 0.1 M phosphate buffer solution. Subsequently, further dehydration with 30–100% ethanol was done following sputter coating the samples under vacuum with thin gold layer.44 To analyze microbial adhesion at electrode's surface, scanning electron microscope (Carl Zeiss EVO® 18 electron microscope) were employed with an acceleration voltage of 15 kV.

Conclusion

In summary, modification of Nafion 117 with sulfonated PVdF membranes as coat and laminates were conducted in order to minimize the increased mass transfer across pristine Nafion membrane. In comparison to Nafion 117, approximately ∼31% reduced oxygen diffusions in coated/laminated membrane were observed. When compared as MEA, this reduced mass transfer contributed towards increased OCVs in MFCs using mixed electrogenic Firmicutes as biocatalysts. However, the power outputs were slightly lower which was obvious due to the increased polarity of naive Nafion 117 that ensued minimal ionic hindrance but, higher oxygen diffusion over coated/laminated SPVdF membranes. Comparing the performance, approximately 7–14% reduced power outputs were observed in SPVdF coated/laminated membranes over pure Nafion membrane. Despite these reductions, SPVdF coated/laminated membranes showed increased coulombic efficiencies (approx ∼1–2%) over Nafion 117 membrane. The reason was attributed to their reduced mass transfer that prevented direct anolyte exhaustion at anode. In effect, with reduced cross potentials, a maximum power and current density of 446.45 ± 21 mW m−2 & 1721.78 ± 86 mA m−2 and 413.79 ± 20 mW m−2 & 1657.57 ± 82 mA m−2 were observed in SPVdF coated/laminated membranes, indicating its efficiency as comparable to pristine Nafion 117 membrane in usage. MFC being a future application, demands more profound investigations in such diversified areas of membrane technology for practical higher efficient alternatives.

Conflict of interest

Authors declare no competing financial interest.

Acknowledgements

The financial research aid provided from Council of Scientific and Industrial Research (CSIR) and Department of Science and Technology (DST), Govt. of India is duly acknowledged.

References

  1. D. L. Hoskins, X. Zhang, M. A. Hickner and B. E. Logan, Bioresour. Technol., 2014, 172, 156–161 CrossRef CAS PubMed.
  2. Y. Hou, K. Li, H. Luo, G. Liu, R. Zhang, B. Qin and S. Chen, Environ. Sci. Eng., 2014, 8, 137–143 CAS.
  3. H. P. Bennetto, J. L. Stirling, K. Tanaka and C. A. Vega, Biotechnol. Bioeng., 1983, 25, 559–568 CrossRef CAS PubMed.
  4. R. M. Allen and H. P. Bennetto, Appl. Biochem. Biotechnol., 1993, 39, 27–40 CrossRef.
  5. M. Ghasemi, W. R. W. Daud, S. H. A. Hassan, S. E. Oh, M. Ismail, M. Rahimnejad and J. M. Jahim, J. Alloys Compd., 2013, 580, 245–255 CrossRef CAS.
  6. H. Zhang and P. K. Shen, Chem. Rev., 2012, 112, 2780–2832 CrossRef CAS PubMed.
  7. J. Yang, P. K. Shen, J. Varcoe and Z. Wei, J. Power Sources, 2009, 189, 1016–1019 CrossRef CAS.
  8. L. A. Diaz, G. C. Abuin and H. R. Corti, J. Membr. Sci., 2012, 411–412, 35–44 CrossRef CAS.
  9. L. A. Neves, J. Benavente, I. M. Coelhoso and J. G. Crespo, J. Membr. Sci., 2010, 347, 42–52 CrossRef CAS.
  10. S. Ayyaru, P. Letchoumanane, S. Dharmalingam and A. Stanislaus, J. Power Sources, 2012, 217, 204–208 CrossRef CAS.
  11. S. Ayyaru and S. Dharmalingam, Bioresour. Technol., 2011, 102, 11167–11171 CrossRef CAS PubMed.
  12. K. Y. Cho, J. Y. Eom, H. Y. Jung, N. S. Choi, Y. M. Lee, J. K. Park, J. H. Choi, K. W. Park and Y. E. Sung, Electrochim. Acta, 2004, 50, 583–588 CrossRef CAS.
  13. J. Wootthikanokkhan and N. Seeponkai, J. Appl. Polym. Sci., 2006, 102, 5941–5947 CrossRef CAS.
  14. W. H. Choi and W. H. Jo, J. Power Sources, 2009, 188, 127–131 CrossRef CAS.
  15. K. Y. Cho, H. Y. Jung, K. A. Sung, W. K. Kim, S. J. Sung, J. K. Park, J. H. Choi and Y. E. Sung, J. Power Sources, 2006, 159, 524–528 CrossRef CAS.
  16. H. J. Kim, H. J. Kim, Y. G. Shul and H. S. Han, J. Power Sources, 2004, 135, 66–71 CrossRef CAS.
  17. K. Dutta, S. Das, P. Kumar and P. P. Kundu, Appl. Energy, 2014, 118, 183–191 CrossRef CAS.
  18. C. W. Lin, R. Thangamuthu and C. J. Yang, J. Membr. Sci., 2005, 253, 23–31 CrossRef CAS.
  19. P. Kumar, S. K. Jagwani and P. P. Kundu, Materials Today Communications, 2015, 2, e1–e8 CrossRef.
  20. F. Liu, N. A. Hashim, Y. Liu, M. R. M. Abed and K. Li, J. Membr. Sci., 2011, 375, 1–27 CrossRef CAS.
  21. P. Kumar, K. Dutta and P. P. Kundu, Int. J. Energy Res., 2014, 38, 41–50 CrossRef CAS.
  22. P. P. Kundu, B. T. Kim, J. E. Ahn, H. S. Han and Y. G. Shul, J. Power Sources, 2007, 171, 86–91 CrossRef CAS.
  23. M. K. Song, Y. T. Kim, J. F. Fenton, H. R. Kunz and H. W. Rhee, J. Power Sources, 2003, 117, 14–21 CrossRef CAS.
  24. S. Das, P. Kumar, K. Dutta and P. P. Kundu, Appl. Energy, 2014, 113, 169–177 CrossRef CAS.
  25. S. Slade, S. A. Campbell, T. R. Ralph and F. C. Walsh, J. Electrochem. Soc., 2002, 149, A1556 CrossRef CAS.
  26. C. Heitner-Wirguin, J. Membr. Sci., 1996, 120, 1 CrossRef CAS.
  27. D. Xu, G. Zhang, N. Zhang, H. Li, Y. Zhang, K. Shao, M. Han, C. M. Lew and H. Na, J. Mater. Chem., 2010, 20, 9239–9245 RSC.
  28. C. Zhao, H. Lin, Q. Zhang and H. Na, Int. J. Hydrogen Energy, 2010, 35, 10482–10488 CrossRef CAS.
  29. M. K. Song, Y. T. Kim, J. F. Fenton, H. R. Kunz and H. W. Rhee, J. Power Sources, 2003, 117, 14–21 CrossRef CAS.
  30. P. Kumar and P. P. Kundu, Electrochim. Acta, 2015, 173, 124–130 CrossRef CAS.
  31. J. D. Jeon and S. Y. Kwak, J. Phys. Chem. B, 2007, 111, 9437–9443 CrossRef CAS PubMed.
  32. S. Moghaddam, E. Pengwang, Y. B. Jiang, A. R. Garcia, D. J. Burnett, C. J. Brinker, R. I. Masel and M. A. Shannon, Nat. Nanotechnol., 2010, 5, 230–236 CrossRef CAS PubMed.
  33. X. Zhang, S. Cheng, X. Wang, X. Huang and B. E. Logan, Environ. Sci. Technol., 2009, 43, 8456–8461 CrossRef CAS PubMed.
  34. P. Kumar, K. Dutta and P. P. Kundu, Int. J. Energy Res., 2014, 38, 41–50 CrossRef CAS.
  35. Z. He and F. Mansfeld, Energy Environ. Sci., 2009, 2, 215–219 CAS.
  36. A. ElMekawy, H. Hegab, X. Dominguez-Benetton and D. Pant, Bioresour. Technol., 2013, 142, 672–682 CrossRef CAS PubMed.
  37. V. Kumar, A. Nandy, S. Das, M. Salahuddin and P. P. Kundu, Appl. Energy, 2015, 137, 310–321 CrossRef CAS.
  38. R. Rudra, V. Kumar and P. P. Kundu, RSC Adv., 2015, 5, 83436–83447 RSC.
  39. A. ElMekawy, H. Hegab and D. Pant, Energy Environ. Sci., 2014, 7, 3921–3933 CAS.
  40. B. Min, J. Kim, S. Oh, J. M. Regan and B. E. Logan, Water Res., 2005, 39, 4961–4968 CrossRef CAS PubMed.
  41. Z. He, S. D. Minteer and L. T. Angenent, Environ. Sci. Technol., 2005, 39, 5262–5267 CrossRef CAS PubMed.
  42. J. Greenman, A. Gálvez, L. Giusti and I. Ieropoulos, Enzyme Microb. Technol., 2009, 44, 112–119 CrossRef CAS.
  43. J. J. Fornero, M. Rosenbaum and L. T. Angenent, Electroanalysis, 2010, 22, 832–843 CrossRef CAS.
  44. V. Kumar, P. Kumar, A. Nandy and P. P. Kundu, RSC Adv., 2015, 5, 30758–30767 RSC.
  45. A. Ghosh, B. Maity, K. Chakrabati and D. Chattopadhyay, Microb. Ecol., 2007, 54, 452–459 CrossRef PubMed.

Footnote

Electronic supplementary information (ESI) available. See DOI: 10.1039/c6ra02234k

This journal is © The Royal Society of Chemistry 2016
Click here to see how this site uses Cookies. View our privacy policy here.