Mathematical methods on atomic force microscope cantilever systems

Kanes Sumetpipata, Duangkamon Baowan*a, Barry J. Coxb and James M. Hillc
aDepartment of Mathematics, Faculty of Science, Mahidol University, Centre of Excellence in Mathematics, CHE, Rama VI Rd., Si Ayutthaya Rd, Bangkok 10400, Thailand. E-mail: duangkamon.bao@mahidol.ac.th
bSchool of Mathematical Sciences, The University of Adelaide, Adelaide, SA 5005, Australia
cSchool of Information Technology and Mathematical Sciences, University of South Australia, Mawson Lakes, South Australia 5095, Australia

Received 24th January 2016 , Accepted 4th May 2016

First published on 5th May 2016


Abstract

The ever increasing demand to analyse substrates means that an improved theoretical understanding is necessary for atomic force microscope cantilevers. In this study, we utilize fundamental mathematical modelling, comprising the Lennard-Jones potential and techniques involving the calculus of variations, to obtain the energy equations arising from the probe and the substrate, leading to the deflection equations of the cantilever. Here we assume a silicon tip and the substrate surface is assumed to be a graphene sheet. Based on an energy calculation, the most stable system occurs where the probe is 0.206 nm away from the substrate, and this value exists independently of the size and tilt angle of the probe. For the deflection of the cantilever, we apply the calculus of variations to the separate domains, considering derivatives up to third order at the connection point. The deflection behaviour of a V shaped plate depends primarily on its length, and the spring constants of various cantilevers are calibrated from the deflection equations. In comparison to the zeroth order method of previous studies, our method predicts a 30–50% difference in the value of their spring constants. Moreover, we observe the bending behaviour of cantilever systems by considering the energy between the probe and the substrate together with the bending energy in the cantilever, and we find that the maximum bending distance at the tip is in the range between 0.09 nm and 0.2 nm.

1 Introduction

Atomic force microscope (AFM) cantilevers can be used to measure the properties of substrate surfaces in the nanometer to micrometer range, and are becoming increasingly adopted in many diverse areas requiring an ever increasing accuracy. The operating modes of AFM cantilevers can be divided into three main categories which are the contact mode, the tapping mode, and the non-contact mode, and each mode has different advantages and applications. AFM cantilevers may be used to scan either rigid bodies, or liquid surfaces, or biological materials and can clarify shapes and response characteristics in various environments. For example, Kasas et al.1 use an AFM in biological systems to investigate the RNA, collagen fiber, virus and kidney cells, and Franz et al.2 employ an AFM to study the mechanics of cell adhesion.

There have been numerous investigations on AFM cantilever properties.3 The most important aspect of any AFM cantilever is the accuracy of the measurements involving elasticity, geometric shape, temperature, spring constant including adhesive force, type of substrate and the loading position. To obtain this data and minimize any errors in measurement, many interesting techniques have been proposed, such as uncertainty analysis, focused curve analysis, focused ion beam with spatial marker, where the shape of the cantilever and the tip, and the spring calibration constant are the two main aspects of the investigations.4–7 Sader et al.8 propose a theoretical model to determine the spring constant for isosceles trapezoidal and V-shaped thin plates. Based on the well-known elastic strain equations for an arbitrary thin plate,9 these authors derive the deflection equations for such cantilevers. The deflection equations are solved using a zeroth order method and a second order method where the former method assumes a solution in one variable. Their results show that both methods give similar results in determining the spring constant and they are in a good agreement as compared to a finite element calculation. Moreover, their second order method can also be used for more general cantilever geometries.

Cleveland et al.10 also derive the spring constant for AFM cantilevers, and measure the resonant frequency of tungsten spheres with different masses with a force loading at the end. The spring constants obtained in their study are in agreement with the theoretical result shown in.11 Sader et al.12 analyze the effect of air damping and the cantilever position where the force is applied, and the spring constant obtained after considering the air damping term shows excellent agreement with Cleveland et al.10 Sader et al.12 comment that the cantilever thickness and the gold coating also affect the observed frequency.

Besides direct calculation of the spring constant, a number of researchers consider torsional spring constants, because AFM cantilevers might be acted upon by lateral forces during their operation. Green et al.13 extend the solutions of Sader et al.14 and Cleveland et al.10 to find such torsional spring constants. Hoogenboom et al.15 employ the Fabry–Perot interferometer together with the cantilever to scan the surface of aqueous or liquid environments by considering thermal noise and the frequency of the silicon cantilever. Fukuma et al.16 develop a cantilever system that is more sensitive to the noise so that it can be applied in diverse environments.

Cai et al.17 design the shape of cantilevers to achieve a wide range of frequencies so that small changes in the cantilever probe can be detected. Stevens et al.18 utilize the nanotube as a probe and report that the image resolution of the general silicon tip and nanotube tip are similar. Further, the nanotube can give better accuracy of the image height than the general silicon tip. There are also other studies that calibrate the spring constant and propose new techniques for cantilever use and we direct the interested reader to the following studies.19–28

Even though the literature contains many results from experiments on AFM cantilevers, further analytical and theoretical methods are required to better explain the function of the cantilevers. In this work, we study the cantilever system by employing classical mathematical modelling techniques to calculate forces and energies of the system, and involving two procedures. Firstly, we discuss the energy between the probe and the surface that is being scanned. Assuming only van der Waals forces, we utilize the Lennard-Jones potential to determine the energy of the system, where the probe is assumed to be a conical shape, and the surface is modelled as an infinite flat plane. Secondly, we discuss the bending of the cantilever to calculate the potential energy including its spring constant. The cantilever geometry considered in this work is the isosceles trapezoidal shape both with and without an isosceles trapezoidal hole. We then combine the results of these two calculations to determine the total energy of the system.

The calculation of the interaction between the probe and the surface and the calculation of the deflecting cantilever are presented in Section 2. Additionally, the basic formulae for the molecular interactions and the calculus of variations formulae are also detailed in this section. Results for the mechanical system for the AFM cantilever are discussed in Section 3, and finally, we give some concluding remarks in Section 4.

2 Mathematical derivations

2.1 Interaction between tip and surface

We employ a Lennard-Jones potential to determine the energy between two non-bonded molecules. The Lennard-Jones potential may be expressed in two equivalent forms
image file: c6ra02126c-t1.tif
where ε is the well depth, σ is the van der Waals diameter and ρ is the distance between atoms. We note that, A = 4εσ6 and B = 4εσ12 are the attractive and repulsive constants, respectively. For two different atoms, we employ the empirical mixing rules for ε and σ which are ε = (ε1ε2)1/2 and σ = (σ1 + σ2)/2, where the numerals 1 and 2 refer to the two atomic species. For two molecules, the total energy can be obtained by summing all atomic pairs from the two molecules. However, the number of atoms in the systems considered in this paper are very large and we calculate the total energy via a continuous approximation assuming that the atoms are uniformly distributed over the materials. Hence, the total interaction energy may be approximated as an integral
image file: c6ra02126c-t2.tif
where η1 and η2 are the mean surface or the mean volume densities of the materials, and S1 and S2 are the surface or volume elements.
2.1.1 Interaction between a point and a plane surface. We start by calculating the energy between a point and a plane surface. The surface is assumed to be an infinite plane and located at z = 0. The distance between the point and such a plane is denoted by ω, and the coordinates of the point are (0, 0, ω) as shown in Fig. 1. Thus, the total interaction energy has the form
image file: c6ra02126c-t3.tif
which we write as
image file: c6ra02126c-t4.tif
where ηp is the mean surface density of the plane, and
image file: c6ra02126c-t5.tif

image file: c6ra02126c-f1.tif
Fig. 1 Configuration of point and plane surface.

We make the substitution image file: c6ra02126c-t6.tif to obtain

image file: c6ra02126c-t7.tif
where B(m, n) is the beta function, and then let y = ω[thin space (1/6-em)]tan(ψ) to deduce
 
image file: c6ra02126c-t8.tif(1)
so that we have
image file: c6ra02126c-t9.tif

2.1.2 Interaction between a cone and a plane surface. Next, we consider the energy between a cone and a plane surface as illustrated in Fig. 2. We assume that the right-circular cone is given by the equation,
image file: c6ra02126c-t10.tif

image file: c6ra02126c-f2.tif
Fig. 2 Configuration of right cone and plane surface.

Assume also that is the plane is located below the vertex of the cone at a distance ε, so that the distance between any point of the cone located on the z-axis and the plane is ω = z + ε. The cone base area that is parallel to the plane at a height ω = z + ε has the area Az = πk2z2, and the cone angle is denoted by α, so tan(α/2) = k. Let the integral Jn be defined by

image file: c6ra02126c-t11.tif
where In is defined by (1), then we may deduce
Ecp = ηpηc(−AJ3 + BJ6).

For the right cone, we may have

image file: c6ra02126c-t12.tif

The tilted cone system can be established by rotating the right cone through an angle θ as shown in Fig. 3, so that we have

xN = x, yN = y[thin space (1/6-em)]cos[thin space (1/6-em)]θz[thin space (1/6-em)]sin[thin space (1/6-em)]θ, zN = y[thin space (1/6-em)]sin[thin space (1/6-em)]θ + z[thin space (1/6-em)]cos[thin space (1/6-em)]θ.


image file: c6ra02126c-f3.tif
Fig. 3 Configuration of tilted cone and plane surface.

From the equation for a right cone, we substitute the relations for x, y and z to obtain

(x/k)2 + [(y[thin space (1/6-em)]cos[thin space (1/6-em)]θz[thin space (1/6-em)]sin[thin space (1/6-em)]θ)/k]2 = (y[thin space (1/6-em)]sin[thin space (1/6-em)]θ + z[thin space (1/6-em)]cos[thin space (1/6-em)]θ)2,
from which we may deduce
(x/k)2 + Gy2Hy = F,
where
image file: c6ra02126c-t13.tif

The equation for the tilted cone may be written in the elliptic form given by

image file: c6ra02126c-t14.tif
where W = (F/G) + (H2/4G2). Thus, the cone base area parallel to the plane at location z is image file: c6ra02126c-t15.tif, and we write image file: c6ra02126c-t16.tif, that image file: c6ra02126c-t17.tif, and
image file: c6ra02126c-t18.tif

Similarly for the case of the right cone, the integral Jntilt becomes

image file: c6ra02126c-t19.tif
and Jn(θ→0)tiltJnright. We define εmin to be the equilibrium distance ε that gives the minimum energy, and both the right cone and the tilted cone systems yield εmin = [B/(30A)]1/6 where A and B are the attractive and repulsive Lennard-Jones constants, respectively.

2.2 Calculus of variations method on cantilever plate

Functionals involving the derivatives of higher order have the form
image file: c6ra02126c-t20.tif
where the integrand F involves derivatives of order n with respect to x. On using the variational calculus, the Euler–Lagrange equation can be obtained as,
image file: c6ra02126c-t21.tif
the general solution of this equation has 2n arbitrary constants which are obtained from the 2n boundary conditions,
y(x0) = y0, y′(x0) = y0,…,y(n−1)(x0) = y0(n−1),
and this solution provides an extremum for the functional v(y(x)).
2.2.1 Deflection equations. The approximate potential energy V for an arbitrary cantilever plate may be given by
image file: c6ra02126c-t22.tif
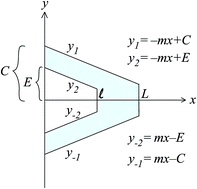
where w(x, y) is a deflection function, D = E*t3/[12(1 − ν2)] with Young's modulus E*, the thickness t, and Poisson's ratio ν. The boundary conditions of this cantilever are w(0, y) = 0, wx(0, y) = 0, w(L, y) = δ, wxx(L, y) = 0 and wy(0, y) = 0, where δ denotes the bending distance of the cantilever. The configuration of the cantilever is as shown in Fig. 4. We assume w to depend only on x, w(x), which is assumed to satisfy the prescribed condition on wy(0, y) and the potential energy function becomes
 
image file: c6ra02126c-t23.tif(2)

image file: c6ra02126c-f4.tif
Fig. 4 Cantilever configuration, where y1, y2, y−1 and y−2 are linear functions for outside and inside isosceles trapezoid's edges, ±m are slope of edges, C and E are shown widths, and L and [small script l] are shown lengths.

From the Euler–Lagrange equation of second order

image file: c6ra02126c-t24.tif
and from the first integral of (2), we may deduce
 
w(x) = T3x3 + T2x2 + T1x + T0, (3)
where T0, T1, T2 and T3 are constants, and 0 ≤ x[small script l]. Next, by using the Euler–Lagrange equation again for the second integral term in (2), we find
 
w(4)(x) − 2w′′′(x)/(ξx) = 0, (4)
where ξ = C/m. On solving (4) using the integrating factor to give w′′′(x) = λ/(ξx)2, we have
 
w(x) = λ(ξx)(log|ξx| − 1) + K2x2 + K1x + K0, (5)
where λ, K0, K1 and K2 are all constants, and 0 ≤ x[small script l].

Next, we use the boundary conditions to find the unknown constants. Considering w(0) = 0 and w′(0) = 0 in (3) shows that T0 = T1 = 0, and the solution becomes

 
w(w) = T3x3 + T2x2. (6)

The other two conditions, w(L) = δ and w′′(L) = 0, are now applied to (5) to obtain

 
δ = λ(ξL)(log|ξL| − 1) + K2L2 + K1L + K0, (7)
 
K2 = −λ/[2(ξL)]. (8)

We now need to find the constants K0, K1, T2 and T3 assuming that the function w(x) at x = [small script l] is continuous and smooth up to the third derivative; which means, w([small script l]), w′([small script l]), w′′([small script l]) and w′′′([small script l]) from (5) and (6) must coincide, and the four equations are

 
T3[small script l]3 + T2[small script l]2 = λ(ξ[small script l])(log|ξ[small script l]| − 1) + K2[small script l]2 + K1[small script l] + K0, 3T3[small script l]2 + 2T2[small script l] = −λ[thin space (1/6-em)]log|ξ[small script l]| + 2K2[small script l] + K1, 6T3[small script l] + 2T2 = λ/(ξ[small script l]) + 2K2, T3 = λ/[6(ξ[small script l])2]. (9)

From (7)–(9), both solutions from (5) and (6) may be given by

 
image file: c6ra02126c-t25.tif(10)
 
image file: c6ra02126c-t26.tif(11)
where
image file: c6ra02126c-t27.tif
and where ξ = C/m.

2.2.2 Energy and spring constant. The spring constant, kw, is calculated from the energy per unit area. Here, the force is assumed to be applied to the end of the probe and the distance is taken to be w(L) which we denote by δ. Thus,
image file: c6ra02126c-t28.tif
where V is defined by (2).

3 Results and discussion

The present section is divided into three subsections. In the first subsection, we discuss the interaction between the cone and the plane. Then we consider the bending behaviour of the cantilever system using the calculus of variations, and finally, we combine the two to model the mechanical cantilever system.

3.1 Interaction between cone and plane

Here we assume the cone or the tip to be made from silicon whereas the plane surface is assumed to be a graphene sheet. We choose graphene as an example because our approach assumes a two-dimensional flat surface. Moreover, graphene is a very stable nanomaterial, for which there is little chance to form chemical bonding with the molecules on the tip, and the interaction forces are dominated only by the van der Waals interactions. The constant values A = 7.8497 J nm6 mol−1 and B = 0.0179 J nm12 mol−1 in Lennard-jones potential are obtained from the silicon and carbon data in Rappé et al.,29 and the value of the density ηC = 38.12 nm−2 is taken from Cox et al.30 The volume density of silicon is obtained by converting the units from kilogram per cubic meter to atom per cubic nanometer, and ηSi = 49.977 nm−3. In this section, we examine the energy between the cone and the plane surface Ecp and the equilibrium distance εmin for various cones is deduced.

From Fig. 5, the energy of the system becomes positive when the vertex of the cone becomes close to the graphene plane. The systems are unstable when ε is less than 0.149 nm, and the equilibrium distance is obtained as εmin = 0.206 nm. Our results show that the cone vertex experiences a strong repulsive force, whereas the bulk of the cone makes a much smaller contribution to the energy. Fig. 6 shows that the larger the cone angle α, the lower the energy. In other words, more atoms on the cone give rise to a larger interaction force between the cone and the plane. The smallest cone (α = π/16 or 11.25°) gives rise to an energy of −1.65 × 10⁻²¹ J while the largest one (α = π/4 or 45°) gives rise to an energy of −29.19 × 10⁻²¹ J.


image file: c6ra02126c-f5.tif
Fig. 5 Energy of right circular cones for various cone angles α = π/16, π/10, π/6 and π/4.

image file: c6ra02126c-f6.tif
Fig. 6 Relation between energy of right cone and cone angle α at equilibrium distance εmin = 0.206 nm.

The tilted cone system behaves similarly in terms of the ε value. However, in Fig. 7, the system which has a larger rotational angle θ will have a lower energy. Moreover, the value of εmin for the tilted cone system is the same as that for the right cone case, that is, 0.206 nm because θ + α/2 is not much greater than π/2. This means that the closest point between the cone and the plane is at the tip, and therefore the most important parameter is the interspacing ε. We note that the energy of the right cone system can also be obtained from the tilted cone case by using Jn(θ→0)tilt. Fig. 8 shows the possible lowest energy of the tilted cone for any θ. From the graph, the cone with α = π/16 has a difference in energy around 10 × 10−21 J on rotating θ by 1 rad, whereas the cone with α = π/4 has an energy difference of around 30 × 10−21 J corresponding to rotating θ through 0.6 rad.


image file: c6ra02126c-f7.tif
Fig. 7 Energy of tilted cone for various cone angles α = π/16, π/16, π/6 and π/4.

image file: c6ra02126c-f8.tif
Fig. 8 Energy of tilted cone for εmin = 0.206 nm and α = π/16, π/10, π/6 and π/4.

3.2 Bending of cantilever

In this section, we consider a triangular cantilever with a triangular hole shape (V shape) in order to compare our results with the results of earlier studies. This means that the slope m = C/L = E/[small script l] as shown in Fig. 4. Additionally, w1(x) and w2(x) from (10) and (11) approach a parabolic function δx2/L2. First of all, we consider the bending behaviour of four cantilevers as shown in Table 1 which are those considered by Sader et al.12 Here, we focus on comparing the predicted values of the spring constants, and we also discuss the spring constant values obtained by the zeroth order method and by our method.
Table 1 Size of cantilevers used in this paper, Dν=0.25 = 0.3029 × 10⁻⁸ J
  L (μm) [small script l] (μm) C (μm) E (μm) m
Type 1 182 107.2 91 53.6 0.5
Type 2 176 139.46 79 62.6 0.4489
Type 3 89.2 61.34 45.15 31.05 0.5062
Type 4 89.4 41.54 45.2 21 0.5056


The bending distance of Type 4 cantilever, δType 4, is calculated from the bending distance of Type 1 cantilever, δType 1, with the conditions that the deflection distance w(x) is equal (see Fig. 9) and the energy is equal (see Fig. 10). Further, we examine two values of δType 1 which are 0.4 nm and 0.5 nm. We note that these two values of the bending distances are very small compared with the length of cantilever L, and the bending distance δ measured vertically in the x-direction.


image file: c6ra02126c-f9.tif
Fig. 9 Behaviour of bending plates of Type 1 and Type 4 cantilevers for equivalent deflection distance and comprising two different examples: δType 1 = 0.4 nm for τ1 and δType 1 = 0.5 nm for τ2. Note that units of x-axis are micrometers while units of y-axis are nanometers, (dashed line: Type 1 and solid line: Type 4).

image file: c6ra02126c-f10.tif
Fig. 10 (left) Behaviour of bending plates of Type 1 and Type 4 cantilevers for equivalent energy comprising two different examples: δType 1 = 0.4 nm for τ1 and δType 1 = 0.5 nm for τ2. Assuming units of x-axis are micrometers while units of y-axis are nanometers. (right) Gradient at the end of bending cantilever, (dashed line: Type 1 and solid line: Type 4).

From (10) and (11), our bending behaviour does not depend on D. So, even for different materials, the same bending profiles (Fig. 9 and 10) will be obtained converging to the parabolic profile δx2/L2. Furthermore, our solutions approach δx2/L2 indicating that the bending behaviour is the same when C and E are different. Moreover, [small script l] does not appear in the parabolic solution, that is, the equivalent V-shaped cantilevers with and without holes give the same bending behaviour. This is because our approach ignores the variable y, which is acceptable if twisting or distortions do not occur in the y-direction.8 The major factor on the bending behaviour is the length of the cantilever L. From Fig. 9, the bending behaviour of Type 1 and Type 4 cantilevers are similar but the parabolae have different deflection magnitudes. In Fig. 10 (left), there is more interesting behaviour showing that Type 1 cantilevers bend more than Type 4 cantilevers with the same energy in the two systems. The ratio of the bending distance between Type 1 and Type 4 cantilevers δType 4/δType 1 is 0.4458 at the equivalent energy condition. We may infer that a longer cantilever bends more than a shorter one, as expected. Additionally, when we compare the gradient between Type 1 and Type 4 cantilevers as shown in Fig. 10 (right), Type 1 cantilever has the larger gradient as compared to that of Type 4, and therefore, Type 1 would require a larger bending angle θ.

Next, we consider the spring constants, k, presented in Table 2, where kclv is obtained by Cleveland et al.,10 ksd is taken from Sader et al.,12 while kz is obtained by the zeroth order method given in (ref. 8) and kw is that obtained in this study. We find that kz is greater than kclv and ksd, while kw is less than kclv and ksd for all four types of cantilevers. The differences are due to the different calculations, and as shown in (ref. 12) who discuss the effect of air damping and loading position which also affect the spring constant. We comment that from Table 2, the value of kz is larger than the value of kw by approximately 30–50%. However, Sader et al. state that their spring constant kz differs by 13%,8,14 and when we decrease our kw values by 13%, kw differs from kclv and ksd by approximately 25–36%. This predicted difference is still large for a nano-scaled system where an angstrom change will make a major difference to the overall system.

Table 2 Spring constants obtained by four methods, kclv is taken from (ref. 10), ksd is given in (ref. 12), kz is formulated by the zeroth order method presented in (ref. 8), and kw is obtained in this work. We use Dν=0.25 = 0.3029 × 10⁻⁸ J for kz and kw
  kclv ksd kz kw
Type 1 0.091 0.092 0.102 0.06
Type 2 0.044 0.044 0.05 0.033
Type 3 0.28 0.29 0.333 0.203
Type 4 0.46 0.47 0.536 0.301


In Fig. 11, we use A′ = 2C/L to indicate the different types of cantilevers and r = (CE)/2C to represent the distance in the x-axis, in order to mimic the situation shown in Fig. 7 of Sader and White.8 Fig. 11 shows that kw is 30–50% different from kz as obtained in,8 but for small values of r, kw and kz are comparable. However, the value of krel = kw/kz is as much as 0.5 for a larger value of r, and it gives a difference of approximately 50%. Moreover, the relation between krel and r does not depend on A′. We believe that the differences between the two methods occurs because the potential energy equation is assumed to have only a force applying at the end of the tip and does not have any boundary edge forces. Our method also predicts bending of the plate smoothly up to the third order derivatives at x = l. So, the curvature the cantilever does not arise and is assumed to be small in the zeroth order method. For the case of Poisson's ratio ν = 0.25, the differences are also approximately 30–50%. Moreover, krel is around 0.53 when r is very large. In comparison with Fig. 7 presented in,8 both Fig. 11 (left) and Fig. 11 (right) are completely different, since Sader's graphs8 evidently show different behaviour for each A′. Additionally, when r tends to 0.5, their krel approaches unity whereas our krel approaches 0.5. We comment that when r is zero, there is a singular point, and that from a reduction of 13% difference in kz, our kw shows a 25–43% difference.


image file: c6ra02126c-f11.tif
Fig. 11 Relation between krel = kw/kz and r = (CE)/2C where (left) ν = 0 and (right) ν = 0.25.

3.3 Mechanical cantilever system

Here, we consider the mechanical performance between the tip and the bending cantilever by employing both solutions obtained from the potential energy calculation and the bending behaviour. Type 1 and Type 4 cantilevers are modelled and investigated, and Fig. 12 shows the geometries of the cantilever and the tip. In Fig. 13, we employ the values p = 17 μm, q = 4 μm so that α = 0.234 rad. From the relation θ = arctan(w′(L)), we can plot energy versus bending distance δ and interspacing ε. We consider the negative bending energy Ebend because it can be easily compared to the magnitude of the potential energy Ecp. The mechanical cantilever operates when EcpEbend. For Type 1 cantilever, the farthest bending distance δ is approximately 0.2 nm for which ε = 0.206 nm, and θ = 2.18 × 10⁻⁶ rad, and for Type 4, we have δ = 0.09 nm at ε = 0.206 nm and θ = 9.22 × 10⁻⁶ rad. The energy of each type at maximum δ is approximately −2.35 × 10⁻²¹ J. The tip of the cantilever has an initial swing to detect the surface of the substrate and the length units of the cantilever are in micrometers whereas the bending distance units are in nanometers.
image file: c6ra02126c-f12.tif
Fig. 12 (a) Geometry of cantilever, (b) relation between θ and ω′(L) where θ = arctan (w′(L)), and (c) geometry of cone with height p and base q.

image file: c6ra02126c-f13.tif
Fig. 13 Energy comparison, Ecp for cone and plane, and Ebend is potential energy in cantilever, (left) Type 1 and (right) Type 4 cantilevers.

4 Conclusion

Here a theoretical study of the AFM cantilever system is presented, employing the variational calculus and the Lennard-Jones potential to determine the bending behaviour of the system, and the calculation comprises two procedures. Firstly, we compute the energy between the silicon tip and the graphene plane, assuming the silicon tip is a cone, and it can act both vertical and inclined to the plane. Secondly, we solve the potential equation for the plate to deduce a bending equation, for which the solution describes the bending behaviour, and it can be used to determine the spring constant and the potential energy that is stored in the cantilever beam. We propose that the geometry of the cantilever is an isosceles trapezoid, mainly focussing on an V-shaped cantilever so as to compare our results with those of Sader et al.8,12 and Cleveland et al.10

In the first procedure, we obtain the energy equations of the right cone and that of the tilted cone. In the case of the tilted cone, when the tilted angle θ is zero, the energy equation gives rise to the energy of the right cone of the same cone angle α. Both cases have an equilibrium distance εmin at [B/(30A)]1/6. Moreover, the cone angle and the tilted angle do not effect the value of εmin where it is obtained as 0.206 nm. Both cases are unstable if ε is less than 0.149 nm, and the different values of εmin occur if and only if we use different materials for the tip and the plane.

In the second procedure, the bending profile tends to a parabola (δ/L2)x2. For any given bending distance δ, L will be a dominant parameter that affects the bending profile. On comparison with the spring constant given in (ref. 12), our kw gives a lower value while kz given in (ref. 8) shows larger values for all types of cantilevers. By comparing between kz and kw, the results show 30–50% difference and when r increases, this difference increases. Additionally, the 13% difference for kz mentioned in (ref. 8) is reduced, but still gives 25–36% difference for our spring constant.

Finally, on combining the first and the second procedures to observe the energy relation, we choose a cone radius α = 0.234 rad and use the parameter values given in Table 1. We predict a maximum bending distance δ between 0.2 nm and 0.09 nm corresponding to tilted angles θ = 2.18 × 10⁻⁶ rad and θ = 9.22 × 10⁻⁶ rad for Type 1 and Type 4, respectively, and the energies arising from both procedures are −2.35 × 10⁻²¹ J.

Our method gives an alternative approach to determine the bending behaviour of the cantilever and the tip response to the surface. This analytical method is relevant in the determination of the distance, energy, and force that are the main considerations in any study of the mechanics of the system. Our approach gives a better understanding of the relations between the substrate surface, the bending distance and the properties of the surface. Moreover, this approach can be applied to any shape of the cantilever and any surface. For a given substrate, we can calculate the appropriate distance between the tip and the sample so as to fix the position of the cantilever to accommodate the bending angle. Further, if we know the surface level from the monitor and we know the bending distance or angle, we can then predict the molecules on the substrate. In the theoretical analysis, our calculation utilizes the calculus of variation, and coordinate transformation of the atoms to model the cantilever system. The approach may involve some approximations but it gives a numerical solution that is faster than that obtained by computer simulation. Hence, we believe that the approach adopted here might be used in many future studies, not only for the cantilever system but also for any mechanical systems involving a scanning step, so that we might quickly determine a reliable solution by means of a simple mathematical formula.

Acknowledgements

Financial support from the Thailand Research Fund through the Royal Golden Jubilee Ph.D. Program (Grant No. PHD/0062/2555) is acknowledged. DB is also grateful for the support of the Thailand Research Fund (RSA5880003).

References

  1. S. Kasas, N. H. Thomson, B. L. Smith, P. K. Hansma, J. Miklossy and H. G. Hansma, Biological Applications of the AFM: From Single Molecules to Organs, International Journal of Imaging Systems and Technology, 1997, 8, 151161 CrossRef.
  2. C. M. Franz and P. H. Puech, Atomic Force Microscopy: A Versatile Tool for Studying Cell Morphology, Adhesion and Mechanics, Cell. Mol. Bioeng., 2008, 1, 289–300 CrossRef.
  3. G. Binnig, C. F. Quate and C. Gerber, Atomic Force Microscope, Phys. Rev. Lett., 1986, 56, 930–933 CrossRef PubMed.
  4. H. J. Butt, B. Cappella and M. Kappl, Force measurements with the atomic force microscope: technique, interpretation and applications, Surf. Sci. Rep., 2005, 59, 1–152 CrossRef CAS.
  5. A. D. Slattery, A. J. Blanch, J. S. Quinton and C. T. Gibson, Accurate measurement of Atomic Force Microscope cantilever deflection excluding tip-surface contact with application to force calibration, Ultramicroscopy, 2013, 131, 46–55 CrossRef CAS PubMed.
  6. R. Wagner, R. Moon, J. Pratt, G. Shaw and A. Raman, Uncertainty quantification in nanomechanical measurements using the atomic force microscope, Nanotechnology, 2011, 22, 455703 CrossRef PubMed.
  7. A. D. Slattery, A. J. Blanch, J. S. Quinton and C. T. Gibson, Calibration of atomic force microscope cantilevers using standard and inverted static methods assisted by FIB-milled spatial markers, Nanotechnology, 2013, 24, 015710 CrossRef PubMed.
  8. J. E. Sader and L. White, Theoretical analysis of the static deflection of plates for atomic force microscope applications, J. Appl. Phys., 1993, 74, 1–9 CrossRef CAS.
  9. E. H. Mansfield, The Bending and Stretching of Plates, London, Pergamon Press Ltd., 1964 Search PubMed.
  10. J. P. Cleveland, S. Manne, D. Bocek and P. K. Hansma, A nondestructive method for determining the spring constant of cantilevers for scanning force microscopy, Rev. Sci. Instrum., 1993, 64, 403–405 CrossRef CAS.
  11. W. F. Stokey, Shock and Vibration Handbook, McGraw-Hill, New York, 1989 Search PubMed.
  12. J. E. Sader, I. Larson, P. Mulvaney and L. R. White, Method for the calibration of atomic force microscope cantilevers, Rev. Sci. Instrum., 1995, 66, 3789–3798 CrossRef CAS.
  13. C. P. Green, H. Lioe, J. P. Cleveland, R. Proksch, P. Mulvaney and J. E. Sader, Normal and torsional spring constants of atomic force microscope cantilevers, Rev. Sci. Instrum., 2004, 75, 1988–1996 CrossRef CAS.
  14. J. E. Sader, Parallel beam approximation for V-shaped atomic force, microscope cantilevers, Rev. Sci. Instrum., 1995, 66, 4583–4587 CrossRef CAS.
  15. B. W. Hoogenboom, P. L. T. M. Frederix, D. Fotiadis, H. J. Hug and A. Engel, Potential of interferometric cantilever detection and its application for SFM/AFM in liquids, Nanotechnology, 2008, 19, 1–6 CrossRef PubMed.
  16. T. Fukuma, M. Kimura, K. Kobayashi, K. Matsushige and H. Yamada, Development of low noise cantilever deflection sensor for multienvironment frequency modulation atomic force microscopy, Rev. Sci. Instrum., 2005, 76, 053704 CrossRef.
  17. J. Cai, Q. Xia, Y. Luo, M. Y. Wang and L. Zhang, Optimal Design and Evaluation of Cantilever Probe for Multifrequency Atomic Force Microscopy, 11th World Congress on Structural and Multidisciplinary Optimisation, 2015 Search PubMed.
  18. R. M. D. Stevens, N. A. Frederick, B. L. Smith, G. D. Stucky DEM and P. K. Hansma, Carbon nanotubes as probes for atomic force microscopy, Nanotechnology, 2000, 11, 1–5 CrossRef CAS.
  19. M. B. Viani, T. E. Schäffer, G. T. Paloczi, L. I. Pietrasanta, B. L. Smith and J. B. Thompson, et al., Fast imaging and fast force spectroscopy of single biopolymers with a new atomic force microscope designed for small cantilevers, Rev. Sci. Instrum., 1999, 70, 4300–4303 CrossRef CAS.
  20. G. Schitter, K. J. A. ström, B. E. DeMartini, P. J. Thurner, K. L. Turner and P. K. Hansma, Design and Modeling of a High-Speed AFM-Scanner, IEEE Transactions on Control Systems Technology, 2007, vol. 15, pp. 906–915 Search PubMed.
  21. J. D. Li, J. Xie, W. Xue and D. M. Wu, Fabrication of cantilever with self-sharpening nano-silicon-tip for AFM applications, Microsyst. Technol., 2013, 19, 285–290 CrossRef CAS.
  22. Y. P. Song, S. Wu, L. Y. Xu, J. M. Zhang, D. J. D. Gonzalez and X. Fu, et al., Calibration of the effective spring constant of ultra-short cantilevers for a high-speed atomic force microscope, Meas. Sci. Technol., 2015, 26, 1–11 CrossRef CAS.
  23. C. T. Gibson, D. A. Smith and C. J. Roberts, Calibration of silicon atomic force microscope cantilevers, Nanotechnology, 2005, 16, 234–238 CrossRef CAS PubMed.
  24. J. E. Sader, J. A. Sanelli, B. D. Adamson, J. P. Monty, X. Wei and S. A. Crawford, et al., Spring constant calibration of atomic force microscope cantilevers of arbitrary shape, Rev. Sci. Instrum., 2012, 83, 103705 CrossRef PubMed.
  25. A. D. Slattery, J. S. Quinton and C. T. Gibson, Atomic force microscope cantilever calibration using a focused ion beam, Nanotechnology, 2012, 23, 285704 CrossRef PubMed.
  26. S. M. Cook, T. E. Schäffer, K. M. Chynoweth, M. Wigton, R. W. Simmonds and K. M. Lang, Practical implementation of dynamic methods for measuring atomic force microscope cantilever spring constants, Nanotechnology, 2006, 17, 2135–2145 CrossRef CAS.
  27. J. E. Sader, J. Lu and P. Mulvaney, Effect of cantilever geometry on the optical lever sensitivities and thermal noise method of the atomic force microscope, Rev. Sci. Instrum., 2014, 85, 113702 CrossRef PubMed.
  28. A. D. Slattery, A. J. Blanch, V. Ejov, J. S. Quinton and C. T. Gibson, Spring constant calibration techniques for next-generation fast-scanning atomic force microscope cantilevers, Nanotechnology, 2014, 25, 335705 CrossRef PubMed.
  29. A. K. Rappé, C. J. Casewit, K. S. Colwell, W. A. Goddard III and W. M. Skid, UFF, a Full Periodic Table Force Field for Molecular Mechanics and Molecular Dynamics Simulations, J. Am. Chem. Soc., 1992, 114, 10024–10035 CrossRef.
  30. B. J. Cox, N. Thamwattana and J. M. Hill, Mechanics of atoms and fullerenes in single-walled carbon nanotubes. I. Acceptance and suction energies, Proc. R. Soc. A, 2007, 463, 461–476 CrossRef CAS.

This journal is © The Royal Society of Chemistry 2016