
Nano-silver enhanced luminescence of Er3+ ions embedded in tellurite glass, vitro-ceramic and ceramic: impact of heat treatment
Hssen Fares*a,
Wissal Stamboulia,
Habib Elhouichet*ab,
Bernard Gellozc and
Mokhtar Férida
aLaboratoire de Physico-Chimie des Matériaux Minéraux et leurs Applications, Centre National de Recherches en Sciences des Matériaux, B.P. 95 Hammam-Lif, 2050, Tunisia. E-mail: fares.hssen@gmail.com
bDépartement de Physique, Faculté des Sciences de Tunis, University of Tunis ElManar, 2092, Tunisia. E-mail: habib.elhouichet@fst.rnu.tn
cGraduate School of Engineering, Nagoya University, 2-24-16 Furo-cho, Chikusa-ku, Nagoya, Aichi 464-8603, Japan
First published on 15th March 2016
Abstract
Tellurite glasses co-activated with erbium ions and silver nanoparticles (Ag NPs) are prepared using melt quenching technique. The effect of heat treatment on structural, luminescence and spectroscopic properties has been investigated. Both X-ray diffraction and Raman spectroscopy indicate the precipitation of crystalline phases after heat treatment. Based on the absorption measurements, the intensity parameters Ωt (t = 2, 4 and 6), the radiative transition probability (AT), fluorescence branching ratio (βJJ′) and radiative lifetimes (τr) of Er3+ ions were calculated using Judd–Ofelt theory. The results suggest that Er3+ ions have been incorporated into Ag NPs, which intensified the electromagnetic field around Er3+ ions. The luminescence properties of Er3+, doped prepared, were investigated. It was found that the presence of silver NPs, nucleated and grown during the heat annealing process, improves the photoluminescence (PL) intensity and the PL lifetime relative to the 4I13/2 → 4I15/2 transition. Such enhancements are attributed to the strong local electric field induced by the SPR of silver NPs as the major factor and the energy transfer from the surface of silver NPs to Er3+ ions. Using the Mc-Cumber method, emission cross-section (σe), absorption cross-section (σa), and gain cross-section (G(λ)) for the 4I13/2 → 4I15/2 transition were calculated. Compared with other glass hosts, the results indicate that the vitro-ceramic sample has good prospects as a gain medium applied for a 1.53 μm broad band and high-gain erbium-doped fiber amplifiers (EDFA).
I Introduction
Transparent nano-glass-ceramics, co-activated with erbium ions (Er3+) and silver nanoparticles (Ag NPs), have been recently shown to be promising materials for new optical devices such as bulk laser media and Er3+ doped fiber amplifier (EDFA), which is one of the key elements used in the wavelength division multiplexing (WDM) network system for optical communication.1–4 In fact, surface plasmon resonance (SPR) is a unique optical phenomenon occurring at the surfaces of metal particles in the nanometer size regime. It is the collective oscillation of the outer conduction electrons upon electromagnetic excitation.5 The strong absorption cross-section related to the surface plasmon excitation in noble-metal nanoparticles and/or the large local field enhancement that is generated around the excited nanoparticle make it possible to use such metal nanoparticles for the enhancement of the luminescence intensity emitted by Er3+ ions when present in the close vicinity of plasmonics nanoparticles.6–8The selection of materials with appropriate parameters is a hard task when one is performing experiments with NP ensembles such as the ones performed with glasses. Thus, it is very important to select glasses with a large transparency window and small cutoff-phonon energy to reduce the probability of non-radiative relaxation of the Er3+ ions. Among the variety of possible matrices, tellurite glasses offer distinct optical properties, such as a large infrared transmission window from the visible to the mid-infrared region, good chemical durability, high refractive index (≈2), good mechanical strength, high metal solubility, and low phonon energy as compared to silicates, phosphate and borates.9–11 These characteristics make them promising candidates for the development of lasers and optical amplifiers for optical telecommunication. In the case of vitro-ceramics and ceramics, thermal treatment close to the crystallization temperature for the tellurite glasses may produce important structural and behavioral changes to the host matrix in which Ag NPs are dispersed in the oxide glass matrix. If the rare earth ions can be successfully incorporated into the Ag NPs, which can provide a low phonon environment, Er3+ ion doped glass ceramics will exhibit excellent luminescence properties.
As part of ongoing research concerning tellurite glasses and glass ceramics co-doped with RE ions and silver nanoparticles, the present paper is devoted to the investigation of the transition between glasses and glass-ceramics in Er3+–Ag co-doped tellurite glasses by an appropriate heat treatment to generate the precipitation of Ag NPs in the oxide glass matrix. The effect of heat treatment on the dynamics of energy transfer between silver NPs and Er3+ ion co-doped tellurite glass, vitro-ceramic and ceramic is analyzed and understood.
II Experimental details
The melt quenching technique was used to prepare the glass samples with the molar compositions 68.5TeO2–20BaO–10Nb2O5–0.5AgNO3–1Er2O3 (Ag0.5). All the starting chemical constituents are of more than 99.9% purity. Calculated quantities of the chemical components were mixed in a mortar with a pestle for 30 min to obtain homogeneous mixtures. The well-mixed powder of each glass was melted in an electric furnace at 900 °C for 1 h in platinum crucibles so that a homogeneously mixed melt was obtained. Then, the melt was rapidly quenched by pouring it into a stainless steel plate kept at 200 °C to avoid excess thermal shocks. Immediately after the quench, the glass (as-prepared sample) was annealed at 300 °C below the glass transition temperature Tg (Tg = 410 °C) for 2 h and then slowly cooled down to the ambient temperature. The heat-treated glass samples were prepared by heating the Ag0.5 base glass above the glass transition temperature (at 450 °C) and at the crystallization peak temperatures (at 575 °C) obtained from the DSC analyses for 3 h, followed by quenching in air.The thermal characterization experiments were realized using the differential scanning calorimetry (DSC) technique. DSC scans of as-cast glass specimens were carried out in a MetlerToldo DSC823e and a DSC Instruments Universal Analysis Program was used to determine the glass transition temperatures Tg. The DSC scans were recorded using 7 mg as-cast glass specimens, which were powdered and heated at the heating rate of 10 °C min−1 from room temperature to 600 °C in a platinum crucible and using the same amount of alumina powder as in the reference material. The crucibles used were matched in pairs, made of platinum and the temperature precision was ±1 °C. X-ray diffraction (XRD) patterns were obtained at room temperature with a Philips X'Pert system, using Cu Kα radiation (λ = 1.54056 Å), at 40 kV and 100 mA; the diffractometer settled in the 2θ range from 3° to 70° by changing 2θ with a step size of 0.02°. Micro-Raman measurements were carried out using a visible Labram HR spectrometer (Horiba Gr, France). The Raman backscattering was excited with a 632.8 nm excitation wavelength. The beam was focused on the sample surface through an optical objective of less than 1 μm.
The absorption spectra of the glasses were recorded in the range 200–1800 nm using a Perkin-Elmer Lambda 950UV/VIS/NIR spectrophotometer.
Photoluminescence (PL) spectra and time-resolved PL spectra were measured in air at room temperature using a spectrophotometer (Hitachi U-4100). The IR photoluminescence (PL) spectra were measured with a N2-cooled CCD array from Princeton Instruments coupled to a grating. The IR lifetime was measured with a PMT from Hamamatsu Photonics (H10330A-75) coupled to an oscilloscope. The excitation source is an Ar laser (λexc = 488 nm).
The density of the glass samples was determined by a simple Archimedes method using acetone as an immersing liquid and a digital balance with an accuracy of ±0.0003%. Refractive indices of all the samples were measured from the optical absorption edges using the Tauc model. All the optical measurements were performed at room temperature.
III Results and discussions
A Structural analysis
The X-ray diffraction patterns of the untreated glass (Ag0.5) and the samples heat treated at 450 °C (vitro-ceramic) and at 575 °C (ceramic) are shown in Fig. 1. Starting from the glass sample Ag0.5, the spectrum exhibits a broad band ranging between 2θ = 20° and 35° values, which is an indication of the typical behavior of glassy solids and the absence of crystals of detectable size. However, the XRD pattern obtained from the sample heat treated at 450 °C (vitro-ceramic) showed a reduction of the amorphous hump and the development of a peak corresponding to a niobium–tellurite phase present in the glass matrix. This reduction means that the treatment at this temperature has a corresponding phase that begins to crystallize or undergo partial crystallization in the treated glass. On the other hand, when the glass was heated at higher temperatures (575 °C) the glass state disappeared resulting in a ceramic. In fact, the XRD pattern of the ceramic sample showed several sharp diffraction peaks indicating that a crystal phase was successfully precipitated. The following gradual changes are observed according to the following XRD cards. The indexed peaks in these patterns (b and c) were attributed to (para-tellurite) α-TeO2,12 which had a tetragonal crystal structure with lattice parameters a = 4.810 Å and c = 7.613 Å, γ-TeO2 (ref. 13) having an orthorhombic symmetry with the calculated lattice parameters a = 4.898 Å, b = 8.576 Å and c = 4.351 Å, a Nb2Te4O13 crystalline phase which has a monoclinic crystal structure with lattice parameter a = 13.409 Å, b = 21.503 Å and c = 7.534 Å,14 in addition to the Ag NP crystalline phases which has a cubic crystal structure with lattice parameter a = 4.077 Å.15 In general, α-TeO2 and γ-TeO2 are typically formed when tellurite glasses crystallize.16,17 The crystalline α-TeO2 and γ-TeO2 phases are two polymorphs of tellurium dioxide TeO2, where the γ-TeO2 is considered a meta-stable structure.16,18 Kabalci has also detected crystallization Nb2Te4O13 peaks in the Nb2O5–TeO2 system.19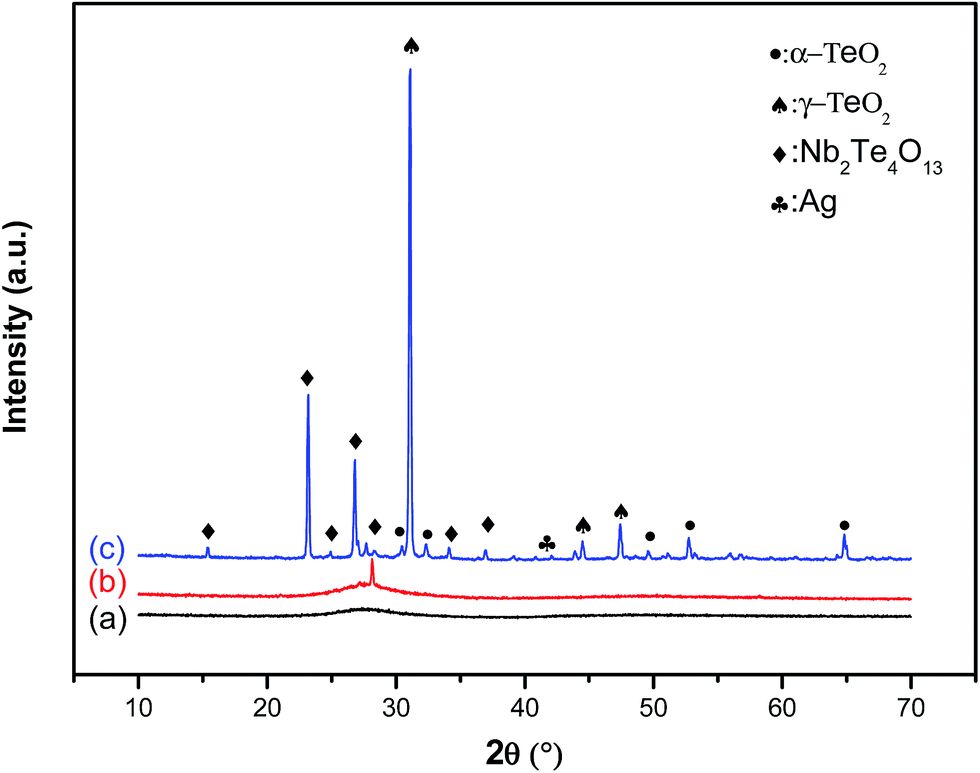 | ||
| Fig. 1 X-ray diffraction patterns of glassy (a), vitro-ceramic (b) and ceramic (c) states of Ag0.5. | ||
Fig. 2 shows the measured Raman spectra of untreated glass, vitro-ceramic and ceramic. All the spectra have been measured under 632 nm excitation lines at room temperature.
 | ||
| Fig. 2 Raman spectra of the prepared samples. | ||
Starting from the untreated glass (Ag0.5), the peak centered at around 495 cm−1 is related to the bending and stretching vibrations of the Te–O–Te or O–Te–O linkages with O in a position alternatively axial and equatorial.16 The broad peak at around 645 cm−1 is assigned to the stretching vibration of Te–O bonds in the [TeO4] tbp units with bridging oxygen atoms (BO).11 The higher intensity of this peak refers to the less distortion in the [TeO4] tbp units. This is one of the typical modes due to [TeO4] tbp, which is observed in α-TeO2.20 The shoulder at around 785 cm−1 is assigned to stretching vibrations between Te and non-bridging oxygen (NBO) of [TeO3+1] polyhedra or [TeO3] tp units,21 while the band near 875 cm−1 could be attributed to the vibration modes of Nb–O in the [NbO6] octahedra or the Nb–O–Nb linkage.22 It should be noticed that the presence of silver, even in relatively high doping levels, does not lead to the development of vibrational peaks, which indicates a very good dispersion of silver NPs.
The analysis of Raman modes as function of the temperature of the heat treatment was an important tool to study the phase transformations that occurred in the glassy matrix. As we can see from Fig. 2, there was not a great difference between the two spectra of the vitro-ceramic and the untreated glass (Ag0.5). Therefore, one can say that the annealing at 450 °C does not have a great effect on the structure of the matrix. However, when the temperature of heat treatment increased up to 575 °C, some bands disappeared while others appeared. This was a direct consequence of the crystallization process in the glass. These vibration modes were attributed to the presence of different crystalline phases in the studied glass.
The assignments of bands in the Raman spectrum of the ceramic sample are given according to the information for the TeO2 based glass-ceramics reported recently. In fact, Mirgorodsky et al. reported that the Raman spectra of α-TeO2 and γ-TeO2 crystalline phases present in TeO2 were the base glasses.23 Hence, the exact assignment of the Raman peaks can be made by consulting the relevant literature i.e. α-TeO2 (ref. 23 and 24) as having the spectral peaks at about 440, 470, 520, 575, 600 and 660 cm−1 while γ-TeO2 as having the spectral peaks at about 740, 770 and 845 cm−1. On the basis of this relevant literature and assuming that the spectral peaks are attributed to the vibrations modes of the α-TeO2 and γ-TeO2 crystalline phases, there remain five non-identified peaks for the crystallized glasses. Based on the XRD results of these glasses, we believe that these non-identified spectral peaks might belong to the Nb2Te4O13 phase.
B Absorption spectra and Judd–Ofelt analysis
The absorption spectra of the Er3+ doped Ag0.5 precursor glass and glass ceramics are shown in Fig. 3. Each spectrum consists of eight sharp absorption bands located at 1532, 978, 800, 652, 546, 525, 488 and 454 nm, which correspond to the 4f–4f transition of Er3+ from the ground state 4I15/2 to the excited states 4I13/2, 4I11/2, 4I9/2, 4F9/2, 4S3/2, 2H11/2, 4F7/2 and 4F5/2, respectively. The absorption spectra have some remarkable changes after crystallization. First, the spectra given in Fig. 3 clearly show that the transparency domain of the glass is considerably reduced by the heat treatment. An increase in the temperature of the nucleation and growth steps leads to a shift of the band gap to higher wavelengths. According to the scattering theory and in agreement with Morimoto,25 small crystallites and small differences between the refractive index of the crystals and the base glass, provide low scattering. Thus, the transparency of the most transparent glass-ceramics is achieved by the smaller crystallite size approximately equal to the wavelength of the scattered light. The shift of the band gap is more pronounced when the glass is heat treated at 575 °C. This can be related to the precipitation and growth of a large number of crystals of a large size. These experimental observations are quite similar to those obtained with other glass-ceramics.16,26 Second, the spectrum of the ceramic sample (inset Fig. 3) consists of very thin absorption lines due to the presence of a crystalline phase that occurs in the glass matrix, which consequently modifies the environment of the Er3+ ion. For example, the absorption band at 1532 nm changes in shape after the heat treatments and a narrow peak located at 1566 nm is detected (inset Fig. 3). Furthermore, the intensity of the shoulder at 1490 nm slightly increases compared to that of the main band at 1532 nm which indicates that the heat treatment has an impact on the Er3+ absorption bands. This behavior is mainly related to the Stark effect, which tends to raise the degeneracy of the levels involved in the transitions. More important is the large blue shift observed at shorter wavelengths (480–580 nm). The shifted bands for the crystallized sample maybe due to the incorporation of Er3+ ions into the tellurite nano-crystals especially the Ag NP phase. On the other hand, no absorption band related to the SPR of silver NPs is observed in the absorption spectra presented in Fig. 3, probably due to the low quantity of Ag in the samples and the existence of an Er3+ absorption band in the visible region, which may hide the plasmon band.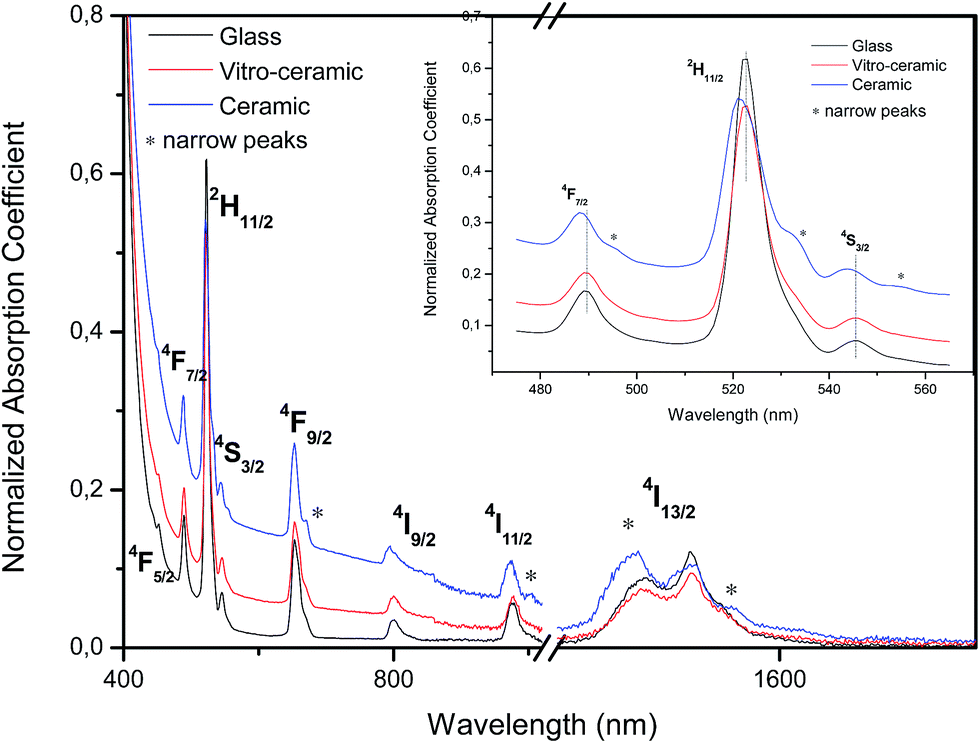 | ||
| Fig. 3 Absorption spectra of glassy, vitro-ceramic and ceramic states of the Ag0.5 sample. Right inset indicates the peaks of crystallization of the ceramic sample. | ||
Judd–Ofelt theoretical analyses have been applied to determine important spectroscopic and laser parameters of the RE doped materials. We provide the following short synopsis germane to study the optical properties of Er3+ doped tellurite glass and glass ceramics. Based on their theory, the data from the absorption spectra can be used to predict the radiative transition probabilities, the branching ratio and the radiative lifetime of different transitions, in particular from 4I13/2 to the ground state (1.53 μm).
The measured absorption line strength (Smeas) for the induced electric dipole transition of each band was experimentally determined from the area under the absorption band and can be expressed in terms of the absorption coefficient α by the equation:27,28
 | (1) |
 represents the local field correction for the ion in the dielectric host medium.
The values of Smeas obtained by the numerical integration of the absorption line shapes were used to obtain the phenomenological Judd–Ofelt parameters Ωt (t = 2, 4 and 6) by fitting the experimental value with the theoretical expression derived by Judd and Ofelt:27,28
 | (2) |
The root-mean-square deviation ΔSrms between the measured (Smeas) and the calculated (Scal) oscillator strengths can be calculated based on the following relationship:
 | (3) |
From Table 1, the J–O parameters Ωt (t = 2, 4 and 6) change significantly in our prepared samples with the heat treatment temperature. In general, Ω2 is sensitive to the asymmetry in the vicinity of the rare earth ions (short-range effects) and the changes in Ω4 and Ω6 are correlated with long-range effects of the glass host.30 In other words, Ω2 is found to be affected by the covalence between the rare earth ions and the ligand anions, while Ω4 and Ω6 reflect the bulk properties of the host, such as rigidity and density.31
As summarized in Table 1, Ω2 decreased gradually with the increase of the heat treatment temperature. In-depth studies on the J–O intensity parameters Ω2,4,6 (ref. 30 and 32) propose that Ω2 is mostly related to the asymmetry and polarization of the local structure surrounding the RE-ion. Since Ω2 increases as the polarization and asymmetry of the RE-site become large,30,32 the decrease of Ω2 in the present system can be interpreted as that the heat treatment temperature increases the Er3+ ions in the glass network, occupying symmetric and less polarized sites. Moreover, the J–O parameter Ω2 of the ceramic sample is smaller than that of the corresponding precursor glass, as shown in Table 1, which may be due to the incorporation of Er3+ ions into the precipitated nanocrystals. Therefore, the decrease of Ω2 during the crystallization of the precursor glass indicates the incorporation of Er3+ ions into the tellurite nano-crystals, especially the Ag NP phase. According to our previous study,33 the interaction between Er3+ and Ag NPs strongly influences the crystal field environment of Er3+ ions. In fact, during the nucleation and growth process of Ag NPs, Er3+ ions act as crystal nucleus. Thus, the Er3+ ions might enter into the Ag NP phase, causing an intensified electromagnetic field around the Er3+ ions which results in the decrease of Ω2. Furthermore, Table 1 compares the J–O parameters in our samples as well as for other Er3+ doped glasses. In this work, Ω2 are larger than those of phosphate,34 fluoride35 and tellurite glasses.36 This indicates that Er3+ ions in the prepared glasses present a higher covalency of the ion-ligands and a lower symmetry when compared with phosphate, silicate and fluoride glasses.
On the other hand, an increase of Ω6 with the increase of heat treatment temperature suggests potential increases in the long range effects, such as rigidity and density of the prepared glasses. This fact affirms that more Er cations dissolve in the glass matrix and that the distance between adjacent Er cations diminishes. This probably increases the repulsive force between neighboring Er cations and therefore increases Ω6.33
Using the values of the intensity parameters, the spectroscopic quality factor χ, defined as χ = (Ω4/Ω6), is determined, which is critically important in predicting the stimulated emission for the laser active medium. The smaller this parameter value, the more intense the laser transition 4I13/2 → 4I15/2 is.37 In this work, this parameter is in the range of 1.19–0.84. These values, especially those for the sample heat treated at 450 °C (vitro-ceramic) are much larger than those found in most other glasses, which indicates that this material might be a desirable candidate for stimulated emission.
The radiative transition probability, A(J → J′), from the upper manifold states, 4I13/2, 4I11/2, and 4I9/2, to their corresponding lower-lying manifold states can be evaluated from the relation:38
 | (4) |
 | (5) |
In this work, the values of Amd were calculated using the values for LaF3 (A′md) and corrected for the refractive index difference.39 The relationship is the following:
 | (6) |
The radiative lifetime τr of an emitting state is related to the spontaneous transition probability for all transitions from this state by:
 | (7) |
The fluorescence branching ratios, β(J → J′), can be determined from the radiative decay rates by:
 | (8) |
| Samples | 4I13/2 → 4I15/2 | 4I11/2 → 4I15/2 | 4I9/2 → 4I15/2 | ||||||
|---|---|---|---|---|---|---|---|---|---|
| A (s−1) | βJJ′ (%) | τ (ms) | A (s−1) | βJJ′ (%) | τ (ms) | A (s−1) | βJJ′ (%) | τ (ms) | |
| Glass | 208.34 | 1.00 | 4.79 | 211.72 | 0.83 | 3.95 | 180.32 | 0.72 | 4.00 |
| Vitro-ceramic | 199.23 | 1.00 | 5.01 | 199.99 | 0.83 | 4.18 | 131.37 | 0.65 | 5.02 |
| Ceramic | 174.55 | 1.00 | 5.72 | 173.69 | 0.83 | 4.82 | 130.69 | 0.66 | 5.11 |
C Luminescence properties
Fig. 4(a) shows the near infrared luminescence spectra of the Er3+ ions in the glass and glass ceramics under the excitation of a 488 nm Ar+ laser, in resonance with the SPR band of Ag NPs. The emission band can be assigned to the 4I13/2 → 4I15/2 transition. As shown in Fig. 4(a), compared with the untreated glass (Ag0.5), the maximum enhancement is observed for the sample heat treated at 450 °C (vitro-ceramic), while the ceramic sample has a lower intensity than that of the vitro-ceramic sample. Furthermore, two clear split peaks can be observed for the glass ceramics in comparison with glass. It is believed that emission peaks would split when the crystal field around Er3+ ions became stronger. Therefore, the appearance of split peaks indicated that the crystal field became stronger, which suggested also that some Er3+ ions had been incorporated into nano-crystals, especially the Ag NP phase. Thus, the local field effect (LFE) stimulated by the SPR of Ag NPs precipitated in the glass ceramics causes an intensified electromagnetic field around Er3+ ions which in turn increases the rate of excitation of the RE ions efficiently, and hence the PL intensity of the 4I13/2 → 4I15/2 transition is also enhanced.33 This seems to indicate the most probable mechanism for the observed fluorescence enhancement, which is the field enhancement effect induced by the SPR of Ag.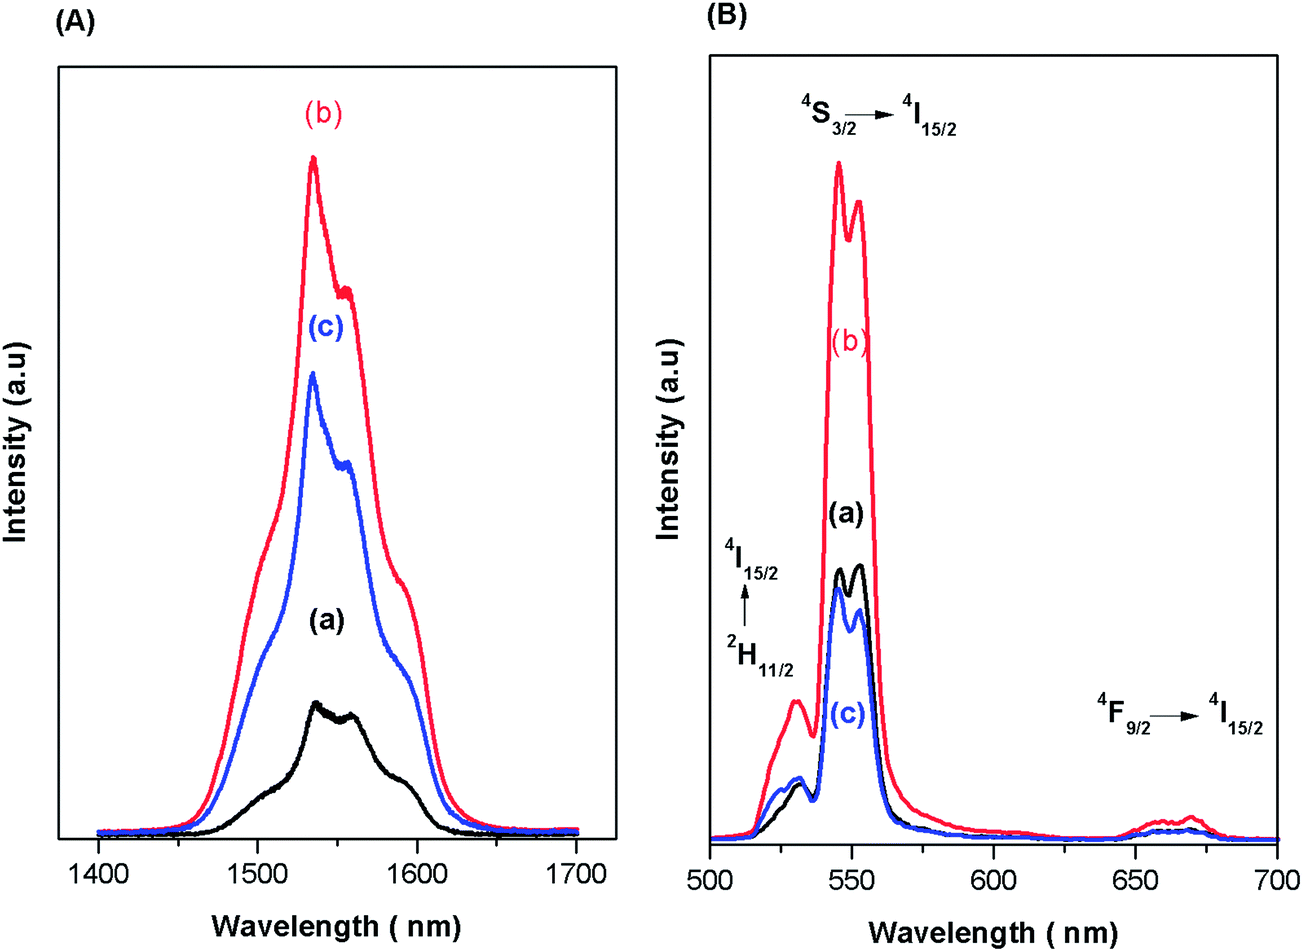 | ||
| Fig. 4 Infrared (A) and visible (B) PL spectra of the glassy (a), vitro-ceramic and ceramic (c) states of the Ag0.5 sample, under 488 nm laser excitation. | ||
In accordance with above results, the UV/VIS emission spectra of Er3+ ion doped prepared samples were recorded under an excitation of 488 nm in the range 500–700 nm and are presented in Fig. 4(b). The emission bands can be assigned to 2H11/2 → 4I15/2 (520 nm), 4S3/2 → 4I15/2 (550) nm and 4F9/2 → 4I15/2 (650) nm transitions, respectively. It can be seen that the PL bands in the green-red region increase after heat-treatment at 450 °C, by almost three times with respect to the un-annealed sample. On the other hand, further increase in the heat treatment diminishes the emission intensities in the entire visible range. As explained before, the primary reason for the enhancement in the emission bands of Er3+ ions is the local field enhancement (LFE) induced by Ag NPs. Another factor that seems to be a reason for fluorescence enhancement is energy transfer from the surface of silver NPs to Er3+ ions since the excitation is in resonance with the SPR band of Ag NPs while an un-favorable back-energy transfer from Er3+ to Ag NPs (re-absorption by Ag NPs) causes the quenching of the emission bands.8 To understand the mechanisms of fluorescence enhancement, a simplified energy level diagram of Er3+ ions in the vicinity of Ag NPs is proposed as depicted in Fig. 5. The excitation, under 488 nm, stimulates the Er3+ ions at the ground state to the excited state by ground state absorption (GSA), where the multi-phonon non-radiative (NR) decays populate the excited states 2H11/2, 4S3/2 and 4F9/2 which produces green emissions at 520 nm (2H11/2 → 4I15/2) and 550 nm (4S3/2 → 4I15/2) followed by a red emission at 650 nm due to the transition 4F9/2 → 4I15/2. In addition, the cooperative energy transfer (CET) process can also operate between two nearby Er3+ ions as: 4F7/2, 4I11/2 → 24F9/2 and 4S3/2, 4I9/2 → 24F9/2. Moreover, the electrons at the ground state can be excited to the 4I11/2 state by absorbing another photon from adjacent Er3+ ions. Subsequently, the electrons at the 4I11/2 level of Er3+ relax to the 4I13/2 level by non-radiative multi-phonon relaxation (MRP), which produces infrared emission at 1532 nm due to the transition 4I13/2 → 4I15/2. Although the primary reason for enhancement in the emission bands of Er3+ ions is the local field enhancement (LFE), the energy transfer (ET) from the metal to RE ions is mainly proposed to be a second factor for the luminescence enhancements, since the SPR of Ag NPs is in resonance with the excitation energy.33 On the other hand, local field enhancement (LFE) cannot explain the drastic reduction of the emission bands of Er3+. Thus, the quenching is due to energy transfer from Er3+ ions to Ag NPs (Er3+ → Ag) and re-absorption by SPR, which is in resonance with the emissions from Er3+ ions.8 All the above processes are illustrated in Fig. 5.
 | ||
| Fig. 5 Schematic energy level diagram of Er3+:Ag NPs co-doped tellurite glass and luminescence mechanisms under the 488 nm excitation wavelength. | ||
D Quantum efficiencies and amplification quality factor
Fig. 6 shows the PL decay profiles of the 4I13/2 → 4I15/2 transition for the prepared glasses under the excitation of a 488 nm Ar+ laser at room temperature. For the untreated glass sample, the PL decay curve can be described by a single exponential function. Obviously, by carrying out heat treatment on Er3+ doped tellurite glass, the PL decay curves present non-exponential behavior, which may be due to a crystallization process. All the normalized experimental data, with respect to pump energy, are fitted using the expression given by:
 | (9) |
 | ||
| Fig. 6 PL decay curves of Er3+ (4I13/2 → 4I15/2 transition) of the glass (a), vitro-ceramic (b) and ceramic (c) states of the Ag0.5 sample. | ||
| Samples | Glass | Vitro-ceramic | Ceramic |
|---|---|---|---|
| τmes (ms) | 3.46 | 4.67 | 4.98 |
| τrad (ms) | 4.79 | 5.01 | 5.72 |
| η (%) | 72 | 93 | 87 |
In accordance with the above arguments, the quantum efficiency (η) is calculated from the radiative lifetime τrad, obtained from the Judd–Ofelt theory, and the measured experimental lifetime τmes, as given by:
 | (10) |
Table 3 compares the values of the quantum efficiency of precursor glass and treated glass. As can be seen from Table 3, the results show a significant increase in the quantum efficiency of the 4I13/2 level after the increase of heat treatment. Notably, it was found that the quantum efficiency in the vitro-ceramic (η = 93%) sample is much longer than that in most other glasses, which indicates that this glassy system could be considered as a good candidate for the realization of a laser emitting at 1.53 μm. In other words, we believe that the presence of Ag NPs as a sensitizer plays an important role in the fluorescence dynamics of the Er3+ doped systems.
In addition to the lifetime of the 4I13/2 level, we have estimated important parameters that are relevant for optical amplifiers for the 4I13/2 → 4I15/2 transition, such as effective bandwidth (Δλeff), full-width at half-maximum (FWHM), bandwidth quality factor (FWHM × σe) and gain coefficient (G(λ)), which is an important parameter for the Er3+-doped fiber amplifier (EDFA) used in the wavelength division multiplexing (WDM) network system of optical communication.
The effective bandwidth (Δλeff) can be expressed, according to Weber et al., by:42
 | (11) |
| Samples | FWHM (nm) | Δλeff (nm) | σa (10−21 cm2) | σe (10−21 cm2) | FWHM × σe (10−21 cm2 nm) |
|---|---|---|---|---|---|
| Glass | 49.32 | 61.86 | 6.33 | 7.93 | 391.10 |
| Vitro-ceramic | 59.07 | 73.29 | 7.51 | 9.45 | 558.21 |
| Ceramic | 55.98 | 70.71 | 4.39 | 5.80 | 324.68 |
| Phosphate46 | 23.68 | 47.22 | — | 7.59 | 179.73 |
| Bismuth4 | 78 | 84 | — | 4.60 | 280.60 |
| Alumino-silicate47 | 43 | — | — | 5.7 | 245.10 |
| Tellurite16 | 56 | — | — | 6.89 | 372.06 |
The stimulated emission cross-section (σe) of Er3+ can be obtained by the Mc Cumber theory43 which is related to the absorption cross section (σa) by:
 | (12) |
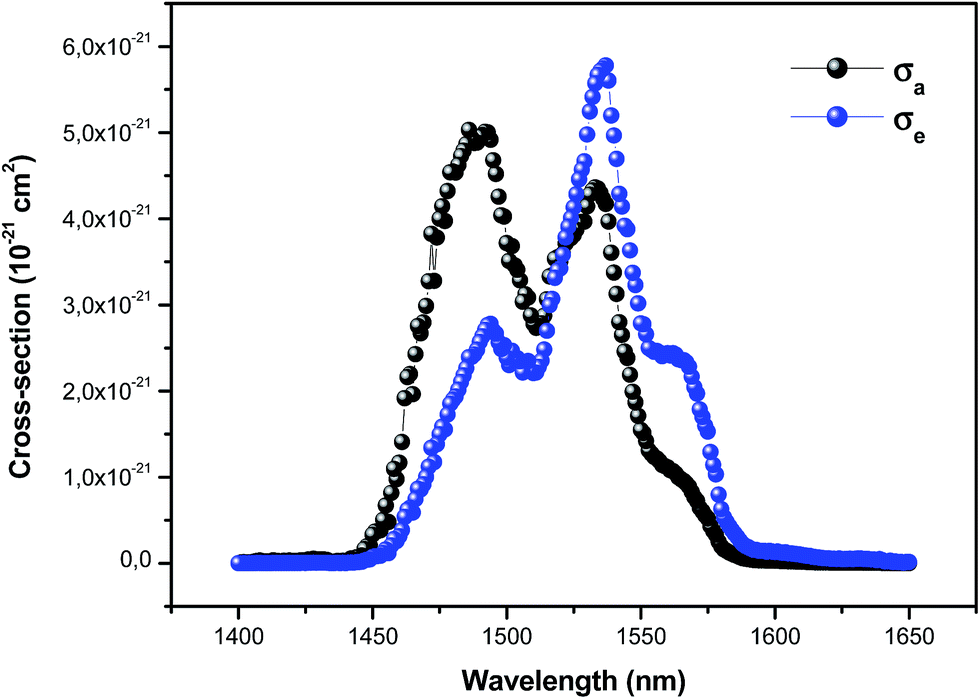 | ||
| Fig. 7 Absorption and emission cross-sections of the 4I13/2 → 4I15/2 transition for the ceramic sample. | ||
As expected, the emission cross-section (σe) supports the increase in luminescence intensity of the 4I13/2 → 4I15/2 transition in the prepared samples. We find that the emission cross-section σe relative to the vitro-ceramic sample is much larger than those of the phosphate,46 bismuth,4 alumino-silicate47 and tellurite16 glasses.
The stimulated emission cross-section (σe) together with the full-width at half-maximum (FWHM) are used to calculate the bandwidth quality factor FWHM × σe, which is an important parameter for the Er3+-doped fiber amplifier (EDFA). Larger values for the FWHM × σe product and longer experimental lifetimes, τmes, imply a wider gain bandwidth and lower pump threshold power. In the present study, the experimental results in Table 4 indicate that the vitro-ceramic sample presents larger bandwidth quality factor (558.21 × 10⁻²¹ cm2 nm) than those of other glass hosts reported in published papers for the Er3+-doped fiber amplifier (EDFA) such as phosphate (179.73 × 10⁻²¹ cm2 nm),46 bismuth (280.60 × 10⁻²¹ cm2 nm),4 alumino-silicate (245.10 × 10⁻²¹ cm2 nm)47 and tellurite glasses (372.06 × 10⁻²¹ cm2 nm)16 which suggests that this glass may be used as a candidate host material for EDFA.
Once the excited state absorption and emission cross section are obtained, the optical gain coefficient (G(λ)) can be derived as a function of the population inversion (P) between the upper (4I13/2) and ground (4I15/2) levels. Assuming that the Er3+ ions are either in the ground state or in the upper state, the gain coefficient (G(λ)) can be calculated by the relation:33
| G(λ) = NEr[Pσe(λ) − (1 − P)σa(λ)] | (13) |
The gain coefficient of the 4I13/2 → 4I15/2 transition calculated for the vitro-ceramic sample as a function of wavelength for different values of P (from 0.0 to 1.0, with an increment of 0.2.) is shown in Fig. 8.
 | ||
| Fig. 8 Gain cross section of the 4I13/2 → 4I15/2 transition in the vitro-ceramic sample as a function of the population inversion. | ||
We observe that the intensity, as well as the width of the gain curve, increases with the population inversion. The same behavior was found for the other prepared samples. Furthermore, the positive gain is obtained when P ≈ 0.2, which indicates a correspondingly lower pump threshold for obtaining the laser operation of 4I13/2 → 4I15/2 transition. Moreover, the bandwidth at P = 0.4 is about 43 nm, which is larger compared to the values found in the conventional silicate based erbium doped fiber amplifiers (EDFA). For population inversion (P) > 40%, the vitro-ceramic sample exhibits a flat gain in the 1500–1630 nm region. This region covers both C (1530–1565 nm) and L (1565–1625 nm) band regions in the optical communication window and provides more channels in the wavelength division multiplex (WDM) networks. For higher values of population inversion (P = 1.0), gain becomes positive both for the L and C bands spreading from 1430 to 1630 nm and exhibits a net gain coefficient of 3.53 cm−1, which is very higher in comparison to those of some tellurite glasses published in the literature.48
IV Conclusion
We report the impact of heat treatment on the dynamics of energy transfer between silver NPs and Er3+ ions co-doped tellurite glass, vitro-ceramic and ceramic. Both X-ray diffraction and Raman spectroscopy indicate the precipitation of crystalline phases after heat treatment in addition to the formation of Ag NPs in the ceramic matrix. The Judd–Ofelt intensity parameters Ωt (t = 2, 4 and 6), spontaneous emission probability (AT), radiative lifetime (τr) and branching ratios (βJJ′) of several Er3+ transitions were calculated from the absorption spectra based on the Judd–Ofelt theory. The results suggest that Er3+ ions have been incorporated into Ag NPs, which intensified the electromagnetic field around the Er3+ ions. Significant enhancement of the PL intensity and PL lifetime, relative to the 4I13/2 → 4I15/2 transition, in addition to the luminescence intensity in the green-red region, with the heat treatment was recorded. The maximum enhancement was observed for the sample heat treated at 450 °C (vitro-ceramic). Such enhancements are mainly attributed to the strong local electric field induced by SPR of silver NPs as the major effect and also to the energy transfer from the surface of silver NPs to Er3+ ions, since the SPR of Ag NPs is in resonance with the excitation energy. Emission cross-section (σe), bandwidth quality factor (FWHM × σe) and gain cross-section (G(λ)) for the 4I13/2 → 4I15/2 transition were successfully calculated based on the emission spectral measurements and the Mc Cumber theory. It was found that the vitro-ceramic sample has good prospects as a gain medium applied for a 1.53 μm broad band and as high-gain erbium-doped fiber amplifiers (EDFA).References
- V. A. G. Rivera, S. P. A. Osorio, Y. Ledemi, D. Manzani, Y. Messaddeq, L. A. O. Nunes and E. Marega Jr, Opt. Express, 2010, 18, 25321 CrossRef CAS PubMed.
- V. A. G. Rivera, Y. Ledemi, S. P. A. Osorio, D. Manzani, F. A. Ferri, S. J. L. Ribeiro, L. A. O. Nunes and E. Marega Jr, J. Non-Cryst. Solids, 2013, 378, 126 CrossRef CAS.
- Y. Qi, Y. Zhou, L. Wu, F. Yang, S. Peng, S. Zheng and D. Yin, J. Lumin., 2014, 153, 40 CrossRef.
- J. Qi, T. Xu, Y. Wu, X. Shen, S. Dai and Y. Xu, Opt. Mater., 2013, 35, 2502 CrossRef CAS.
- T. Som and B. Karmakar, Appl. Surf. Sci., 2009, 255, 9447 CrossRef CAS.
- A. Chiasera, M. Ferrari, M. Mattarelli, M. Montagna, S. Pelli, H. Portales, J. Zheng and G. C. Righini, Opt. Mater., 2005, 27, 1743 CrossRef CAS.
- M. Reza Dousti, M. R. Sahar, R. J. Amjad, S. K. Ghoshal, A. Khorramnazari, A. Dordizadeh Basirabad and A. Samavati, Eur. Phys. J. D, 2012, 66, 237 CrossRef.
- Z. A. S. Mahraz, M. R. Sahar, S. K. Ghoshal, M. R. Dousti and R. J. Amjad, Mater. Lett., 2013, 112, 136 CrossRef.
- H. Fares, I. Jlassi, H. Elhouichet and M. Férid, J. Non-Cryst. Solids, 2014, 396–397, 1 CrossRef CAS.
- H. Fares, I. Jlassi, S. Hraiech, H. Elhouichet and M. Férid, J. Quant. Spectrosc. Radiat. Transfer, 2014, 147, 224 CrossRef CAS.
- W. Stambouli, H. Elhouichet and M. Ferid, J. Mol. Struct., 2012, 1028, 39 CrossRef CAS.
- Powder Diffraction File, Card no. 74-0269, 1992 Database Edition, Joint Committee on Powder Diffraction Standards (JCPDS), Swathmore, PA, USA.
- Powder Diffraction File, Card no. 52-1005, 1992 Database Edition, Joint Committee on Powder Diffraction Standards (JCPDS), Swathmore, PA, USA.
- S. Blanchandin, P. Thomas, P. Marchet, J. Champarnaud-Mesjard and B. Frit, J. Mater. Chem., 1999, 9, 1785 RSC.
- Powder Diffraction File: Card No. 87–597, Database Edition, Inorganic Crystal Structure Database (ICSD).
- I. Jlassi, H. Elhouichet, S. Hraiech and M. Ferid, J. Lumin., 2012, 132, 832 CrossRef CAS.
- A. Chagraoui, A. Chakib, A. Mandil, A. Mandil, A. Tairi, Z. Ramzif and S. Benmokhtar, Scr. Mater., 2007, 56, 93 CrossRef CAS.
- P. A. Thomas, J. Phys. C: Solid State Phys., 1988, 21, 4611 CrossRef CAS.
- I. Kabalci and H. Gökçeb, Acta Phys. Pol., A, 2014, 125, 877 CrossRef.
- T. Sekiya, N. Mochida, A. Ohtsuka and M. Tonokawa, J. Ceram. Soc. Jpn., 1989, 97, 1435 CrossRef CAS.
- I. Shaltout, Y. Tang, R. Braunstein and A. M. Abu-Elazm, J. Phys. Chem. Solids, 1995, 56, 141 CrossRef CAS.
- T. Sekiya, N. Mochida and A. Soejima, J. Non-Cryst. Solids, 1995, 191, 115 CrossRef CAS.
- A. P. Mirgorodsky, T. Merle-Méjean, J.-C. Champarnaud, P. Thomas and B. Frit, J. Phys. Chem. Solids, 2000, 61, 501 CrossRef CAS.
- B. V. R. Chowdari and P. P. Kumari, J. Mater. Sci., 1998, 33, 3591 CrossRef CAS.
- S. Morimoto, J. Non-Cryst. Solids, 2006, 352, 756 CrossRef CAS.
- G. H. Beall and D. A. Duke, J. Mater. Sci., 1969, 4, 340 CrossRef CAS.
- B. R. Judd, Phys. Rev., 1962, 127, 750 CrossRef CAS.
- G. S. Ofet, J. Chem. Phys., 1962, 37, 511 CrossRef.
- W. T. Carnall, P. R. Fields and R. Rajnak, J. Chem. Phys., 1968, 49, 4424 CrossRef CAS.
- S. Tanabe, T. Ohyagi, N. Soga and T. Hanada, Phys. Rev. B: Condens. Matter Mater. Phys., 1992, 46, 3305 CrossRef CAS.
- L. M. Fortes, L. F. Santos, M. Clara Gonçalves, R. M. Almeida, M. Mattarelli, M. Montagna, A. Chiasera, M. Ferrari, A. Monteil, S. Chaussedent and G. C. Righini, Opt. Mater., 2007, 29, 503 CrossRef CAS.
- H. Li, S. K. Sundaram, P. A. Blanc-Pattison and L. Li, J. Am. Ceram. Soc., 2002, 85, 1377 CrossRef CAS.
- H. Fares, H. Elhouichet, B. Gelloz and M. Férid, J. Appl. Phys., 2014, 116, 123504 CrossRef.
- A. Langar, C. Bouzidi, H. Elhouichet and M. Férid, J. Lumin., 2014, 148, 249 CrossRef CAS.
- L. Wetenkamp, G. F. West and H. Tobben, J. Non-Cryst. Solids, 1992, 140, 35 CrossRef CAS.
- W. Stambouli, H. Elhouichet, C. Barthou and M. Férid, J. Alloys Compd., 2013, 580, 310 CrossRef CAS.
- R. R. Jacobs and M. J. Weber, IEEE J. Quantum Electron., 1976, 12, 102 CrossRef.
- C. K. Jorgensen and R. Reisfeld, J. Less-Common Met., 1983, 93, 107 CrossRef.
- M. J. Weber, Phys. Rev., 1967, 157, 262 CrossRef CAS.
- I. Jlassi, H. Elhouichet, M. Ferid and C. Barthou, J. Lumin., 2010, 130, 2394 CrossRef CAS.
- H. Fares, H. Elhouichet, B. Gelloz and M. Férid, J. Appl. Phys., 2015, 117, 193102 CrossRef.
- M. J. Weber, J. D. Myers and D. H. Blackburn, J. Appl. Phys., 1981, 52, 2944 CrossRef CAS.
- D. E. Mc Cumber, Phys. Rev., 1964, 136(4A), A954 CrossRef.
- W. J. Miniscalco and R. S. Quimby, Opt. Lett., 1991, 16, 258 CrossRef CAS PubMed.
- I. Jlassi, H. Elhouichet, M. Ferid, R. Chtourou and M. Oueslati, Opt. Mater., 2010, 32, 743 CrossRef CAS.
- I. Soltani, S. Hraiech, K. Horchani-Naifer, H. Elhouichet and M. Férid, Opt. Mater., 2015, 46, 454 CrossRef CAS.
- A. Polman, J. Appl. Phys., 1997, 82, 1 CrossRef CAS.
- M. V. Vijaya Kumar, K. Rama Gopal, R. R. Reddy, G. V. Lokeswara Reddy and B. C. Jamalaiah, J. Lumin., 2013, 142, 128 CrossRef CAS.
| This journal is © The Royal Society of Chemistry 2016 |