 Open Access Article
Hyaluronic acid-coated poly(D,L-lactide) (PDLLA) nanofibers prepared by electrospinning and coating
J. J.
Ahire
a,
D.
Robertson
b,
D. P.
Neveling
a,
A. J.
van Reenen
b and
L. M. T.
Dicks
*a
aDepartment of Microbiology, University of Stellenbosch, 7602 Matieland, Stellenbosch, South Africa. E-mail: LMTD@sun.ac.za; Fax: +27 21 808 5846; Tel: +27 21 808 5849
bDepartment of Chemistry and Polymer Science, University of Stellenbosch, 7602 Matieland, Stellenbosch, South Africa
First published on 4th April 2016
Abstract
Hyaluronic acid nanofibers (HA/PDLLA) were prepared by coating electrospun poly(D,L-lactide) (PDLLA) with different concentrations of HA. Highest concentration of HA deposited onto PDLLA nanofibers (17% per weight) were obtained by coating with 0.3% (w/v) HA. Coating with 0.5% (w/v) and 0.1% (w/v) HA yielded a deposit of 3.8% and 3% per weight, respectively. All nanofibers were 300–400 nm in diameter and microscopically homogeneous in structure, with traces of HA clearly visible on the surface and in-between the fibers. Examination of the nanofibers with Fourier transform infrared (FTIR) spectroscopy, thermogravimetric analysis (TGA) and differential scanning calorimetry (DSC) revealed changes in the properties of the nanofibers when coated with 0.3% (w/v) HA. Release of HA from HA/PDLLA fibers were at a linear and constant rate. One possible application for HA/PDLLA is the coating of surfaces, such as medical implants, to prevent secondary microbial infections during recovery from surgery.
1. Introduction
Hyaluronic acid (HA), naturally found in all living organisms, is a linear polyanionic polysaccharide composed of repeating disaccharide units of α-1,4-D-glucoronic acid and β-1,3-N-acetyl-D-glucosamine.1 The main function of HA is to maintain the elasticity and water content of connective tissue in joints. The non-toxic, non-inflammatory and non-immunogenic characteristics of HA, in addition to its biodegradability, renders it safe to be used in many medical applications. This includes replacement of joint fluid (thus treatment of arthritis), replacement of eye fluid and the repair of tissue, for instance in wound healing.2–8 Hyaluronic acid reduces nerve impulses and nerve sensitivity and may thus also be used as a natural pain killer.5 Other properties include stimulation of pro-inflammatory mediators and metalloproteinases, inhibition of leukocyte and macrophage migration and regulation of fibroblast proliferation.5 More recently, HA has been investigated as a drug delivery agent.3In its natural form, HA does not interact with cells, but rather act as a lubricant between tissue surfaces. From a practical point, the extraordinary rheological properties of HA that renders it “easily movable” and “pseudo-plastic” may be viewed as a limitation. To overcome the problem, HA was deposited onto fine fibers with a large surface to volume ratio.9 The coating ratio for chitosan fibers was 3.8% per weight. This caused a 25% increase in the swelling of the fibers. The polyelectrolytic nature, high viscosity, even at low concentrations, and high surface tension makes the electrospinning of HA difficult.1,10,11 Coating of nanofibers, on the other hand, has its own challenges, such as finding the concentration of HA that will produce nanofibers with uniform texture.1 Um and co-workers12 electrospun HA into nanofibers by using an air flow of 70 ft3 h−1 at 57 °C. Brenner and co-workers1 used aqueous ammonium solutions to electrospin HA into nanofibers.
Poly(D,L-lactide) (PDLLA) is used in drug delivery systems,13,14 the coating of implants for delivery of growth factors15–17 and in bone tissue engineering.18 Although electrospinning is performed using coaxial, side-by-side and tri-axial processes,19–22 single-fluid electrospinning is still mostly used. In this study, we report on the properties of HA/PDLLA nanofibers produced from single-fluid electrospinning and surface coating of the nanofibers.
2. Experimental
2.1. Materials
Poly(D,L-lactide) (PDLLA, Mw 0.075–0.12 MDa) and poly(ethylene oxide) (PEO, Mw 0.2 MDa) were obtained from Sigma-Aldrich (St. Louis, MO, USA). Hyaluronic acid (sodium salt, Mw ∼0.6–1.1 MDa) was supplied by Novozyme Biopharma (Monza, Milan, Italy) and used without further modifications. N,N-Dimethylformamide (DMF) was from Sigma-Aldrich. All other reagents were of analytical grade.2.2. Electrospinning of nanofibers and coating with hyaluronic acid
PDLLA/PEO nanofibers were electrospun by using the gravity electrospinning process described by Heunis et al.23 and Ahire et al.24 An equal volume of PDLLA and PEO was dissolved by heating in DMF at 40 °C to produce a final concentration of 24% (v/v). The suspension was electrospun into nanofibers by applying a constant electric field of +10 kV to the polymer solution and −5 kV to the collector. The relative humidity was controlled at 50–55%. Nanofibers were air dried at room temperature for 24 h.The PDLLA/PEO nanofibers were immersed in deionised water for 72 h, with water replaced every 24 h. During this process, the more hydrophilic PEO was dissolved to produce a more porous PDLLA nanofiber scaffold. The nanofibers were freeze-dried overnight (Virtis freeze dryer, SP Industries, Gardiner, NY, USA) to remove residual water. Removal of PEO from the nanofibers was confirmed by Fourier transform infrared (FTIR) spectroscopy, differential scanning calorimetry (DSC) and thermogravimetric analysis (TGA).
Coating of the nanofibers with HA was performed according to the method used by Maeda et al.9 In brief, PDLLA nanofibers were immersed into three separate solutions of HA (0.1, 0.3, and 0.5%, w/v) for 72 h. Nanofibers from each solution were gently washed with deionised water to remove excess HA and then freeze-dried, as described elsewhere. The coating ratio was calculated by using the equation.
| Coating ratio (%) = [(WHA/PDLLA − WPDLLA)/WPDLLA] × 100 |
2.3. Scanning electron microscopy (SEM)
The nanofibers were coated with carbon and imaged using the FEI Nova nanoSEM 230 (FEI Company, USA). The diameter of the nanofibers was analysed by using ImageJ software (Scion Corporation, USA).2.4. Fourier transform infrared (FTIR) spectroscopy
Nanofibers were analyzed by means of FTIR spectroscopy operating in ATR (attenuated total reflectance) mode. Measurements were made using a Thermo Scientific, Nicolet iS10 spectrometer (Waltham, MA, USA), equipped with a diamond crystal. Spectra of samples were collected at room temperature between 650 and 4000 cm−1. The spectral resolution was 4 cm−1 and 64 scans were recorded per sample. Data collection and processing were done with Thermo Scientific OMNIC software (Waltham, MA, USA).2.5. Thermogravimetric analysis (TGA)
Thermal stability analysis was conducted on a TA Instruments Q500 thermogravimetric analyzer (Waltham, MA, USA). Nanofiber samples (ca. 2 mg) were analysed under inert nitrogen atmosphere with a constant flow rate of 60 ml min−1. Measurements were done from 25 °C to 600 °C, at a heating rate of 20 °C min−1.2.6. Differential scanning calorimetry (DSC)
DSC studies were conducted using a TA Instruments Q100 calorimeter, calibrated with an indium metal standard according to standard procedures. All analyses were done under nitrogen atmosphere with a gas flow rate of 50 ml min−1. Heating and cooling scan rates were kept constant at 10 °C min−1. Sample mass were 2 mg.2.7. Fiber swelling
Fiber swelling was performed according to the method described by Maeda et al.9 In brief, nanofiber mats were soaked in deionised water for 1 h. Excess water was removed by gentle blotting onto filter paper. The swelling ratio was calculated by using the equation.| Swelling ratio (%) = [(Ws − Wd)/Wd] × 100 |
2.8. Controlled release
The 0.3% HA coated PDLLA nanofibers, weighing approximately 3 mg, were immersed in a solution of deionised water, phosphate buffer saline (PBS, pH 7.3) and 1 M NaCl for 4 h and then transferred to a fresh volume of the respective solutions. Six transfers were made in 24 h, each with 4 h intervals. The air dried fiber mats were coated with gold and studied under a SEM (Leo 1430VP, Zeiss). The concentration of HA released was determined by using the carbazole assay, as described by Bitter and Muir.25 In brief, 100 μl of the eluent was mixed with 500 μl of 25 mM Na2B4O7 in H2SO4 and incubated for 15 min at 95 °C. After 2 min cooling on ice, 20 μl of 0.125% (w/v) carbazole, dissolved in absolute ethanol, was added and samples were incubated for another 15 min at 95 °C. All the samples were cooled at room temperature and transferred to wells in a 96-well microtiter plate (Greiner Bio-one, USA). The plate was read at 550 nm, using a microplate reader (Reader x-Mark, Bio-Rad). A standard curve was constructed with different concentrations (0–110 μg ml−1) HA sodium salt (Mw: 0.6–1.1 MDa).3. Results and discussion
3.1. Electrospinning and coating of nanofibers
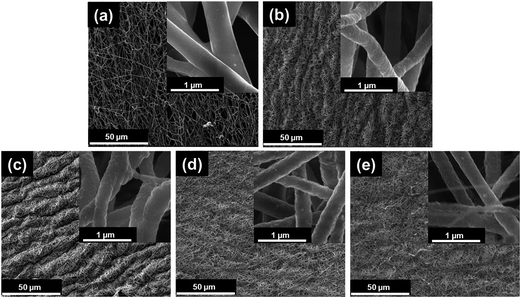
The PDLLA/PEO nanofibers, 400 to 500 nm (avg. fiber diameter; 445 ± 105 nm) in diameter, had a smooth and homogenous texture (Fig. 1a). This corresponded to previous findings.23,24,26–28 After extraction of PEO, the nanofibers decreased to between 300 and 400 nm (avg. 395 ± 68 nm), and appeared more porous and rough with compact arrangements (Fig. 1b). Approximately 35.86% weight loss was recorded after extraction of PEO from PDLLA fibers. The difference in diameter observed amongst uncoated nanofibers and nanofibers coated with 0.1%, w/v (avg. 329 ± 66 nm), 0.3%, w/v (avg. 346 ± 81 nm) and 0.5%, w/v (avg. 334 ± 69 nm) HA (Fig. 1c–e, respectively) may be attributed to the coating process and freeze-drying of the nanofibers. The diameter of HA coated nanofibers was in the range of uncoated PDLLA nanofibers (300–400 nm in diameter). The highest coating ratio (17% per weight) was recorded with 0.3% HA, followed by 3.8% per weight (0.5%, w/v HA) and 3% per weight (0.1%, w/v HA).3.2. FTIR spectroscopy
FTIR analyses confirmed the extraction of PEO from PDLLA/PEO nanofibers and the coating of the fibers with HA. The results, presented in Fig. 2a and b, shows the two regions of interest. Extraction of PEO was confirmed by disappearance of the CH2 wagging vibration peak at 1340 cm−1, which is specific for PEO conformation. A broad peak at 3300 cm−1 was observed for pure HA, which can be attributed to the OH– and NH– groups present in the acid. This peak was present for all PDLLA nanofibers treated with HA, indicating that they were successfully coated. Furthermore, an additional HA peak was visible at 1600 cm−1 in HA-coated fibers, which correlates to the carbonyl (C![[double bond, length as m-dash]](https://www.rsc.org/images/entities/char_e001.gif) O) absorbance of HA. Fibers coated with 0.3% (w/v) HA showed the highest infrared absorbance in both regions (1600 cm−1 and 3300 cm−1), suggesting that these nanofibers contained the highest concentration of HA. Lower FTIR readings were recorded for nanofibers coated with 0.5% (w/v) and 0.1% (w/v) HA (Fig. 2), suggesting that less HA was deposited on these nanofibers. No peaks were observed for pure PDLLA at these wave numbers.
O) absorbance of HA. Fibers coated with 0.3% (w/v) HA showed the highest infrared absorbance in both regions (1600 cm−1 and 3300 cm−1), suggesting that these nanofibers contained the highest concentration of HA. Lower FTIR readings were recorded for nanofibers coated with 0.5% (w/v) and 0.1% (w/v) HA (Fig. 2), suggesting that less HA was deposited on these nanofibers. No peaks were observed for pure PDLLA at these wave numbers.
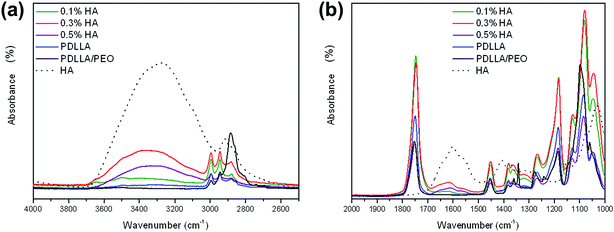 | ||
| Fig. 2 Fourier transform infrared (FTIR) spectra of the various samples at different wavenumber regions: (a) 2500–4000 cm−1, (b) 1000–2000 cm−1. | ||
3.3. Thermogravimetric analysis (TGA)
Thermal stability results are presented by the TGA and DTGA (first derivative) curves of the various samples. The graph presented in Fig. 3a clearly shows multiple weight loss steps for HA. The first step is a characteristic for water loss of approx. 10% up to 180 °C. The second and third steps are characteristic of a two-stage polysaccharide degradation, starting at 180 and 300 °C as shown by a weight loss close to 40% and 10% (Fig. 3a).29 These results suggested that close to 40% of the compounds in HA were thermostable. Two distinctive weight losses were observed for the PDLLA/PEO blend, correlating to the PDLLA and PEO homopolymers, respectively. Each weight loss correlated to the original 50![[thin space (1/6-em)]](https://www.rsc.org/images/entities/char_2009.gif) :
:![[thin space (1/6-em)]](https://www.rsc.org/images/entities/char_2009.gif) 50 wt% blend composition. PDLLA fibers treated with HA resulted in an earlier onset of thermal degradation (Fig. 3a). The individual first derivative peaks of all samples are shown in Fig. 3b. The peak temperatures refer to the point whereby the sample degraded to half of its original weight. When comparing all the HA-coated samples, 0.3% HA had the highest thermal stability and had the smallest effect on the thermal degradation of PDLLA fibers (Fig. 3b). Peak temperatures decreased from 353 °C for PDLLA to 308 °C after coating with 0.5% (w/v) HA (Fig. 3b).
50 wt% blend composition. PDLLA fibers treated with HA resulted in an earlier onset of thermal degradation (Fig. 3a). The individual first derivative peaks of all samples are shown in Fig. 3b. The peak temperatures refer to the point whereby the sample degraded to half of its original weight. When comparing all the HA-coated samples, 0.3% HA had the highest thermal stability and had the smallest effect on the thermal degradation of PDLLA fibers (Fig. 3b). Peak temperatures decreased from 353 °C for PDLLA to 308 °C after coating with 0.5% (w/v) HA (Fig. 3b).
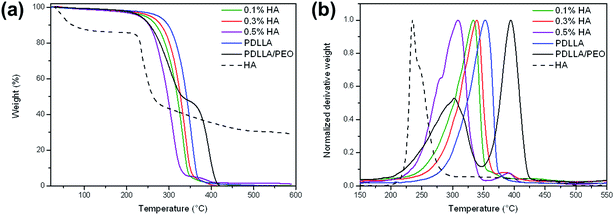 | ||
| Fig. 3 (a) Thermogravimetric analysis (TGA) and (b) first derivative thermogravimetric analysis (DTGA) curves of samples during non-isothermal heating to 600 °C at 20 °C min−1. | ||
3.4. Differential scanning calorimetry (DSC)
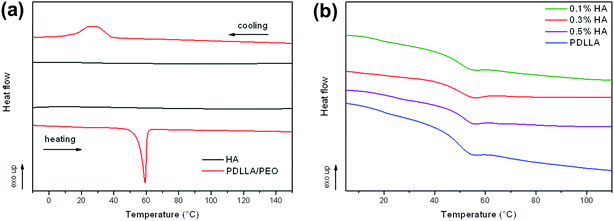
Further thermal analyses performed by differential scanning calorimetry are shown in Fig. 4. Graph (a) shows the thermograms for pure HA and the PDLLA/PEO electrospun blend. A distinct crystalline melting endotherm and crystallization exotherm was visible for the PDLLA/PEO fibers. This may be attributed to the semi-crystalline PEO in the blend. No melting endotherms or crystallization exotherms were observed for PDLLA after extraction of PEO, due to the highly amorphous nature of the polymer. This was confirmed by a large glass transition event at 50 °C, as shown in graph (b), associated with the mobile amorphous regions of PDLLA. Addition of HA had no effect on the Tg temperature, but resulted in a decrease in the magnitude of the glass transition event with 0.3% HA showing the slightest decrease in heat flow when moving through the glass transition temperature range. A less distinct Tg transition suggested that addition of HA lowered the amount of amorphous regions within the polymer, resulting in a slightly more crystalline material. Furthermore, the results suggested that HA incorporation is affected by the polymer matrix. This may be the reason why the thermal stability (observed from TGA) for the treated fibers were the highest at 0.3% (w/v) HA.3.5. Fiber swelling
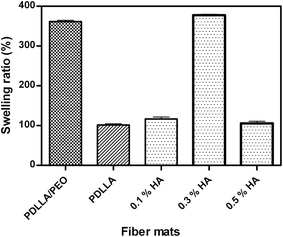
The 0.3% HA treated PDLLA fibers showed highest fiber swelling ratio (377 ± 2.5%), compared to PDLLA/PEO (362 ± 3.0%), PDLLA (101 ± 3.2%), and 0.1% HA (116 ± 4.9%) and 0.5% HA (105 ± 5.1%)-treated PDLLA fibers (Fig. 5). The swelling values obtained with 0.5% HA coated PDLLA fibers are not in agreement with HA coating ratio due to the possible release of HA from PDLLA fibers in deionised water. These results are, however, in agreement with FTIR, TGA and DSC analyses and suggest that 0.3% HA treatment had a unique effect on PDLLA fibers. The stable retention of HA in polymer matrix with 0.3% HA treatment is the possible reason that PDLLA fibers showed highest swelling. The degree of swelling is highly related to the diffusion of hydrophilic or hydrophobic drugs, biocompatibility, and the rates of enzymatic or hydrolytic degradation.303.6. Controlled release
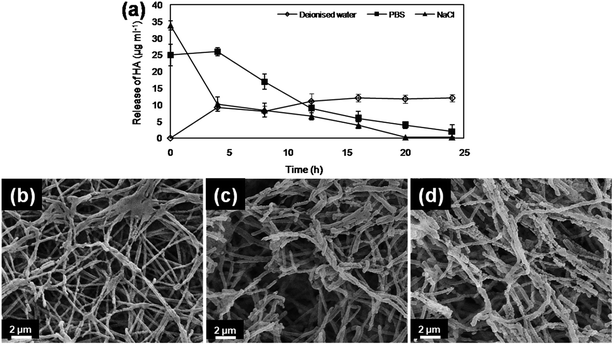
The initial burst release of HA was estimated in NaCl (33.8 ± 1.4 μg ml−1), followed by sustained decline for subsequent hours (Fig. 6a). Similarly, in PBS, HA coated PDLLA fibers showed burst release (24.9 ± 3.2 μg ml−1), followed by sustained decline for subsequent hours (Fig. 6a). In contrast, no initial burst release followed by controlled and sustained release of HA (12 ± 1.1 μg ml−1) was estimated in deionised water for up to 24 h (Fig. 6a). These results suggested retention of HA on or in the PDLLA matrix. The SEM images of HA coated PDLLA fibers after 24 h release study in different media showed variations in morphology (Fig. 6b–d). Fibers from deionised water showed smooth and melted morphologies with little degradation as compared with PBS and sodium chloride (Fig. 6b). The disintegrated fiber structures and rough morphologies of nanofibers are indicative of burst release of HA (Fig. 6c and d). These result correlates well with the estimated release of HA from PDLLA fibers in different media.4. Conclusions
Hyaluronic acid-coated PDLLA fibers were successfully prepared by coating electrospun fibers. A higher coating efficiency (17 wt%) and swelling ratio (377%) of PDLLA fibers were obtained with 0.3% (w/v) HA treatment. Results obtained by FTIR, TGA and DSC confirmed the finding. Controlled release of HA from PDLLA nanofibers suggests that these nanohybrids may be used to coat medical implants.Acknowledgements
Ahire JJ is grateful to Stellenbosch University for a Postdoctoral Fellowship.Notes and references
- E. K. Brenner, J. D. Schiffman, E. A. Thompson, L. J. Toth and C. L. Schauer, Carbohydr. Polym., 2012, 87, 926–929 CrossRef CAS.
- R. Barbucci, S. Lamponi, A. Borzacchiello, L. Ambrosio, M. Fini, P. Torricelli and R. Giardino, Biomaterials, 2002, 23, 4503–4513 CrossRef CAS PubMed.
- M. B. Brown and S. A. Jones, J. Eur. Acad. Dermatol. Venereol., 2005, 19, 308–318 CrossRef CAS PubMed.
- J. M. Medina, A. Thomas and C. R. Denegar, J. Fam. Pract., 2006, 8, 667–675 Search PubMed.
- J. Necas, L. Bartosikova, P. Brauner and J. Kolar, Vet. Med., 2008, 53, 397–411 CAS.
- S. S. Pedrosa and M. Gama, in Hyaluronic acid and its application in nanomedicine, ed. M. H. Gil, Research Signpost, Kerala, India, 2014, pp. 55–89 Search PubMed.
- I. Uthman, J. P. Raynauld and B. Haraoui, Postgrad. Med. J., 2003, 79, 449–453 CrossRef CAS PubMed.
- M. E. Smithmyer, L. A. Sawicki and A. M. Kloxin, Biomater. Sci., 2014, 2, 634–650 RSC.
- N. Maeda, J. Miao, T. J. Simmons, J. S. Dordick and R. J. Linhardt, Carbohydr. Polym., 2014, 102, 950–955 CrossRef CAS PubMed.
- Y. Ji, K. Ghosh, X. Z. Shu, B. Li, J. C. Sokolov, G. D. Prestwich, R. A. F. Clark and M. H. Rafailovich, Biomaterials, 2006, 27, 3782–3792 CrossRef CAS PubMed.
- S. Yao, X. Wang, X. Liu, R. Wang, C. Deng and F. Cui, J. Nanosci. Nanotechnol., 2013, 13, 4752–4758 CrossRef CAS PubMed.
- I. C. Um, D. Fang, B. S. Hsiao, A. Okamoto and B. Chu, Biomacromolecules, 2004, 5, 1428–1436 CrossRef CAS PubMed.
- Q. Ding, Z. Li, Y. Yang, G. Guo, F. Luo, Z. Chen, Y. Yang, Z. Qian and S. Shi, Drug Delivery, 2015, 1–9 Search PubMed.
- Z. Xie, G. Buschle-Diller, P. DeInnocentes and R. C. Bird, J. Appl. Polym. Sci., 2011, 122, 1219–1225 CrossRef CAS.
- T. Fuchs, G. Schmidmaier, C. Surke, S. Quandte, W. Petersen and W. Dusel, in Chirurgisches Forum fur Experimentelle und Klinische Forschung, Springer-Verlag, 2004, pp. 213–216 Search PubMed.
- G. Schmidmaier, B. Wildemann, H. Bail, M. Lucke, T. Fuchs, A. Stemberger, A. Flyvbjerg, N. P. Haas and M. Raschke, Bone, 2001, 28, 341–350 CrossRef CAS PubMed.
- G. Schmidmaier, B. Wildemann, A. Stemberger, N. P. Haas and M. Raschke, J. Biomed. Mater. Res., 2001, 58, 449–455 CrossRef CAS PubMed.
- M. Annunziata, L. Nastri, A. Borgonovo, M. Benigni and P. P. Poli, J. Craniofac. Surg., 2015, 26, 1691–1696 CrossRef PubMed.
- L. Jørgensen, K. Qvortrup and I. S. Chronakis, RSC Adv., 2015, 5, 53644–53652 RSC.
- G. Chen, Y. Xu, D. G. Yu, D. F. Zhang, N. P. Chatterton and K. N. White, Chem. Commun., 2015, 51, 4623–4626 RSC.
- D. G. Yu, K. White, N. Chatterton, Y. Li, L. Li and X. Wang, RSC Adv., 2015, 5, 9462–9466 RSC.
- D. G. Yu, X. Y. Li, X. Wang, J. H. Yang, S. A. Bligh and G. R. Williams, ACS Appl. Mater. Interfaces, 2015, 7, 18891–18897 CAS.
- T. D. J. Heunis, M. Botes and L. M. T. Dicks, Probiotics Antimicrob. Proteins, 2010, 2, 46–51 CrossRef CAS PubMed.
- J. J. Ahire, D. P. Neveling and L. M. T. Dicks, Curr. Microbiol., 2015, 71, 24–30 CrossRef CAS PubMed.
- T. Bitter and H. M. Muir, Anal. Biochem., 1962, 4, 330–334 CrossRef CAS PubMed.
- J. J. Ahire and L. M. T. Dicks, Antimicrob. Agents Chemother., 2014, 58, 2098–2104 CrossRef PubMed.
- J. J. Ahire and L. M. T. Dicks, Probiotics Antimicrob. Proteins, 2015, 7, 52–59 CrossRef CAS PubMed.
- J. J. Ahire, R. Neppalli, T. D. J. Heunis, A. J. van Reenen and L. M. T. Dicks, Curr. Microbiol., 2014, 69, 587–593 CrossRef CAS PubMed.
- L. Lapcik, E. Otyepkova, B. Lapcikova, M. Otyepka, J. Vicek and I. Kupska, in Physiochemical analysis of hyaluronic acid powder for cosmetic and pharmaceutical processing, ed. M. N. Collins, Smithers Rapra Technology, UK, 2014, pp. 89–102 Search PubMed.
- Y. Zhang, C. Y. Won and C. C. Chu, J. Polym. Sci., Part A: Polym. Chem., 1999, 37, 4554–4569 CrossRef CAS.
| This journal is © The Royal Society of Chemistry 2016 |

