Photoelectric properties and potential nitro derivatives sensing by a highly luminescent of Zn(II) and Cd(II) metal–organic frameworks assembled by the flexible hexapodal ligand, 1,3,5-triazine-2,4,6-triamine hexaacetic acid

Shuang Lia, Jian Songa, Jue Chen Nia, Zhi Nan Wanga, Xue Gaoa, Zhan Shib, Feng Ying Baia and Yong Heng Xing*a
aCollege of Chemistry and Chemical Engineering, Liaoning Normal University, Huanghe Road 850#, Dalian 116029, P.R. China. E-mail: xingyongheng2000@163.com; Tel: +86-411-82156987
bState Key Laboratory of Inorganic Synthesis and Preparative Chemistry, College of Chemistry, Jilin University, Changchun 130012, P.R. China

Received 22nd January 2016 , Accepted 5th April 2016

First published on 6th April 2016


Abstract

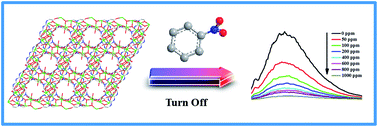
Two new coordination polymers, [Cd43-O)(TTHA)(H2O)2]·3H2O (1) and [Zn5Na2(TTHA)2(H2O)10] (2), based on the flexible hexapodal ligand 1,3,5-triazine-2,4,6-triamine hexaacetic acid (H6TTHA), have been synthesized under hydrothermal condition. The two coordination polymers were characterized by the elemental analysis, IR spectroscopy, PXRD, thermogravimetric analysis and UV-vis spectroscopy. The single crystal X-ray diffraction analysis revealed that coordination polymer 1 exhibited a 2D sheet structure, which was arranged alternately by two different types of building blocks (Cd4O6 and Cd2O2), and 2 possessed a fascinating 3D network framework with three different types of the building blocks (Zn4(COO)6O8N2, Zn(COO)4 and Na(COO)4O2). In the structures, all of the coordination modes of the ligand were firstly discovered, which are μ8–η1η1η1η3η2η1η2η1η2η1η2 and μ9–η1η1η1η1η1η1η1η1η2ηN1η2η1, respectively. In order to furthermore expand functional characteristics of both the coordination polymers 1 and 2, we also carried out experiments of the surface photovoltage spectroscopy (SPS) and electric-field-induced surface photovoltage spectroscopy (EFISPS), which showed that 1 and 2 could behave as p-type semiconductors. What's more, the fluorescence sensing experiments showed the luminescent quenching of the coordination polymers 1 and 2 were especially obvious with the increasing of the nitro derivatives concentration, even if the nitro derivatives were at a very low concentration, which can also be detected, that indicating both coordination polymers 1 and 2 have very high sensitivity sensing properties.

Introduction

Metal–organic frameworks (MOFs) are porous inorganic–organic hybrid materials, which are often regarded as a subclass of coordination polymers, and constructed by metal ions or clusters and organic ligands linked via coordination bonds to form infinite systems.1–5 Furthermore, the 2D and 3D structures of MOFs can exhibit nano-sized cavities and/or open channels. In recent years, the MOFs have attracted an enormous of researching attentions because of their potential applications on the attractive magnetism, ion exchange, semiconducting, optoelectronic, luminescence and catalytic properties.6–12 However, the aim of obtaining the desirable architectures of the coordination polymers constructed by the carboxylate ligands and metal ions are still a long-term challenge for chemists due to the difficult prediction of either the compositions or the structures of the reaction products, especially those from flexible ligands, the reasons are as follows: (i) the factors governing the reaction and formation of the hydrothermal product are complicated, such as solvents, reaction temperature, pH value and so on; (ii) the architectures and functionality of MOFs are strongly influenced by the flexibility, length, coordination ability and symmetry of carboxylate ligands with their flexibility and conformational freedom in the assembly process. In the construction of the new inorganic–organic framework networks, the carboxylate ligands are of special interest.13 More and more carboxylate ligands based on iminodiacetic acid were reported because of flexible iminodiacetic acid as a chelating ligand to design and construct of various functional materials.14 Among of them, an intriguing carboxylate organic ligand, 1,3,5-triazine-2,4,6-triamine hexaacetic acid (Scheme 1) is a classical example, which has attracted our attention. The H6TTHA has a planar triazine core with three symmetrically placed metal-complexion flexible aminodiacetate arms. Due to its flexibility, the six arms could show significant deviation from the central triazine ring. Meanwhile, its degree of protonation affects the number of the functional coordination sites. When it assembles with metal salts, as a hexapodal ligand, H6TTHA can form novel coordination polymers possessing microporous structures and excellent properties. So far, a series of coordination polymers constructed from the 1,3,5-triazine-2,4,6-triamine hexaacetic acid containing three iminodiacetic acid groups, which can adopt versatile conformations according to the geometric requirements of different metal ions, have been continually reported. Such as {Na2[Co3(H2TTHA)2(H2O)12](H2O)2}·4(H2O), {Na[Cu4(H2TTHA)(HTTHA)(H2O)8](H2O)3}·5(H2O), [Cd3(TTHA)(H2O)4], [Ca5(HTTHA)2(H2O)8], [Yb2(TTHA)(H2O)2], [Ln2(TTHA)(H2O)4]·9H2O (Ln = Eu, Tb, Gd, and Dy) and so on.15,16 Due to the special nature of the ligand, there are many potential applications, such as diagnostic tools, luminescence sensors, and gas storage.15a,b One of the most important properties is the photoluminescent property. As we known, nitro derivatives, the most important chemical intermediates, have been widely used for dye, pharmaceuticals, and pesticide in recent years.17 It is also well-known as an explosive and highly toxic contaminant with broad range of detriment.18 Therefore, the sensitive and selective detection of nitro derivatives are very necessary. Up to now, many methods have been reported (e.g. canines and sophisticated instrumental methods) for nitro derivatives detection is inconvenient and not always available.11b,19,20 Thus, to solve these problems, exploring the luminescent MOFs for sensing nitro derivatives is of great significance.
image file: c6ra01933a-s1.tif
Scheme 1 The molecular structure of H6TTHA.

Herein, we have utilized the ligand, 1,3,5-triazine-2,4,6-triamine hexaacetic acid (H6TTHA) to construct two new coordination polymers, [Cd43-O)(TTHA)(H2O)2]·3H2O (1) and [Zn5Na2(TTHA)2(H2O)10] (2). Both of coordination polymers were characterized by X-ray single-crystal structural analysis, elemental analysis, IR spectroscopy, TG, and PXRD. To explore their potential values in practical applications, the encouraging surface photoelectric properties [surface photovoltage spectroscopy (SPS) and electric-field-induced surface photovoltage spectroscopy (EFISPS)] and the photoluminescence (PL) sensing property for nitro derivatives detection were investigated in detail.

Experimental

Materials and methods

All chemicals purchased commercially were of reagent grade or better and used without further purification. The ligand 1,3,5-triazine-2,4,6-triamine hexaacetic acid (H6TTHA) was synthesized according to the method described in the literatures.16a,21 Elemental analyses of C, H, and N were conducted on a Perkin-Elmer 240C automatic analyzer at the analysis center of Liaoning Normal University. All IR measurements were obtained using a Bruker AXS TENSOR-27 FT-IR spectrometer with pressed KBr pellets in the range of 400–4000 cm−1 at room temperature. UV-vis-NIR spectra for two coordination polymers, and the H6TTHA ligand were recorded on a JASCO V-570 UV/VIS/NIR microspectrophotometer (200–2500 nm, in the form of solid sample). Thermogravimetric analysis (TG) was performed on a Perkin Elmer Diamond TG/DTA under the conditions of the N2 atmosphere in the temperature range from 30 to 1000 °C. X-ray powder diffraction patterns were obtained on a Bruker Advance-D8 equipped with Cu Kα radiation, in the range 5° < 2θ < 55°, with a step size of 0.02° (2θ) and an count time of 2 s per step. The photoluminescent properties of the coordination polymers 1 and 2 were measured in the solid state and in different solvent emulsions on a JASCO FP-6500 spectrofluorimeter at room temperature. Surface photovoltage spectroscopy (SPS) and electric field-induced surface photovoltage spectroscopy (EFISPS) measurements were conducted on a powdered sample in a sandwich cell (ITO/sample/ITO) with the light source-monochromator-lock-in detection technique. The electrode is made of optical glass coated with indium and tin oxides (ITO). Standard p-type silicon flakes were used to adjust the comparative phase, and a xenon lamp was used as an illuminator to supply radiation in the range of 300–800 nm.

Synthetic procedures

[Cd43-O)(TTHA)(H2O)2]·3H2O (1). Cd(NO3)2·4H2O (0.0616 g, 0.20 mmol) and H6TTHA (0.0474 g, 0.10 mmol) were dissolved in the distilled water (6 ml) in the glass vessel and stirred for 1 h at room temperature, which was adjusted to an acidity of pH = 5.5 by adding the solution of 4 M KOH (0.12 ml). Then the white suspension was transferred into a 23 ml Teflon-lined stainless steel autoclave and heated at 120 °C for 3 days, then allowed to crystallize over 2 days at room temperature. Colorless single crystals were obtained from the colorless resulting solution, which could be isolated with a yield of 70% based on Cd2+ after filtration and washing thoroughly with distilled water. Elemental analysis (%) calcd. For C15H22N6O18Cd4: C, 17.60; H, 2.15; N, 8.20. Found: C, 17.70; H, 2.28; N, 8.27. IR data (KBr, cm−1): 3455(s, br), 2947(m), 1625(m), 1590(s), 1541(s), 1500(s), 1417(m), 1397(s), 1304(s), 1189(s), 960(s), 898(m), 806(w), 723(w), 625(w), 544(w).
[Zn5Na2(TTHA)2(H2O)10] (2). Zn(Ac)2·2H2O (0.0220 g, 0.1 mmol), H6TTHA (0.0237 g, 0.05 mmol) and distilled water (6 ml) were put into a glass vessel and stirred for 1 h at room temperature, which the solution was clear and the acidity of pH = 5. Then the solution was kept at 100 °C for 6 h. And the colorless crystals were found in the bottom of the bottle, washed with distilled water, and used for the X-ray diffraction determination. Yield: 65% on the basis of Zn2+. Elemental analysis (%) calcd. For C30H44N12O34Na2Zn5: C, 24.19; H, 2.95; N, 11.28. Found: C, 24.09; H, 2.88; N, 11.35. IR data (KBr, cm−1): 3425(s, br), 2933(m), 1608(s), 1566(s), 1541(s), 1482(s), 1452(m), 1385(s), 1315(s), 1271(m), 1197(m), 984(m), 903(m), 814(w), 738(w), 635(w), 443(w).

X-ray crystal structure determination

Single crystals of suitable dimensions for the coordination polymers 1 and 2 were mounted on glass fibers for the X-ray structure determinations. Reflection data were collected at room temperature on a Bruker AXS SMART APEX II CCD diffractometer with graphite monochromatized Mo Kα radiation (λ = 0.71073 Å). A semiempirical absorption correction was applied by the program SADABS.22 The program suite SHELXTL-97 was used for space-group determination (XPREP), direct method structure solution (XS), and least-squares refinement (XL).23 All non-hydrogen atoms were refined with anisotropic displacement parameters. The positions of the hydrogen atoms around the carbon atoms were included using a riding model. The hydrogen atoms bound to oxygen atoms from the aqua molecules were found on Fourier difference maps. Crystal data and structure refinement parameters are given in Table 1, selected bond lengths of the coordination polymers 1 and 2 are listed in Table 2 and the bond angles of 1 and 2 are listed in Table S1.
Table 1 Summary of crystal data and refinement results for coordination polymers 1 and 2
  1 2
a R = ∑||Fo| − |Fc||/∑|Fo|, wR2 = [∑w(Fo2Fc2)2/∑w(Fo2)2]1/2; |Fo| > 4σ(|Fo|).b Based on all data.
Chemical formula C15H22N6O18Cd4 C30H44N12O34Na2Zn5
M (g mol−1) 1023.99 1489.60
Crystal system Triclinic Orthorhombic
Space group P[1 with combining macron] Pbca
a (Å) 10.8877(12) 9.7965(5)
b (Å) 11.9296(13) 19.2984(10)
c (Å) 11.9776(14) 24.7574(12)
α (deg) 70.521(2) 90
β (deg) 64.3220(10) 90
γ (deg) 64.679(2) 90
V3) 1246.3(2) 4680.6(4)
Z 2 4
Dcalc (Mg m−3) 2.729 2.114
Crystal size (mm) 0.45 × 0.30 × 0.24 0.45 × 0.38 × 0.30
F (000) 980 3008
μ (Mo Kα) mm−1 3.468 2.670
θ (deg) 1.92 to 28.31 2.27 to 28.35
Reflections collected 9332 27[thin space (1/6-em)]817
Independent reflections 6159(4030) 5694(3616)
Parameters 373 409
Rint 0.0450 0.0818
Δ(ρ) (e Å−3) 1.325 and −1.299 1.018 and −0.824
Goodness of fit 1.027 1.009
Ra 0.0535 (0.0957)b 0.0472 (0.0975)b
wR2a 0.0962 (0.1154)b 0.0872 (0.1015)b


Table 2 Selected bond lengths (Å) and angles (deg) for coordination polymers 1 and 2a
1
a Symmetry codes: for 1: A = −x, −y + 1, −z; B = −x, −y + 1, −z + 1; C = x, y, z − 1; D = −x + 1, −y + 1, −z + 1; for 2: A = x + 1/2, −y + 1/2, −z + 1; B = x − 1/2, −y + 1/2, −z + 1; C = −x + 2, −y + 1, −z + 1; D = −x + 3/2, y + 1/2, z; C = −x + 2, −y + 1, −z + 1; E = −x + 1/2, y + 1/2, z; F = x − 1/2, y, −z + 3/2; G = x − 1, y, z.
Cd1–O12C 2.256(6) Cd1–O1 2.259(5) Cd1–O1A 2.274(5)
Cd1–O8 2.287(6) Cd1–O2 2.385(6) Cd1–O13B 2.455(6)
Cd2–O5 2.211(5) Cd2–O4 2.234(6) Cd2–O3 2.309(6)
Cd2–O10D 2.379(6) Cd2–O6D 2.424(6) Cd2–O6 2.510(6)
Cd3–O13B 2.215(5) Cd3–O7B 2.219(5) Cd3–O5B 2.263(5)
Cd3–O2 2.319(6) Cd3–O7 2.383(5) Cd4–O1B 2.169(5)
Cd4–O5 2.234(5) Cd4–O15B 2.265(6) Cd4–O9D 2.323(6)
Cd4–O4D 2.495(6)        
[thin space (1/6-em)]
2
Zn1–O6A 1.948(3) Zn1–O7A 1.950(3) Zn1–O1 1.955(3)
Zn1–O3B 1.955(3) Zn2–O11 1.997(3) Zn2–O9 2.019(3)
Zn2–O15 2.034(3) Zn2–O4D 2.111(3) Zn2–O16 2.119(3)
Zn2–N6 2.505(3) Zn3–O13C 1.784(5) Zn3–O13 1.925(5)
Zn3–O14C 2.068(4) Zn3–O10 2.134(4) Zn3–O14 2.422(4)
Na1–O12 2.337(4) Na1–O8 2.417(4) Na1–O5E 2.426(3)
Na1–O11F 2.445(3) Na1–O16G 2.723(4)    


Results and discussion

Synthesis

We synthesized two coordination polymers [Cd43-O)(TTHA)(H2O)2]·3H2O (1) and [Zn5Na2(TTHA)2(H2O)10] (2) under the hydrothermal condition. To explore the optimal condition of the reaction, a series of works have been done. For 1, we originally mixed the metal salt [Cd(NO3)2·4H2O, 0.0167 mol L−1] and ligand [H6TTHA, 0.0083 mol L−1] for getting the desirable compound. However, only the microcrystal solid was obtained, which was not suitable to determine the single-crystal structure. So, we changed the molar concentration of the metal salt and ligand, the result found that when the molar concentration of the Cd(NO3)2·4H2O and ligand H6TTHA were double, that is to say, when the molar concentration of the Cd(NO3)2·4H2O was 0.0333 mol L−1 and the ligand was 0.0167 mol L−1, the good crystal of 1 suitable to X-ray the single-crystal structural determining was obtained. As to 2, the molar concentration of the metal salt and the ligand were 0.0167 mol L−1 and 0.0083 mol L−1, which was the most appropriate concentration for growing crystals of the compound. According to the reaction processes of the two coordination polymers, it was discovered that the molar concentration of the metal salt and the ligand is a sensitive reaction parameter. Surprisingly, we did not add any material containing sodium salt during the synthesis of 2, however, in the crystal structure, it includes sodium ion, which may come from impurity of the ligand. This is because that in the synthesis of the ligand (H6TTHA), we added NaOH solution to adjust the pH of the reaction system for getting the ligand (H6TTHA). So, in order to prove the point, we have designed two new experiments, one is mixing the metal salt [Zn(Ac)2·2H2O] and the better purified H6TTHA ligand to react, but we couldn't obtain the corresponding compounds. Another is that mixing the corresponding metal salt and the better purified H6TTHA ligand to carry out the reaction with a small amount of NaOH solution (5 mol L−1) to adjust the pH of the reaction system, and we finally got the same 2. In addition, 1 was synthesized under the condition of 120 °C and 2 was at 100 °C, which indicated that the temperature is also one of the important factors to the successful synthetic the coordination polymers.

Structure escriptions

[Cd43-O)(TTHA)(H2O)2]·3H2O (1). Single-crystal X-ray diffraction reveals that coordination polymer 1 is a 2D network, and the molecular structure consists of four independent Cd(II) centers, one TTHA6− ligand, one three bridging oxygen atom, two coordination water molecules and three lattice water molecules (Fig. 1a). The Cd1 adopts distorted pentagonal bipyramid [CdO7] coordination geometry with three oxygen atoms from coordinated water molecular (O1, O1A and O8) and four from carboxylate groups (O2, O11C, O12C and O13B). Different from Cd1, the Cd2, Cd3 and Cd4 atoms are both located in [CdO6] octahedral coordination environments with six oxygen atoms. Among them, five oxygen atoms around the Cd2 and Cd3 are from carboxylate groups. For Cd4, four oxygen atoms are from the carboxylate groups and one is from coordinated water molecular. The remained oxygen atom (O5) as the μ3-bridging atom links Cd2, Cd3 and Cd4. The bond lengths of Cd–O are in the ranges from 2.163 to 2.511 Å, which are comparable with corresponding those of the related cadmium compounds.15b
image file: c6ra01933a-f1.tif
Fig. 1 (a) Perspective view of the coordination environment around the cadmium atoms, symmetry codes: A, −x, 1 − y, −z; B, −x, 1 − y, 1 − z; C, x, y, −1 + z; D, 1 − x, 1 − y, 1 − z. (b) The 2D skeleton of the compound 1. (c) The 2D structure of the compound 1. Hydrogen atoms and solvent molecules are omitted for clarity.

As depicted in the Scheme 2a, the ligand is completely deprotonated. Because of the flexibility, the six of –CH2 (COOH) groups, like the arms, show significant deviation from the central triazine ring, and none of them is coplanar with the triazine ring. All of them are located above the plane of the triazine ring, restraining it from extending in the other direction, which may be the cause of the 2D network. In addition, the carboxylate groups of the TTHA6− ligand exhibit prosperous coordination modes, five different coordination modes are observed: chelating/bridging tetradentate, chelating/bridging tridentate, bridging tridentate, synsyn bridging and chelating bidentate. Herein, we adopted the currently approved notation, based on Greek letters μ and η, to describe the bonding modes of TTHA ligand. Thus, the coordination mode of the carboxylates of the ligand is μ8–η1η1η1η3η2η1η2η1η2η1η2, connecting eight Cd2+ centers.


image file: c6ra01933a-s2.tif
Scheme 2 The conformations and coordination modes of the ligand TTHA: (a) in coordination polymer 1, (b) in coordination polymer 2.

Intriguingly, Cd2, Cd3 and Cd4 are connected by two different building blocks alternately to form 1D chain. The two building blocks (Cd4O6 and Cd2O2), one is composed of Cd2 and Cd4 with the surrounding oxygen atoms (O4, O5, O6), shaped like a cube of the absence a vertex and the other is like a rhombus being composed of two Cd3 and two O7 oxygen atoms. The inorganic chains linked by another building block [Cd2O2], which composed of two Cd1 and two O1 oxygen atoms, form a 2D layer skeleton (Fig. 1b). The Fig. 1c is a 2D network structure of coordination polymer 1.

[Zn5Na2(TTHA)2(H2O)10] (2). As shown in Fig. 2a, the asymmetric unit of coordination polymer 2 includes one TTHA6− ligand, two and a half Zn atoms, one Na atom and five lattice water molecules. Zn1 possesses tetrahedral coordination geometry with four oxygen atoms (O1, O3B, O6A and O7A) from carboxylate groups. Both Zn2 and Zn3 adopt octahedral coordination geometry. For the Zn2, the coordination sphere is completed by one nitrogen atom (N6), three oxygen atoms (O4D, O9 and O11) from carboxylate groups and two (O15, O16) from coordinated water molecules, whereas, the coordination sphere of the Zn3 is completed by two oxygen atoms (O9, O10) from carboxylate groups and four (O13, O13C, O14, O14C) from coordinated water molecules. And the Na1 has a slightly distorted octahedral coordination geometry filled with four oxygen atoms (O5E, O8, O11F, O12) carboxylate groups of TTHA6− ligand and two (O16G, O17) from water molecules. The bond lengths of Zn–O and Na–O are in the ranges from 1.784 to 2.422 Å and 2.337 to 2.723 Å, respectively, and the bond length of Zn–N is 2.505 Å, which are comparable with those of the other similar compounds.15b,c
image file: c6ra01933a-f2.tif
Fig. 2 (a) Perspective view of the coordination environment around the zinc and sodium atoms, symmetry codes: A, 0.5 + x, 0.5 − y, 1 − z; B, −0.5 + x, 0.5 − y, 1 − z; C, 2 − x, 1 − y, −1 − z; D, 1.5 − x, 0.5 + y, z; E, 0.5 − x, 0.5 + y, z; F, −0.5 + x, y, 1.5 − z; G, − 1 + x, y, z. (b) The 2D layered structure. (c) The 3D structure of compound 2. Hydrogen atoms and solvent molecules are omitted for clarity.

In the Scheme 2b, the ligand is also completely deprotonated in the coordination polymer 2, and shows more obvious flexibility, compared with the 1. In the ligand, the two arms connecting to the same nitrogen atom are arranged above and below the triazine plane, respectively. The adjacent arms bend in the same direction when they adopt different coordination modes, while in other conditions the arms bend in opposite directions to the triazine plane, which may reduce the stereospecific blockade. The carboxylate moieties feature three coordination modes in the TTHA6− ligand, chelating/bridging tridentate, synanti bridging and monodentate, and a tertiary amine nitrogen atom is also involved in the coordination with metal centers. The ligand functions as a μ9-bridge, connecting nine metal centers, and the coordination mode of the whole ligand is the μ9–η1η1η1η1η1η1η1η1η2ηN1η2η1.

In the extended structure (Fig. 2b), the two different building blocks [Zn4(COO)6O8N2] and [Zn(COO)4] are connected alternately by the triazine ring to form a 2D layer structure. Then, the 2D layer structure is further bridged by another building block [Na(COO)4O2] extending to a 3D network structure (Fig. 2c).

Comparison of TTHA conformations and coordination modes

So far, a series of the coordination polymers constructed by 1,3,5-triazine-2,4,6-triamine hexaacetic acid (H6TTHA) containing three iminodiacetic acid groups, which can adopt versatile conformations according to the geometric requirements of different metal ions, has been continually reported.20,21 We have got two novel coordination polymers, and to be our surprised, the ligand in the structures of 1 and 2 exhibits distinctly different coordination modes. The coordination mode of the whole TTHA ligand is μ8–η1η1η1η3η2η1η2η1η2η1η2, connecting eight metal centers, and μ9–η1η1η1η1η1η1η1η1η2ηN1η2η1, connecting nine metal centers, respectively. What's more, compared with the reported correlative literatures, the coordination modes of carboxylate groups are completely different. In addition, the carboxylate groups of the H6TTHA ligand exhibit distinctly different coordination modes in 1 and 2. As shown in the Scheme 3, firstly, we have found that the all carboxylate groups of the TTHA ligand exhibit five different coordination modes: μ1–η1η1, μ2–η1η1, μ2–η2, μ3–η2η1, and μ3–η1η3 in 1. It includes two two-bridging oxygen atoms, two three-bridging oxygen atoms. And for 2, all carboxylate groups have four coordination modes: μ1–η1, μ2–η1η1, μ2–η2η1, and μ3–η1η2. It contains two two-bridging oxygen atoms, one three-bridging oxygen atom. And the weaker M–Namine chelation is also involved. We listed carboxyl coordination modes of the H6TTHA reported in correlative literatures (Scheme 4), and ten different coordination modes: μ1–η1, μ1–η1η1, μ2–η1η1, μ2–η2, μ2–η2η1, μ3–η2η1, μ3–η2η2, μ3–η3, μ4–η3η1, and μ1–ηN1. Secondly, for 1, the whole ligand acts as a μ8-bridge, connecting eight metal centers. And for 2, the whole ligand acts as a μ9-bridge, connecting nine metal centers. Thirdly, the structure of the coordination polymer 1 is a 2D layered structure, and 2 is a 3D network structure, the main reason is that, the six of –CH2(COOH) groups are located above the plane of the triazine ring, restraining it from extending in the other direction and the two arms connecting to the same nitrogen atom are arranged above and below the triazine plane in the coordination polymer 1.
image file: c6ra01933a-s3.tif
Scheme 3 The carboxylate groups coordination modes of TTHA6− ligand in the coordination polymers 1 and 2.

image file: c6ra01933a-s4.tif
Scheme 4 The carboxylate groups coordination modes of TTHA6− ligand in the literatures.

Infrared spectroscopy

The IR spectra of 1 and 2 were shown in Fig. S1. The broad absorption bands appearing at 3455 cm−1 of coordination polymer 1 indicates the presence of water molecules (for 2 is 3425 cm−1). The peaks around 2947 and 2933 cm−1 are attributed to the –CH2– stretching modes. Absorption at 1625, 1397 cm−1 of 1 and 1608, 1385 cm−1 of 2 are assigned to the asymmetrical stretching vibration and symmetrical stretching vibration of C[double bond, length as m-dash]O bond, respectively. The bands between 1400 and 1600 cm−1 are attributed to the skeletal vibrations of the organic aromatic rings.

Thermal properties

To examine the thermal stability of the coordination polymers, thermogravimetric analysis (TG) was carried out. And the thermalgravimetric curves of 1 and 2 are shown in Fig. S2. For 1, the first loss-weight is observed at 36 °C and completed at 270 °C, which is in good agreement with the loss of three lattice water molecules (obs: 5.21%, calcd: 5.27%). The second loss-weight is observed at 348 °C and completes at 1000 °C, which is in good agreement with the decomposition of the triazine ring and two coordinated water molecules (obs: 44.59%; calcd: 44.73%). The final remaining weight is 50.0%, which is in good responding to the formation of CdO (calcd 50.2%). And the thermogravimetric curve of coordination polymer 2 exhibited an immediate weight loss on heating is completed from 133 °C up to 215 °C, which can be attributed to the loss of ten coordinated water molecules (obs: 12.13%; calcd: 12.08%). From then on, almost no loss is observed until 358 °C, at which the compound begins to decompose. The second weight loss step up to 754 °C attributed to the removal of the two TTHA6− ligands (obs: 56.49%; calcd: 56.57%). The final remaining is a mixture of ZnO and Na2O (obs. 31.38%, calcd 31.35%).

PXRD analysis

In order to confirm whether the crystal structures were truly representative of the bulk materials, the PXRD patterns of the coordination polymers 1 and 2 were recorded, as shown in the Fig. S3. Compared with the corresponding simulated single-crystal diffraction data, all the peaks present in the measured patterns closely match in the simulated patterns generated from single crystal diffraction data, which indicates that 1 and 2 are in pure phases.

UV-vis spectra

As shown in the Fig. S4, the absorbance peaks are observed at values around 414 nm for the LMCT transition in the spectra of 1 and 2. The other three absorption peaks appearing at about 218, 256 and 318 nm are associated with the π → π* transition of the ligand, which are similar to the absorbance spectra of H6TTHA ligand. In addition, the band gap of the H6TTHA ligand and the two coordination polymers were calculated (Fig. S5), and the values are 4.61, 4.31, and 4.30 eV, respectively. From these data, we can see that the band gap of the ligand is bigger than that of the two coordination polymers, which was mainly due to the existence of electronic transitions from the ligand to the metals.

Surface photovoltage properties

The surface photovoltage spectroscopy (SPS) is a separation technology of the surface charge characteristics, which can be used to study the photophysical and excited state of the sample.24 The character of photovoltaic response of organic semiconductor, inorganic semiconductor, organic/inorganic semiconductor and the transition or diffusion of electron on the surface of the solid sample could be detected via SPS.25 It is significant for exploring on electronic transition of surface and interface because it not only relates to the electronic transition under light-induced, but also reflects the separation and diversion of photo-generated charge. By studying SPS of the samples, we can not only understand the electron transition behaviour on surface but also make a judgement of the type of a semiconductor sample.26

The SPS signals of the coordination polymers 1 and 2 are shown in the Fig. 3, which presents almost the same shape with the response area varying from 300 to 500 nm, which all appear as the positive SPV, the response band is at 332 nm, which can be attributed to the π → π* transition of ligand with comparison of the response band of the ligand.


image file: c6ra01933a-f3.tif
Fig. 3 The SPS of coordination polymers 1 and 2.

On the basis of the principle of SPS, Wang et al. have developed an electric-field-induced surface photovoltage spectroscopy (EFISPS) technique, which they have used to investigate in depth the photoelectric properties of semiconductors under the effect of an external electric field.27 Electric-field-induced surface photovoltage spectroscopy (EFISPS) is a mean to adjudge the type of the semiconductor and it can be measured by applying an external electric field to the sample with a transparent electrode.28–33 The EFISPS of coordination polymers 1 and 2 are shown in the Fig. 4. The intensities of the peaks all increased when the positive electronic (+0.2 V) field was applied, whereas, they reduced when the negative electronic field (−0.2 V) was applied. So, it means that 1 and 2 both behave as p-type semiconductors.


image file: c6ra01933a-f4.tif
Fig. 4 The EFISPS: (a) for 1, (b) for 2.

Photoluminescent (PL) properties and detection for nitro derivatives

The fluorescence of inorganic–organic coordination polymers has been currently drawing significant attention in the development of fluorescent materials. As shown in the Fig. 5, due to the conjugative ligand H6TTHA exhibits strong emission peak at 378 nm (λex = 262 nm) which is assigned to the π* → n or π* → π transition. The solid-state emission spectrum of the coordination polymer 1 at room temperature displays an intense emission band centered on 363 nm with excitation maximum at 268 nm; for 2, the emission peak is 364 nm with the excitation wavelength of 268 nm. The luminescent bands are blue-shifted compared with the TTHA ligand, which may be attributed to change electron cloud intensity of the central triazine ring due to coordinate with metals.
image file: c6ra01933a-f5.tif
Fig. 5 Luminescent spectra of the ligand H6TTHA (λex = 262 nm), and 1 and 2 (λex = 268 nm) in the solid state.

To examine the potential sensing activity of the 1 and 2 toward small molecules, their luminescence properties are investigated in different solvent with emulsions (λex = 268 nm). Taking 2 mg from grinding samples 1 and 2, respectively, and then immersed in the corresponding organic solvents (3 ml). After treated by ultrasonication for 30 minutes, the samples were suspended in different solvents and changed into emulsions. A series of organic solvents include N,N-dimethylformamide (DMF), acetonitrile (ACN), trichloromethane (CHCl3), dimethylsulphoxide (DMSO), tetrachloromethane (CCl4), deionized water (H2O), N,N-dimethylacetamide (DMA), and nitrobenzene (NB). The experimental results show that the emission intensities are different extent decrease in various solvents by comparison of the spectra of the solid state sample (Fig. 6a and S6a). Such solvent-dependent luminescent variation phenomena are remarkable due to the perturbation of the solvent molecules with different polarity and the intermolecular electron-transfer transition between solvent molecules and the MOF framework occur.34–36 In contrast, the nitrobenzene emulsions display the most obvious quenching effect. The luminescence quenching may be due to the photoinduced electron-transfer mechanism. The electron-transfer progress can be interpreted by inductive effect. The nitrobenzene with electron-deficient can obtain an electron from excited state of the ligand, which has been confirmed by molecular orbital theory. The LUMO of nitrobenzene is a low-lying π*-type orbital stabilized by –NO2 through conjugation effect, so it should be lower than LUMO of the ligand. The nitrobenzene with electron-deficient property can obtain an electron from excited state of the ligand. That is to say, the excited state electrons can transfer from MOF to nitrobenzene, which leads to luminescence quenching.11b,20d,37


image file: c6ra01933a-f6.tif
Fig. 6 (a) Emission spectra of 2 in different solvents. (b) Emission spectra of 2 in benzene, methylbenzene, xylene, and paraxylene. (c) Luminescence quenching of 2 dispersed in H2O by gradually increasing TNP concentration. (d) Plot of fraction of luminescence intensity of 2 vs. concentration of analytes. I0 and I are the luminescence intensities in the absence and presence of analyte, respectively.

In order to better demonstrate the impact of the nitro group on sensing of nitrobenzene, the experiment of emission spectra of 1 and 2 in benzene, methylbenzene, xylene, and paraxylene were carried out. As shown in the Fig. 6b and S6b, the fluorescence intensity in the BTEX solvent emulsions are lower than the other solvents, such as N,N-dimethylformamide (DMF), acetonitrile (ACN), and so on. Contributed to this phenomenon is that BTEX molecules possess rich conjugated π-electron from benzene ring, might generate fierce molecular collisions with the excited electron of MOFs molecules and yield energy transfer and non-radiative decay. In particular, the emission intensity was lowest in the nitrobenzene solutions; it was completely quenched in the nitrobenzene solutions. What's more, we explored the potential application of the two coordination polymers towards detection of trace amount of nitroaromatics explosives; luminescence quenching was performed by gradual addition of analytes dispersed in H2O. The changes in luminescence intensity with the increasing addition of 2,4,6-trinitrophenol (TNP up to 1000 ppm) in the two coordination polymers are shown in Fig. 6c and S6c, respectively. When the concentration of TNP are increased to 1000 ppm, the luminescence intensities of TNP are quenched with a high quenching efficiency, for 1, the quenching efficiency is 98.2%, and the quenching efficiency is 97.4% for 2. Similar luminescence quenching was also performed with other nitroaromatics such as NB, p-nitroaniline, m-dinitrobezene, and sodium nitrobenzene sulfonate (Fig. S7 for 1 and S8 for 2). Among these, we can know that all of them show the similar luminescence quenching behavior comparable to TNP (Fig. 6d and S9). These results indicate that both the two coordination polymers are effective detectors for nitroaromatic explosives.

To understand the sensitivity, the Stern–Volmer plots were used to calculate the quenching constants of the analytes (Fig. 7a and S10a) using the SV equation (I0/I) = Ksv[A] + 1, where I0 and I are the luminescence intensities before and after the addition of the analyte, [Q] is the molar concentration of the analyte, and Ksv is the quenching constant.38 Different quenchers have varying degrees of impact on the coordination polymers are shown in the Fig. 7b and S10b. And as shown in the Table 3, we can see that the Ksv values of the quencher TNP are both largest for two coordination polymers, indicating their high sensitivity in detecting small amounts of nitro groups in solution.


image file: c6ra01933a-f7.tif
Fig. 7 For 2, (a) linear relationships of the quenching are fluorescence intensity ratio and quencher concentration. (b) At different concentrations, the value of the fluorescence intensities and the quencher ratios.
Table 3 Different quenchers' constants (Ksv) of the two coordination polymers
Analyte 1 [Ksv (M−1)] 2 [Ksv (M−1)]
2,4,6-Trinitrophenol 3.83 × 10⁴ 2.96 × 10⁴
Nitrobenzene 2.81 × 10⁴ 1.36 × 10⁴
m-Dinitrobezene 1.17 × 10⁴ 2.99 × 10⁴
p-Nitroaniline 1.53 × 10⁴ 1.20 × 10⁴
Sodium nitrobenzene sulfonate 4.50 × 10³ 8.50 × 10³


Conclusions

In this work, we have successfully synthesized two new coordination polymers, [Cd43-O)(TTHA)(H2O)2]·3H2O (1) and [Zn5Na2(TTHA)2(H2O)10] (2), under the hydrothermal condition by using a flexible polycarboxylic acids, 1,3,5-triazine-2,4,6-triamine hexaacetic acid (H6TTHA). By the single crystal analysis, coordination polymer 1 exhibited a 2D sheet structure and 2 possessed a fascinating 3D network framework. For the surface photoelectronic properties, both 1 and 2 can behave as p-type semiconductors. The luminescence studies reveal that coordination polymers 1 and 2 display selectivity and sensitivity to nitro derivatives in solution. The results show that 1 and 2 may be used for nitro derivatives sensing application. In summary, the successful syntheses of these coordination polymers and the finding of their unusual physicochemical properties may also help to explore new types of sensing and semiconducting materials.

Acknowledgements

We are grateful for support provided by the National Natural Science Foundation of China (Grant No. 21371086, 21571091), and Commonweal Research Foundation of Liaoning province in China (No. 2014003019) for financial assistance.

Notes and references

  1. C. J. Doonan, D. J. Tranchemontagne, T. Grant Glover, J. R. Hunt and O. M. Yaghi, Nat. Chem., 2010, 2, 235 CrossRef CAS PubMed.
  2. H. X. Deng, C. J. Doonan, H. Furukawa, R. B. Ferreira, J. Towne, C. B. Knobler, B. Wang and O. M. Yaghi, Science, 2010, 327, 846 CrossRef CAS PubMed.
  3. (a) J. C. Bailar Jr, Prep. Inorg. React., 1964, 1, 1 Search PubMed; (b) B. F. Hoskins and R. Robson, J. Am. Chem. Soc., 1989, 111, 5962 CrossRef CAS; (c) B. F. Hoskins and R. Robson, J. Am. Chem. Soc., 1990, 112, 1546 CrossRef CAS; (d) B. Moulton and M. J. Zaworotko, Chem. Rev., 2001, 101, 1629 CrossRef CAS PubMed; (e) A. Y. Robin and K. M. Fromm, Coord. Chem. Rev., 2006, 250, 2127 CrossRef CAS.
  4. O. M. Yaghi, M. O'Keeffe, N. W. Ockwig, H. K. Chae, M. Eddadoudi and J. Kim, Nature, 2003, 423, 705 CrossRef CAS PubMed.
  5. J. L. C. Rowsell and O. M. Yaghi, Microporous Mesoporous Mater., 2004, 73, 3 CrossRef CAS.
  6. (a) T. Komatsu, J. M. Taylor and H. Kitagawa, Inorg. Chem., 2016, 55, 546 CrossRef CAS PubMed; (b) S. Halder, A. Layek, K. Ghosh, C. Rizzoli, P. P. Ray and P. Roy, Dalton Trans., 2015, 44, 16149 RSC; (c) S. Roy, A. Dey, P. P. Ray, J. Ortega-Castro, A. Frontera and S. Chattopadhyay, Chem. Commun., 2015, 51, 12974 RSC; (d) B. Bhattacharya, A. Layek, M. M. Alam, D. K. Maity, S. Chakrabarti, P. P. Ray and D. Ghoshal, Chem. Commun., 2014, 50, 7858 RSC.
  7. (a) M. Dinca and J. R. Long, Angew. Chem., Int. Ed., 2008, 47, 6766 CrossRef CAS PubMed; (b) J. L. C. Rowsell and O. M. Yaghi, Angew. Chem., Int. Ed., 2005, 44, 4670 CrossRef CAS PubMed.
  8. (a) Y. Liu, W. M. Xuan and Y. Cui, Adv. Mater., 2010, 22, 4112 CrossRef CAS PubMed; (b) J. R. Li, R. J. Kuppler and H. C. Zhou, Chem. Soc. Rev., 2009, 38, 1477 RSC.
  9. C. W. Freudiger, W. Min, B. G. Saar, S. J. Lu, G. R. Holtom, C. W. He, J. C. Tsai, J. X. Kang and X. S. Xie, Science, 2008, 322, 1857 CrossRef CAS PubMed.
  10. M. Andruh, J. P. Costes, C. Diaz and S. Gao, Inorg. Chem., 2009, 48, 3342 CrossRef CAS PubMed.
  11. (a) Y. X. Guo, X. Feng, T. Y. Han, S. Wang, Z. G. Lin, Y. P. Dong and B. Wang, J. Am. Chem. Soc., 2014, 136, 15485 CrossRef CAS PubMed; (b) Y. C. He, H. M. Zhang, Y. Y. Liu, Q. Y. Zhai, Q. T. Shen, S. Y. Song and J. F. Ma, Cryst. Growth Des., 2014, 14, 3174 CrossRef CAS.
  12. (a) S. N. Wang, H. Xing, Y. Z. Li, J. F. Bai, Y. Pan, M. Scheer and X. Z. You, Eur. J. Inorg. Chem., 2006, 15, 3041 CrossRef; (b) D. J. Collins and H. C. Zhou, J. Mater. Chem., 2007, 17, 3154 RSC; (c) M. Eddaoudi, J. Kim, N. Rosi, D. Vodak, J. Wachter, M. O'Keeffe and O. M. Yaghi, Science, 2002, 295, 469 CrossRef CAS PubMed; (d) C. A. Bauer, T. V. Timofeeva, T. B. Settersten, B. D. Patterson, V. H. Liu, B. A. Simmons and M. D. Allendorf, J. Am. Chem. Soc., 2007, 129, 7136 CrossRef CAS PubMed; (e) K. C. Stylianou, R. Heck, S. Y. Chong, J. Bacsa, J. T. A. Jones, Y. Z. Khimyak, D. Bradshaw and M. J. Rosseinsky, J. Am. Chem. Soc., 2010, 132, 4119 CrossRef CAS PubMed.
  13. (a) F. Himo, Z. P. Demko, L. Noodleman and K. B. Sharpless, J. Am. Chem. Soc., 2002, 124, 12210 CrossRef CAS PubMed; (b) F. Himo, Z. P. Demko, L. Noodleman and K. B. Sharpless, J. Am. Chem. Soc., 2003, 125, 9983 CrossRef CAS PubMed.
  14. X. C. Huang, D. Li and X. M. Chen, CrystEngComm, 2006, 8, 351 RSC.
  15. (a) Q. L. Zhu, T. L. Sheng, R. B. Fu, S. M. Hu, J. S. Chen, S. C. Xiang, C. J. Shen and X. T. Wu, Cryst. Growth Des., 2009, 9, 5128 CrossRef CAS; (b) Q. L. Zhu, T. L. Sheng, R. B. Fu, S. M. Hu, C. J. Shen, X. Ma and X. T. Wu, CrystEngComm, 2011, 13, 2096 RSC; (c) P. K. Goswami, M. Singh, R. Thaimattam and A. Ramanan, CrystEngComm, 2013, 15, 9787 RSC; (d) X. Jiang, H. Xia, Y. F. Zhu, C. X. Huang and Y. H. Liao, Z. Anorg. Allg. Chem., 2011, 637, 2273 CrossRef CAS; (e) S. D. Han, W. C. Song, J. P. Zhao, Q. Yang, S. J. Liu, Y. Lia and X. H. Bu, Chem. Commun., 2013, 49, 871 RSC; (f) X. Jiang, B. Tao, H. Xia and G. Y. Liao, CrystEngComm, 2012, 14, 3271 RSC.
  16. (a) Q. L. Zhu, T. L. Sheng, R. B. Fu, S. M. Hu, L. Chen, C. J. Shen, X. Ma and X. T. Wu, Chem.–Eur. J., 2011, 17, 3358 CrossRef CAS PubMed; (b) X. Jiang, B. Tao, H. Xia and G. Y. Liao, CrystEngComm, 2012, 14, 3271 RSC; (c) Q. L. Zhu, T. L. Sheng, C. H. Tan, S. M. Hu, R. B. Fu and X. T. Wu, Inorg. Chem., 2011, 50, 7618 CrossRef CAS PubMed; (d) X. Jiang, L. Lin, Y. F. Zhu and H. Xia, Transition Met. Chem., 2011, 36, 901 CrossRef CAS; (e) S. N. G. Acharya, R. S. Gopalan, G. U. Kulkarni, K. Venkatesana and S. Bhattacharya, Chem. Commun., 2000, 1351 RSC; (f) X. Jiang, G. Yan, Y. H. Liao, C. X. Huang and H. Xia, Inorg. Chem. Commun., 2011, 14, 1924 CrossRef CAS; (g) H. Zhang, J. G. Ma, D. M. Chen, J. M. Zhou, S. W. Zhang, W. Shi and P. Cheng, J. Mater. Chem. A, 2014, 2, 20450 RSC; (h) J. Song, X. Gao, Z. N. Wang, C. R. Li, Q. Xu, F. Y. Bai, Z. F. Shi and Y. H. Xing, Inorg. Chem., 2015, 54, 9046 CrossRef CAS PubMed.
  17. (a) Y. Salinas, R. Martinez-Manez, M. D. Marcos, F. Sancenon, A. M. Castero, M. Parra and S. Gil, Chem. Soc. Rev., 2012, 41, 1261 RSC; (b) M. E. Germain and M. J. Knapp, Chem. Soc. Rev., 2009, 38, 2543 RSC.
  18. (a) S. A. Boyd, G. Sheng, B. J. Teppen and C. T. Johnston, Environ. Sci. Technol., 2001, 35, 4227 CrossRef CAS PubMed; (b) M. T. Cronin, B. W. Gregory and T. W. Schultz, Chem. Res. Toxicol., 1998, 11, 902 CrossRef CAS PubMed; (c) P. S. Majumder and S. K. Gupta, Water Res., 2003, 37, 4331 CrossRef CAS PubMed.
  19. (a) A. W. Czarnik, Nature, 1998, 394, 417 CrossRef CAS; (b) D. S. Moore, Rev. Sci. Instrum., 2004, 75, 2499 CrossRef CAS.
  20. (a) S. Dang, X. Min, W. Yang, F. Y.Yi, H. You and Z. M. Sun, Chem.–Eur. J., 2013, 19, 17172 CrossRef CAS PubMed; (b) S. S. Nagrkar, B. Joarder, A. K. Chaudhari, S. Mukherjee and S. K. Ghosh, Angew. Chem., Int. Ed., 2013, 52, 2881 CrossRef PubMed; (c) X. Zhou, H. Li, H. Xiao, L. Li, Q. Zhao, T. Yang, J. Zuo and W. Huang, Dalton Trans., 2013, 42, 5718 RSC; (d) D. Tian, Y. Li, R. Y. Chen, Z. Chang, G. Y. Wang and X. H. Bu, J. Mater. Chem. A, 2014, 2, 1465 RSC; (e) S. Pramanik, Z. Hu, X. Zhang, C. Zheng, S. Kelly and J. Li, Chem.–Eur. J., 2013, 19, 15964 CrossRef CAS PubMed; (f) G. Y. Wang, C. Song, D. M. Kong, W. J. Ruan, Z. Chang and Y. Li, J. Mater. Chem. A, 2014, 2, 2213 RSC; (g) J. S. Qin, S. J. Bao, P. Li, W. Xie, D. Y. Du, L. Zhao, Y. Q. Lan and Z. M. Su, Chem.–Asian J., 2014, 9, 749 CrossRef CAS PubMed; (h) M. Guo and Z. M. Sun, J. Mater. Chem., 2012, 22, 15939 RSC.
  21. P. D. Hoog, P. Gamez, W. L. Driessen and J. Reedijk, Tetrahedron Lett., 2002, 43, 6783 CrossRef.
  22. G. M. Sheldrick, SADABS, Program for Empirical Absorption Correction for area Detector Data, University of Gottingen, Gottingen, Germany, 1996 Search PubMed.
  23. G. M. Sheldrick, SHELXS 97, Program for Crystal Structure Refinement, University of Gottingen, Gottingen, Germany, 1997 Search PubMed.
  24. M. J. Zheng, Y. Y. Zhu, Z. G. Sun, J. Zhu, C. Q. Jiao, W. Chu, S. H. Sun and H. Tian, CrystEngComm, 2013, 15, 1445 RSC.
  25. L. Kronik and Y. Shapira, Surf. Sci. Rep., 1999, 37, 1 CrossRef CAS.
  26. L. P. Sun, S. Y. Niu, J. Jin, G. D. Yang and L. Ye, Eur. J. Inorg. Chem., 2006, 24, 5130 CrossRef.
  27. (a) J. Zhang, D. J. Wang, T. S. Shi, B. H. Wang, J. Z. Sun and T. J. Li, Thin Solid Films, 1996, 284/285, 596 CrossRef; (b) H. F. Mao, H. J. Tian, Q. F. Hou and H. J. Xu, Thin Solid Films, 1997, 300, 208 CrossRef; (c) L. P. Sun, S. Y. Niu, J. Jin, G. D. Yang and L. Ye, Eur. J. Inorg. Chem., 2006, 2006, 5130 CrossRef; (d) Y. N. Hou, X. T. Xu, N. Xing, F. Y. Bai, S. B. Duan, Q. Sun, S. Y. Wei, Z. Shi, H. Z. Zhang and Y. H. Xing, ChemPlusChem, 2014, 79, 1304 CrossRef CAS; (e) Y. N. Hou, Z. N. Wang, F. Y. Bai, Q. L. Guan, X. Wang, R. Zhang and Y. H. Xing, RSC Adv., 2014, 4, 21180 RSC; (f) Y. C. Lu, L. L. Wang, D. J. Wang, T. F. Xie, L. P. Chen and Y. H. Lin, Mater. Chem. Phys., 2011, 129, 281 CrossRef CAS.
  28. J. Zhang, D. J. Wang, T. S. Shi, B. H. Wang, J. Z. Sun and T. J. Li, Thin Solid Films, 1996, 284/285, 596 CrossRef.
  29. H. F. Mao, H. J. Tian, Q. F. Hou and H. J. Xu, Thin Solid Films, 1997, 300, 208 CrossRef.
  30. D. Plaul, E. T. Spielberg and W. Z. Plass, Z. Anorg. Allg. Chem., 2010, 636, 1268 CrossRef CAS.
  31. L. T. Ghoochany, S. Farsadpour, Y. Sun and W. R. Thiel, Eur. J. Inorg. Chem., 2011, 23, 3431 CrossRef.
  32. P. Wang, C. H. Leung, D. L. Ma, S. C. Yan and C. M. Che, Chem.–Eur. J., 2010, 16, 6900 CrossRef CAS PubMed.
  33. Y. Luo, Z. Chen, R. Tang and L. Xiao, Chem. React. Eng. Technol., 2006, 22, 549 CAS.
  34. A. Mallick, B. Garai, M. A. Addicoat, P. S. Petkov, T. Heine and R. Banerjee, Chem. Sci., 2015, 6, 1420 RSC.
  35. X. M. Wang, R. Q. Fan, L. S. Qiang, P. Wang, Y. L. Yang and Y. L. Wang, Dalton Trans., 2014, 43, 16152 RSC.
  36. S. Liu, Z. G. Xiang, Z. Hu, X. P. Zheng and D. P. Cao, J. Mater. Chem., 2011, 21, 6649 RSC.
  37. (a) S. Dang, X. Min, W. Yang, F. Y. Yi, H. You and Z. M. Sun, Chem.–Eur. J., 2013, 19, 17172 CrossRef CAS PubMed; (b) S. S. Nagrkar, B. Joarder, A. K. Chaudhari, S. Mukherjee and S. K. Ghosh, Angew. Chem., Int. Ed., 2013, 52, 2881 CrossRef PubMed; (c) X. Zhou, H. Li, H. Xiao, L. Li, Q. Zhao, T. Yang, J. Zuo and W. Huang, Dalton Trans., 2013, 42, 5718 RSC; (d) S. Pramanik, Z. Hu, X. Zhang, C. Zheng, S. Kelly and J. Li, Chem.–Eur. J., 2013, 19, 15964 CrossRef CAS PubMed; (e) G. Y. Wang, C. Song, D. M. Kong, W. J. Ruan, Z. Chang and Y. Li, J. Mater. Chem. A, 2014, 2, 2213 RSC; (f) J. S. Qin, S. J. Bao, P. Li, W. Xie, D. Y. Du, L. Zhao, Y. Q. Lan and Z. M. Su, Chem.–Asian J., 2014, 9, 749 CrossRef CAS PubMed.
  38. (a) D. K. Singha, S. Bhattacharya, P. Majee, S. K. Mondal, M. Kumara and P. Mahata, J. Mater. Chem. A, 2014, 2, 20908 RSC; (b) D. K. Singha and P. Mahata, RSC Adv., 2015, 5, 28092 RSC; (c) D. K. Singha, P. Majee, S. K. Mondal and P. Mahata, RSC Adv., 2015, 5, 102076 RSC; (d) K. Acharyya and P. S. Mukherjee, Chem.–Eur. J., 2015, 21, 6823 CrossRef CAS PubMed; (e) B. Gole, A. K. Bar and P. S. Mukherjee, Chem.–Eur. J., 2014, 20, 13321 CrossRef CAS PubMed; (f) S. Shanmugaraju and P. S. Mukherjee, Chem.–Eur. J., 2015, 21, 6656 CrossRef CAS PubMed; (g) B. Gole, W. Song, M. Lackinger and P. S. Mukherjee, Chem.–Eur. J., 2014, 20, 13662 CrossRef CAS PubMed.

Footnote

Electronic supplementary information (ESI) available: Figures of infrared spectra, TG analyses, PXRD, UV-vis spectroscopy and the bond lengths (Å) and angles (°). CCDC 1447858 and 1447859. For ESI and crystallographic data in CIF or other electronic format see DOI: 10.1039/c6ra01933a

This journal is © The Royal Society of Chemistry 2016