Nanocasting synthesis of Fe3O4@HTC nanocapsules and their superior electromagnetic properties

Zhihong Yanga, Tong Xueb, Linghui Yuc, Guangbin Jia, Guoyue Xua and Zhichuan J. Xu*c
aCollege of Materials Science and Technology, Nanjing University of Aeronautics and Astronautics, Nanjing 211100, P. R. China
bSchool of Materials Science and Engineering, Beifang University of Nationalities, Yinchuan 750021, P. R. China
cSchool of Materials Science and Engineering, Nanyang Technological University, Singapore 639798. E-mail: xuzc@ntu.edu.sg

Received 22nd January 2016 , Accepted 12th February 2016

First published on 12th February 2016


Abstract

Magnetic nanocapsules with Fe3O4 nanorods as the core and hydrothermal carbon (HTC) as the shell have been synthesized using a nanocasting method. Due to the strong shape anisotropy of the nanorods, the nanocapsules exhibit a higher coercivity and increased resonance at the high frequency range. Benefiting from the improvement of dielectric loss and magnetic loss at high frequency, the Fe3O4@HTC nanocapsule composites show superior microwave attenuation properties.
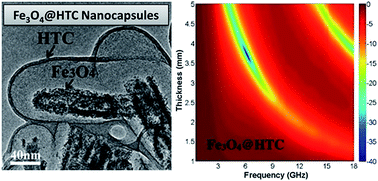

With the rapid development and extensive utilization of mobile electronic devices, electromagnetic interference (EMI) has become a serious problem in recent years. In order to reduce the influence of EMI to certain locations and shield from unwanted electromagnetic waves, intensive research has focused on the development of efficient electromagnetic wave attenuation (EMA) materials.1–4 Magnetic nanomaterials are one group of potential EMA materials. Effort has been made to develop magnetic metal (like Fe, Co, etc.), alloy (like FeCo, FeNi, etc.), and ferrite (Fe3O4) nanomaterials for EMA proposes.5–7 For metal and alloy nanomaterials, their high permittivity values and poor impedance matching are major reasons for their low EMA performances. In addition, they are also subject to oxidative corrosion under the operating conditions.8,9 Compared to metal and alloy nanomaterials, Fe3O4 possesses higher chemical stability and has been extensively studied for information storage, electronic devices, medical diagnostics, drug delivery, cancer therapy, and electromagnetic wave attenuation.10–13 However, for EMA purposes, the low natural resonance frequency (typically near or below 1 GHz) of Fe3O4 restricts its application in the high frequency range.14,15 Thus, in order to make them usable in the frequency range of GHz, their resonance frequency has to be increased. According to the Landau–Lifshitz–Gilbert (LLG) equation,16 the natural resonance frequency can be increased to the gigahertz range if the comparatively weak intrinsic anisotropy of soft magnetic materials (like nano-sized Fe3O4) can be overcome. One approach to overcome the weak intrinsic anisotropy of Fe3O4 nanomaterials is to prepare them in a high anisotropy shape like a one dimensional material. On the other hand, Fe3O4 is a typical magnetic material and its EMA properties mostly derive from magnetic loss. One effective way to achieve better microwave attenuation and broad bandwidth for Fe3O4 nanomaterials is to construct Fe3O4-based composites through incorporating dielectric constituents such as carbon. Recently, many new types of Fe3O4–carbon composites with enhanced EMA properties have been reported. For example, graphene/Fe3O4@Fe/ZnO quaternary nanocomposites exhibited good EMA properties because of the multi-interfaces and triple junctions in these nanocomposites, showing a reflection loss of less than −20 dB up to 7.3 GHz.17 A three-dimensional SiO2@Fe3O4/graphene architecture was prepared from Fe3O4 nanorods. The interfacial polarization from the graphene sheets resulted in a strong attenuation ability to EM waves.18 In this work, we have developed a new kind of Fe3O4–carbon composite, in which Fe3O4 nanomaterials in an anisotropic shape were integrated with a carbon shell. To date, several methods have been reported to coat carbon on nanosized materials, including catalytic chemical vapor deposition,19 catalytic decomposition of methane,20 and spraying methods.21 Most of these methods are conducted in a dry-chemical and high temperature environment, suffering from drawbacks such as being highly complex, having limited control, and being high in cost. Recently, a new technique using biomass (glucose, xylose, maltose, sucrose, amylopectin, starch, etc.) as a carbon source has been developed to generate carbon particles under hydrothermal conditions.22 As compared to the classical carbonization methods, this hydrothermal carbonization technique takes place in water at subcritical temperatures and pressures. These produced carbons are often called hydrothermal carbons (HTCs). Because of their excellent chemical, mechanical, and thermal stability coupled with good conductivity, HTCs have attracted great attention for composite engineering. Most interestingly, hydrothermal carbonization under mild conditions has been shown to be an eco-friendly and cost-effective process for the conversion of biomass-derived precursors into functional carbon materials.23,24 Here, we report a modified hydrothermal nanocasting technique for making HTC coated Fe3O4 nanorods and its application in high frequency EMA. In the synthesis, Fe3O4 nanorods were firstly coated with a layer of SiO2, the SiO2 layer was then used as the template, on which HTC was synthesized. After removing the SiO2 template layer, the nanocapsules with Fe3O4 nanorods as the core and HTC as the shell were produced. The dielectric carbon shell is not only beneficial for high thermal and chemical stability, but it also increases the interface polarization and dielectric loss ability. As a result of the enhanced magnetic/dielectric loss and higher resonance frequency, the Fe3O4@HTC nanocapsules exhibit superior EMA properties and therefore, may be very useful for practical applications. These well-designed nanocapsule structures may have additional advantages in other specific fields.

Fig. 1a illustrates a scheme for the preparation of the well-designed Fe3O4@HTC nanocapsules. Firstly, β-FeOOH nanorods were synthesized through simple hydrolysis of FeCl3.25 Then, the β-FeOOH nanorods were coated with a SiO2 layer through a modified Stöber process. Thirdly, the amino-functionalized β-FeOOH@SiO2 nanorods were further coated with hydrothermal carbon (HTC) via a modified hydrothermal nanocasting method and then annealed at 550 °C for 4 h under a H2/Ar (5% H2) atmosphere. At this step, the Fe3O4 nanorod@SiO2@HTC composite was produced. The final product, Fe3O4@HTC nanocapsules, were obtained after etching the SiO2 layer using NaOH solution. Fig. 1b–f show the corresponding high magnification TEM images for each product, which matches well with the images in the scheme (Fig. 1a). One thing which needs to be noted is that samples annealed at lower temperature (400 °C) suffered from having an unstructured HTC layer which collapsed after the removal of the SiO2 layer as shown in Fig. S1.


image file: c6ra01930g-f1.tif
Fig. 1 (a) Schematic illustration of the preparation of the Fe3O4@HTC nanocapsules. Close view TEM images of (b) β-FeOOH, (c) β-FeOOH@SiO2, (d) β-FeOOH@SiO2@HTC, (e) Fe3O4@SiO2@HTC, and (f) Fe3O4@HTC nanocapsules.

The structure and morphology of the obtained product were investigated in detail using SEM and TEM. Fig. 2a and b show representative SEM and TEM images of the as-synthesized β-FeOOH. They show that the as-synthesized β-FeOOH is rod-like in shape and the particle size is in the range of 80–90 nm in diameter and 200–300 nm in length. Through the simple Stöber method, a uniform silica layer was coated on the prepared β-FeOOH nanorods. It can be clearly seen in Fig. 2c that the surface becomes smooth after the deposition of this silica layer. The thickness of the silica layer can be identified from the TEM image (Fig. 1c) to be around 60–70 nm. After the hydrothermal process, a very uniform hydrothermal carbon (HTC) layer can be grown on the silica layer. Fig. 2d and e display the TEM images of this product and the HTC layer can be clearly observed. Normally, without surface functionalization, the driving force for the direct deposition of HTC onto the core is quite weak, so the loading rate and thickness cannot be well controlled which results in an inhomogeneous coating layer. Here, before the hydrothermal treatment, the SiO2 coated β-FeOOH nanorods were functionalized with amino groups. That way, electrostatic interactions play an important role in the uniform impregnation of HTC carbon precursors on the silica layer.26 The subsequent heat treatment in an H2/Ar atmosphere can reduce the β-FeOOH to Fe3O4 and further carbonize the formed HTC layer. Finally, in order to achieve an even lower density for the electromagnetic wave attenuation application, the SiO2 layer was removed. The size and morphology of the final product were investigated using FESEM and HRTEM. Fig. 2f clearly shows that the sample still retains the rod-like morphology with an average diameter of 150–200 nm and a length of 300–500 nm. The HRTEM image shown in Fig. 2g indicates that, after the hydrothermal carbonization procedure and subsequent heating treatment, these Fe3O4 nanorods are still well enclosed in the HTC capsules. It is also clearly shown that the surface of the Fe3O4 nanorods is mesoporous and consists of dense nanopores and the HTC shell is quite uniform with a thickness of around 10 nm. The results for nitrogen adsorption–desorption measurements on the Fe3O4@HTC nanocapsules are shown in Fig. S2. It indicates that the BET surface area is 36 m2 g−1 and the BJH pore volume is 0.123 cm3 g−1. The type-IV isotherm shows a clear hysteresis loop which indicates the mesoporosity of the material. To determine the carbon content in these as-prepared Fe3O4@HTC nanocapsules, TGA was performed in air (Fig. S3). The sample shows a total weight loss of around 32 wt% upon heating to 700 °C. The total weight loss should correspond to the oxidation of Fe3O4 to Fe2O3 and the combustion of carbon. Thus the carbon content in the composite is estimated to be around 34.2 wt%. A high-resolution TEM (HRTEM) image taken on the center region of the nanorod is shown in Fig. 2h. It shows that the lattice spacing is ∼0.26 nm which matches well with the (311) planes of Fe3O4. The corresponding SAED pattern shown in Fig. 2i shows a polycrystalline nature of the Fe3O4 cores. As for the outer HTC shell, no lattice fringes are found through HRTEM which reveals that the HTC shells are amorphous (Fig. S4). A typical EDS spectrum for the Fe3O4@HTC nanocapsules shown in Fig. S5 confirms the presence of C, Fe, and O.


image file: c6ra01930g-f2.tif
Fig. 2 (a) SEM and (b) TEM images of the as-prepared β-FeOOH nanorods. (c) SEM image of the β-FeOOH@SiO2 composite. (d and e) TEM images of the Fe3O4@SiO2@HTC particles. (f and g) TEM images of the Fe3O4@HTC nanocapsules. (h) HRTEM image and (i) corresponding SAED pattern of the well-crystallized Fe3O4 nanorod.

Fig. 3a shows the XRD pattern of the as-prepared β-FeOOH nanorods. All of the reflection peaks and positions confirm the single-phase character of the product and can be indexed to the tetragonal β-FeOOH phase (JCPDS card no: 34-1266). The well-resolved peaks reveal the good crystallinity of these nanorods. The XRD pattern in Fig. 3b confirms the full conversion from the β-FeOOH phase to the Fe3O4 phase (JCPDS: 19-0629) after annealing, which is consistent with the TEM result.


image file: c6ra01930g-f3.tif
Fig. 3 XRD patterns of the as-prepared β-FeOOH nanorods and Fe3O4@HTC nanocapsules.

Fig. 4 shows the magnetization hysteresis loops of the as-prepared Fe3O4 nanorods and Fe3O4@HTC nanocapsules at room temperature. It can be seen that the pure Fe3O4 nanorods exhibit ferromagnetic behavior. The saturation magnetization value (Ms) of the as-prepared Fe3O4 nanorods is about 79 emu g−1, which is a bit lower than the theoretical value of bulk Fe3O4 (∼92 emu g−1). This agrees with the known fact that the magnetization of small particles decreases as the particle size decreases.27 The coercivity (Hc) value is around 124 Oe which is higher than the similar sized Fe3O4 nanoparticles.28 The larger coercivity value is mainly contributed from the larger shape and surface anisotropy of the nanorods.29 For the samples of Fe3O4@HTC nanocapsules, the value of Ms decreases to 50.4 emu g−1 which is mainly due to the addition of non-magnetic element C in the composition and the percentage of decrease in the Ms value is quite close to the carbon content obtained from the TGA results. Meanwhile, the Hc value increases to 287 Oe which may be attributed to the extra stress generated from the HTC shell to the Fe3O4 core.


image file: c6ra01930g-f4.tif
Fig. 4 The hysteresis loops of the Fe3O4 nanorods and Fe3O4@HTC nanocapsules measured at room temperature.

The EM parameters (relative complex permittivity, εr = ε′ − ′′, and the relative complex permeability, μr = μ′ − ′′) of the Fe3O4 nanorod and Fe3O4@HTC composites were measured in the frequency range of 0.5–18 GHz. Fig. 5a and b show the frequency dependence of the relative permittivity (εr) and relative permeability (μr) of the composites. These show a different tendency of the real part (ε′) and the imaginary part (ε′′) for these two composites. As shown in Fig. 5a, the ε′ value of the Fe3O4 nanorod composite is almost constant in the whole frequency range and the ε′ value is around 5.2, while the ε′ value of the Fe3O4@HTC composite displays a decline in the frequency range of 0.5–18 GHz. The ε′ value decreases gradually from 14.8 at 0.5 GHz to 7.5 at 18 GHz. It also can be observed in Fig. 5a that the Fe3O4 nanorod composite shows a relatively constant ε′′ value of 0.11–0.18 in the whole frequency range, but the Fe3O4@HTC composite exhibits a higher ε′′ value of 2.7–1.05 in the same frequency range. The increase in both the ε′ and ε′′ values for the Fe3O4@HTC composite is mainly due to the dipolar polarization and electric polarization of the hydrothermal carbon during the activation by an EM wave.30


image file: c6ra01930g-f5.tif
Fig. 5 Complex permittivity and permeability curves of the silicon resin composites filled with 60 wt% of Fe3O4 nanorods (a) and Fe3O4@HTC nanocapsules (b). The dielectric tangential loss (c) and magnetic tangential loss (d) of the Fe3O4 nanorod and Fe3O4@HTC nanocapsule composites.

Fig. 5b shows the real (μ′) and imaginary (μ′′) parts of these two composites in the frequency range of 0.5–18 GHz. It is worth noting that, for the Fe3O4 nanorod and the Fe3O4@HTC composites, the maximum values of μ′′ are found to be located at 2.8 GHz and 3.9 GHz, respectively. Compared with the conventional Fe3O4 particle composites, the natural resonance frequencies (fr) of the Fe3O4 nanorod and the Fe3O4@HTC composites have remarkably shifted to higher frequency. The increase in the resonance frequencies for these two materials can be explained by the natural resonance equations for ferromagnetic materials, which are shown as follows:31

 
fr = γHa (1)
 
Ha = 4|k1|/3μ0Ms (2)
where γ is the gyromagnetic ratio, Ha is the anisotropy energy, and k1 is the anisotropy coefficient. Due to the strong shape anisotropy of the rod shape, the anisotropy coefficient k1 will be increased.32 In that way, the anisotropy energy Ha increases which results in a high natural resonance frequency fr. These increases in the effective anisotropy energy (Ha) can be also observed from the coercivity (Hc) variation in the VSM measurement. Commonly, dielectric loss and magnetic loss are the two possible contributions to microwave attenuation.33 The dielectric loss factor (tan[thin space (1/6-em)]δε = ε′′/ε′) and magnetic loss factor (tan[thin space (1/6-em)]δμ = μ′′/μ′) for the Fe3O4 nanorod and the Fe3O4@HTC composites are calculated and plotted as a function of frequency in Fig. 5c and d, respectively. It is clearly seen that the tan[thin space (1/6-em)]δε of the Fe3O4@HTC composite shows a dramatic dispersion-like curve which is due to the dielectric relaxation process, while the tan[thin space (1/6-em)]δε of the Fe3O4 nanorod composite is almost constant (∼0.03). The average value of tan[thin space (1/6-em)]δε of the Fe3O4@HTC composite is around 0.16 which is much larger than that of the the Fe3O4 nanorod composite in the whole frequency range. The magnetic loss factor δμ of these two composites shows the same trend as the dispersion of μ′′. Due to the higher maximum μ′′ value for the Fe3O4 nanorod composites, it shows a bit higher peak magnetic loss factor compared to that of the Fe3O4@HTC composite. Therefore, the Fe3O4@HTC composite can dissipate microwave energy through both dielectric loss and magnetic loss. However, the microwave energy can be mainly dissipated by magnetic loss for the Fe3O4 nanorod composite.

Depending on the transmission line theory, the Reflection Loss (RL) of the samples can be calculated based on the experimentally determined complex permittivity and permeability using the formulae which are described in the ESI. Fig. 6a and b present the calculated RL results of the Fe3O4 nanorod and Fe3O4@HTC composites coupled with different thickness. It is obviously exhibited that the reflection loss peaks for both samples shift from higher to lower frequency while the thickness increases which is associated with the quarter-wavelength attenuation.34 It can be seen from Fig. 6a that the value of minimum RL of the Fe3O4 nanorod composite is only −4.4 dB at 7.8 GHz with a thickness of 4 mm, while the Fe3O4@HTC composite shows a minimum RL value of −28 dB with the same thickness. For the Fe3O4@HTC composite, a minimum RL value of −32 dB can be obtained at 6.2 GHz with a thickness of 3.5 mm (Fig. 6b).


image file: c6ra01930g-f6.tif
Fig. 6 Frequency dependence of the reflection loss (RL) for the composites made of Fe3O4 nanorods (a) and Fe3O4@HTC nanocapsules (b). Contour maps of the calculated reflection loss values of Fe3O4 nanorods (c) and Fe3O4@HTC nanocapsules (d).

In order to reveal more details on the influence of thickness to the microwave attenuation properties, the RL 2D-contours of both composites in the frequency range of 1–18 GHz with the absorber thickness of 1–5 mm are shown in Fig. 6c and d. As shown in Fig. 6c, the RL value of the Fe3O4 nanorod composite can hardly reach −10 dB which means 90% microwave attenuation in the range of 1.0–5.0 mm. For Fe3O4@HTC, the attenuation band for RL values below −10 dB almost covers the whole frequency range with the variation of thickness. Moreover, the attenuation bandwidth for RL below −20 dB (99% microwave attenuation) can also cover a wide frequency range from 3.8 to 9 GHz over the absorber thickness of 2.7–5 mm. From the contour map of the calculated RL values for the Fe3O4@HTC composite (Fig. 6d), an even higher microwave attenuation of RL ∼ 40 dB can be achieved at the optimal thickness of 3.8 mm. The enhanced microwave attenuation properties for the Fe3O4@HTC composite can be attributed to two facts. Firstly, the Fe3O4 nanorods are integrated within the hydrothermal carbon (HTC) shell. The charge transfer between Fe3O4 and HTC occurs when there is incident EM. Therefore, the enhanced EMA properties can be obtained through interfacial polarization and the associated relaxation. Secondly, as shown in Fig. 5c and d, the complementarities between dielectric loss and magnetic loss that come from the Fe3O4 core and HTC shell would also be helpful for enhancing the EMA properties.35 Thus, decorating dielectric hydrothermal carbon (HTC) on Fe3O4 nanorods to form a well-designed nanocapsule structure is an efficient way for the improvement of the EMA properties and making lightweight attenuation materials.

Conclusions

In summary, a nanocasting method has been developed to synthesize well-designed Fe3O4@HTC nanocapsules. The TEM and HRTEM study shows that the Fe3O4 nanorods were encapsulated in a uniform shell of hydrothermal carbon. Both the Fe3O4 nanorods and Fe3O4@HTC nanocapsules show an enlargement of the coercivity which leads to a higher resonance frequency. The Fe3O4@HTC nanocapsules exhibit enhanced microwave attenuation performance compared with the pure Fe3O4 nanorods because of the improved magnetic loss at higher frequency and the improvement of dielectric loss. This capsule-structured Fe3O4@HTC composite is promising as a new type of EMA material which is also lightweight.

Acknowledgements

This work was supported by Singapore MOE Tier 1 Grants (RGT131/14 and RG13/13) and by the Singapore National Research Foundation under its Campus for Research Excellence And Technological Enterprise (CREATE) program and by the National Natural Science Foundation of China (No. 11575085), the Aeronautics Science Foundation of China (No. 2014ZF52072) and the Priority Academic Program Development of Jiangsu Higher Education Institutions (PAPD).

Notes and references

  1. Q. H. Liu, X. H. Xu, W. X. Xia, R. C. Che, C. Chen, Q. Cao and J. G. He, Nanoscale, 2015, 7, 1736 RSC.
  2. Z. H. Wang, Z. Han, D. Y. Geng and Z. D. Zhang, Chem. Phys. Lett., 2010, 489, 187 CrossRef CAS.
  3. J. W. Liu, R. C. Che, H. Chen, F. Zhang, F. Xia, Q. Wu and M. Wang, Small, 2012, 8, 1214 CrossRef CAS PubMed.
  4. Z. H. Yang, Z. W. Li, L. H. Yu, Y. H. Yang and Z. C. Xu, J. Mater. Chem. C, 2014, 2, 7583 RSC.
  5. G. B. Sun, B. X. Dong, M. H. Cao, B. Q. Wei and C. W. Hu, Chem. Mater., 2011, 23, 1587 CrossRef CAS.
  6. J. C. Wang, H. Zhou, J. D. Zhuang and Q. Liu, Phys. Chem. Chem. Phys., 2015, 17, 3802 RSC.
  7. X. G. Liu, Z. Q. Ou, D. Y. Geng, Z. Han, J. J. Jiang, W. Liu and Z. D. Zhang, Carbon, 2010, 48, 891 CrossRef CAS.
  8. L. G. Yan, J. B. Wang, X. H. Han, Y. Ren, Q. F. Liu and F. S. Li, Nanotechnology, 2010, 21, 095708 CrossRef PubMed.
  9. Z. H. Yang, Z. W. Li, Z. Zhao and Y. H. Yang, RSC Adv., 2015, 4, 9457 RSC.
  10. R. M. Cornell and U. Schwertmann, The Iron Oxides, Wiley-VCH, New York, 2003, pp. 126–136 Search PubMed.
  11. S. Sun, C. Wei, Z. Zhu, Y. Hou, S. S. Venkatraman and Z. Xu, Chin. Phys. B, 2013, 23, 037503 CrossRef.
  12. M. B. Gawande, P. S. Brancoa and R. S. Varma, Chem. Soc. Rev., 2013, 42, 3371 RSC.
  13. L. B. Kong, Z. W. Li, L. Liu, R. Huang, M. Abshinova, Z. H. Yang, C. B. Tang, P. K. Tan, C. R. Deng and S. Matitsine, Int. Mater. Rev., 2013, 58, 203 CrossRef CAS.
  14. V. G. Harris, IEEE Trans. Magn., 2012, 48, 1075 CrossRef CAS.
  15. N. N. Song, H. T. Yang, H. L. Liu, X. Ren, H. F. Ding, X. Q. Zhang and Z. H. Cheng, Sci. Rep., 2013, 3, 3161 Search PubMed.
  16. B. Gao, L. Qiao, J. B. Wang, Q. F. Liu, F. S. Li, J. Feng and D. S. Xue, J. Phys. D: Appl. Phys., 2008, 41, 235005 CrossRef.
  17. Y. L. Ren, H. Y. Wu, M. M. Lu, Y. J. Chen, C. L. Zhu, P. Gao, M. S. Cao, C. Y. Li and Q. Y. Ouyang, ACS Appl. Mater. Interfaces, 2012, 4, 6436 CAS.
  18. Y. L. Ren, C. L. Zhu, S. Zhang, C. Y. Li, Y. J. Chen, P. Gao, P. P. Yang and Q. Y. Ouyang, Nanoscale, 2013, 5, 12296 RSC.
  19. Z. H. Wang, C. J. Choi, B. K. Kim, J. C. Kim and Z. D. Zhang, Carbon, 2003, 41, 1751 CrossRef CAS.
  20. I. Paraskevas, V. Caps and S. C. Tsang, Carbon, 2006, 44, 820 CrossRef CAS.
  21. S. C. Tsang, V. Caps, I. Paraskevas, D. Chadwick and D. Thompset, Angew. Chem., Int. Ed., 2004, 43, 5645 CrossRef CAS PubMed.
  22. M. M. Titirici, M. Antonietti and N. Baccile, Green Chem., 2008, 10, 1204 RSC.
  23. L. H. Yu, N. Brun, K. Sakaushi, J. Eckert and M. M. Titirici, Carbon, 2013, 61, 245 CrossRef CAS.
  24. S. Ikeda, K. Tachi, Y. H. Ng, Y. Ikoma, T. Sakata, H. Mori, T. Harada and M. Matsumura, Chem. Mater., 2007, 19, 4335 CrossRef CAS.
  25. Z. Y. Wang, D. Y. Luan, S. Madhavi, Y. Hu and X. W. Lou, Energy Environ. Sci., 2012, 5, 5252 CAS.
  26. J. S. Lee, J. M. Cha, H. Y. Yoon, J. K. Lee and Y. K. Kim, Sci. Rep., 2015, 5, 12135 CrossRef PubMed.
  27. T. Wang, H. D. Wang, X. Chi, R. Li and J. B. Wang, Carbon, 2014, 74, 312 CrossRef CAS.
  28. G. X. Tong, W. H. Wu, R. Qiao and J. H. Yuan, J. Mater. Res., 2011, 26, 1639 CrossRef CAS.
  29. Y. J. Chen, G. Xiao, T. S. Wang, Q. Y. Ouyang, L. H. Qi, Y. Ma, P. Gao, C. L. Zhu, M. S. Cao and H. B. Jin, J. Phys. Chem. C, 2011, 115, 13603 CAS.
  30. L. Wang, X. L. Jia, Y. F. Li, F. Yang, L. Q. Zhang, L. P. Liu, X. Ren and H. T. Yang, J. Mater. Chem. A, 2014, 2, 14940 CAS.
  31. C. Kittel, Phys. Rev., 1948, 73, 155 CrossRef CAS.
  32. J. J. Xu, J. W. Liu, R. C. Che, C. Y. Liang, M. S. Cao, Y. Li and Z. W. Liu, Nanoscale, 2014, 6, 5782 RSC.
  33. Y. Yang, C. L. Xu, Y. X. Xia, T. Wang and F. S. Li, J. Alloys Compd., 2010, 493, 549 CrossRef CAS.
  34. M. S. Cao, J. Yang, W. L. Song, D. Q. Zhang, B. Wen, H. B. Jin, Z. L. Hou and J. Yuan, ACS Appl. Mater. Interfaces, 2012, 4, 6949 CAS.
  35. T. S. Wang, Z. H. Liu, M. M. Lu, B. Wen, Q. Y. Ouyang, Y. J. Chen, C. L. Zhu, P. Gao, C. Y. Li, M. S. Cao and L. H. Qi, J. Appl. Phys., 2013, 113, 024314 CrossRef.

Footnote

Electronic supplementary information (ESI) available: Details of experiments, materials characterization, TEM imaging, N2 adsorption–desorption isotherms, TGA, and EDS pattern. See DOI: 10.1039/c6ra01930g

This journal is © The Royal Society of Chemistry 2016
Click here to see how this site uses Cookies. View our privacy policy here.