Solvent desulfurization regeneration process and analysis of activated carbon for low-sulfur real diesel
Weiwei Li,
Jingwen Chen,
Guojing Cong,
Lei Tang,
Qun Cui* and
Haiyan Wang*
College of Chemical Engineering, Nanjing Tech University, Nanjing, Jiangsu 210009, P. R. China. E-mail: cuiqun@njtech.edu.cn; haiyanwang@njtech.edu.cn; Tel: +86 025 83587188-0
First published on 2nd February 2016
Abstract
The adsorption desulfurization process of diesel fuel is suffering from adsorbent regeneration limitation. Adsorption performance of activated carbon (AC) for S-compounds and hydrocarbons in low-sulfur real diesel was investigated by an adsorption fixed bed. The exhausted AC was regenerated by different solvents, including n-octane, ethanol and cyclohexane. AC samples were characterized using N2 adsorption–desorption isotherm at 77 K, TG and FT-IR. S-species and hydrocarbons-species in real diesel and the regeneration solutions were analyzed by gas chromatography-sulfur chemiluminescence detection (GC-SCD), gas chromatography-mass spectrometry (GC-MS) and gas chromatography (GC). The effects of hydrocarbons on desorption performance of S-compounds and extraction capability of n-octane were investigated. The effect of n-octane as a recycled regeneration solvent on the regeneration stability of AC in this work was also considered. The S-content in diesel was reduced to less than 10 ppm from an initial S-content of 34.83 ppm. The competitive adsorption between polycyclic aromatic hydrocarbons (PAHs) and S-compounds was the largest in hydrocarbons. The regeneration performance of different solvents for AC decreased as follows: n-octane > ethanol > cyclohexane. The regeneration efficiency of AC was 100% after a first adsorption–desorption cycle, and was held near 73% after 50 cycles using fresh n-octane as a regenerating solvent. The regeneration efficiency of AC can be maintained at 45% after 20 cycles using n-octane as a recycled regeneration solvent. According to the results of characterizations and tests, we found that multilayer adsorption of S-compounds and PAHs occurred in the mesopores of AC, while the aggregation phenomenon of small alkane molecules mainly existed in the micropores.
1. Introduction
Regulation of sulfur content (S-content) in diesel is becoming more and more stringent. The European Commission adopted a 10 ppm sulfur specification for diesel from January 1, 2005 with full conversion in 2010. By the end of June 2013, China had issued a state V diesel standard (S-content less than 10 ppm) with a transitional period until the end of 2017. More and more attention has been paid to deep desulfurization in environmental catalysis studies worldwide.1 At present, methods for deep desulfurization of fuels can be classified into hydro-desulfurization (HDS),2,3 oxidation,4,5 extraction6,7 and adsorptive desulfurization (ADS).8–13 Although HDS is commonly used in industry, it is hard for HDS to remove some thiophenic sulfur compounds (S-compounds) due to steric absorption hindrance on the catalyst surface, for example, dibenzothiophene (DBT) and its derivatives (DBTs). Moreover, harsh operation conditions (350–400 °C, 30–100 bar hydrogen pressure) and expensive catalysts are required with large investment in equipment. Among the mentioned approaches, ADS appears to be one of the most promising approaches for deep desulfurization, because it is efficient in removing S-compounds14 under ambient temperature and atmospheric pressure without high pressure hydrogen.Currently, the key technology in ADS for diesel are the sorbents with high selectivity, high adsorption capacity and renewability. Desulfurization sorbents including zeolites,15,16 mesoporous materials,17,18 metal–organic frameworks19–22 and activated carbons (ACs)23–30 have been investigated in the literature. Recently, ACs have been recognized and widely used as adsorbents in removing S-compounds. This is because of their high specific surface areas, broad ranges of porosity, cost effectiveness and higher adsorption capacity. Pore size distributions of ACs are wider than those of other sorbents. Therefore, not only small sulfur containing compounds but also bulky ones can be adsorbed effectively without steric hindrance. This is the reason why ACs were desulfurization sorbents with unique strengths.31
From an economic viewpoint, the regeneration process has to be performed to use adsorbents sustainably. The main reported methods for AC regeneration in the literature include thermal regeneration, ultrasonication regeneration and solvent extraction regeneration. Seredych et al.32 mentioned that the carbons for the adsorption of DBT and dimethyl-dibenzothiophene (DMDBT) were regenerated by heating at 500 °C in nitrogen for 1 h. Interestingly, the result suggested that thermal regeneration process created favorable sites for DMDBT retention. Ultrasonication33 was a new technology studied for exhausted AC regeneration. This method can decrease the surface diffusion activation energy and facilitate the desorption of adsorbed contaminates. Farzin et al.34 studied exhausted mesoporous carbons were regenerated by three different solvents (toluene, ethanol and acetonitrile). The results showed that the desulfurization capacity of the regenerated adsorbents after the first regeneration cycle varied as follows: toluene ≫ ethanol ≅ acetonitrile. Han et al.35 investigated three approaches (thermal regeneration, ultrasonication and solvent extraction) to regenerate AC exhausted by model diesel fuel (MDF). High regeneration efficiency of AC obtained for MDF. As MDF was replaced by light cycled oil, a significant drop in capacity restoration observed for a few cycles. Solvent extraction outperformed the other two methods. Moreover, high temperature treatment of thermal approach led to significant loss of porosity and surface functional groups, which resulted in its low regeneration efficiency. Several studies commonly focus on the adsorption performance of sorbents for MDF, but compositions analysis of a solvent regeneration process for real diesel is seldom reported. What had been adsorbed inside ACs' pores and how S-compounds or hydrocarbons came out through solvents' extraction. Therefore, qualitatively and quantitatively analysis of S-compounds and hydrocarbons in a regeneration solution have not been reported.
In this study, S-species and hydrocarbons-species in real diesel and regeneration solutions were qualitatively and quantitatively analysized by gas chromatography-sulfur chemiluminescence detection (GC-SCD), gas chromatography-mass spectrometry (GC-MS) and gas chromatography (GC). The exhausted AC was regenerated by three different regenerating solvent, including n-octane, ethanol and cyclohexane. The carbon samples were characterized using N2 adsorption–desorption isotherm at 77 K, TG and FTIR. The regeneration stability of AC and the recovery rate of mesopores or micropores using n-octane as a regenerating solvent were studied. In the present work, the regeneration stability of AC using a recycled n-octane solvent was also studied. The results provided a basic data of carbon-based materials regenerated by solvent during the actual regeneration process.
2. Experiment
2.1. Materials
The diesel used in this study contains compounds with a carbon number from C8 to C28, supplied by China Chemical Co. Ltd. The boiling temperature of diesel ranges from 180 °C to 350 °C. n-Octane (98.0 wt%), ethanol (99.8 wt%) and cyclohexane (99.5 wt%) were purchased from Chengdu Kelong, Sinopharm and Shanghai Shenbo Chemical Reagent Co. Ltd, respectively. Wood activated carbon (4–5 mm particle size), purchased from a particular Carbon Co. Ltd, was milled and sieved through 45–60 meshes for use. A fresh, adsorbed and regenerated activated carbon was named as AC-F, AC-A and AC-R, respectively. And AC-R50 is 50 regenerated cycles by n-octane in this work.2.2. Adsorption and regeneration
Dynamic adsorption experiments were carried out by flowing diesel through a fixed bed at room temperature determine the adsorption capacity of AC, which was dried at 120 °C in an oven for 2 h and activated at 150 °C for 3 h in nitrogen before being used in the adsorption test. A packed column was loaded with 2 g of AC. The dimensions of the stainless steel adsorption column used were: 1 cm (diameter) × 25 cm (length). The adsorption experiment was carried out with a LHSV of 5.97 h−1 and a temperature of 25 °C. The total sulfur content varies of real diesel in the outlet of fixed-bed with different time was measured. The dynamic breakthrough sulfur capacity (q) of AC was calculated by eqn (1)
 | (1) |
Then the exhausted AC was subsequently regenerated. A regeneration solvent (n-octane, ethanol or cyclohexane) was induced into the fixed-bed and extract adsorbed compounds on AC at 50 °C with a LHSV of 9.97 h−1 until regeneration time reached 81 min. The desorption curves of S-compounds and hydrocarbons were obtained. The regeneration performance was evaluated by regeneration efficiency which was calculated by eqn (2):
 | (2) |
2.3. Characterization of pore structure of ACs
N2 adsorption–desorption isotherms at 77 K were obtained on the BEL-SORP max (BEL Japan, Inc.) volumetric analyzer. The samples degassed in vacuum for 4 h at 250 °C prior to nitrogen adsorption. The specific surface areas (SBET) of ACs were calculated using the Brunauer–Emmett–Teller (BET) based on the relative pressure (P/P0) range from 0.05 to 0.2. The total pore volume of the sample (Vt) was measured based on the amount of adsorbed N2 at the relative pressure (P/P0) of 0.95. The mesoporous volume (Vmes) was calculated by BJH method. The microporous volume (Vmic) was determined by subtracting between Vmes and Vt. The pore size distribution curves were obtained using the NLDFT method.2.4. Surface pH
Measurement of pH revealed surface acidity and basicity of AC. 0.1 g sample of AC-F was added into 5 mL distilled water, and the suspension solution was shaken overnight to reach equilibrium. The pH value of suspension solution was then tested by PHS-3C.2.5. Boehm titration
The oxygenated surface groups were determined employing the Boehm titration method.36 1 g AC-F was placed into 25 mL 0.05 N solutions following as: sodium hydroxide, sodium carbonate, sodium bicarbonate, and hydrochloric acid, separately. The vials were sealed and shaken for 24 h, 5 mL of each filtrate was then pipetted and titrated with HCl or NaOH, according to the pH of the filtrate. The number of acidic sites was calculated from the assumption that NaOH neutralizes carboxyl, phenolic and lactonic groups, Na2CO3 neutralizes carboxyl and lactonic groups and NaHCO3 neutralizes carboxyl groups. The number of surface basic sites was calculated from the amount of hydrochloric acid used.2.6. Thermogravimetric analysis
Thermogravimetric analysis (TG) of ACs was tested by a WCT-1 Thermal Analyzer. The samples were tested from room temperature to 600 °C under nitrogen atmosphere with a heating rate of 10 °C min−1. The nitrogen flow rate kept at 60 mL min−1. For each measurement, 10 mg AC sample was used.2.7. Fourier transform infrared spectroscopy (FT-IR)
The FT-IR spectra of ACs were recorded using a Nicolet IS50 Fourier Transform Instrument (Thermal Scientific). The spectra of different AC samples were recorded in transmission mode using KBr wafers containing 0.1 wt% of carbon. FT-IR spectra of the samples collected in the wavenumber range of 4000–400 cm−1 with the resolution of 4 cm−1.2.8. S-compounds analysis
S-compounds in the regeneration solution were analyzed by Agilent 7890A GC with an AIB detector, coupled with a SCD sieves model 355 for simultaneous injection of samples to identify S-compounds. The chromatograph was fitted with a 50 m PONA polymethylsilane directly installed into the discharge tube. The column temperature firstly programed to retain at 120 °C for 1 min, and then heat at the increasing rate of 1.5 °C min−1 to 270 °C, and keep at 270 °C for 5 min. Nitrogen used as a carrier gas. Vaporization chamber temperature was 280 °C. The samples (1.0 μL) injected through the split/splitness with 100![[thin space (1/6-em)]](https://www.rsc.org/images/entities/char_2009.gif) :
:![[thin space (1/6-em)]](https://www.rsc.org/images/entities/char_2009.gif) 1. The burner temperature in the detector was set at 800 °C, the flow rates of air and hydrogen was 40 mL min−1 and 50 mL min−1, respectively.
1. The burner temperature in the detector was set at 800 °C, the flow rates of air and hydrogen was 40 mL min−1 and 50 mL min−1, respectively.
2.9. Hydrocarbons analysis
Hydrocarbons were analyzed by a Trace ISQ GC-MS. The analysis performed using a HP-5 6890N GC equipped with electronic pressure control. A 30 m × 0.3 mm with 0.25 mm film thickness HP-5 fused-silica capillary column (a single temperature ramp) was used. The column temperature firstly programed to keep at 60 °C for 2 min, and heat at the increasing rate of 40 °C min−1 to 300 °C with a final holding time of 7 min. The sample injection volume (1 μL) was delivered by syringe with a split ratio of 30![[thin space (1/6-em)]](https://www.rsc.org/images/entities/char_2009.gif) :
:![[thin space (1/6-em)]](https://www.rsc.org/images/entities/char_2009.gif) 1. The inlet temperature held at 300 °C. Nitrogen used as a carrier gas at a nominal flow rate of 1.5 mL min−1. The MS was operated using an electron-impact ionization source (70 eV), with a quadrupole mass analyzer operated in full-scan mode (m/z 50–300). The temperature of the ion source and the transfer line was 220 °C and 290 °C, respectively.
1. The inlet temperature held at 300 °C. Nitrogen used as a carrier gas at a nominal flow rate of 1.5 mL min−1. The MS was operated using an electron-impact ionization source (70 eV), with a quadrupole mass analyzer operated in full-scan mode (m/z 50–300). The temperature of the ion source and the transfer line was 220 °C and 290 °C, respectively.
Moreover, n-alkane was analyzed by an Agilent 6890N GC with a HP-5 fused-silica capillary column. The column temperature firstly programed to keep at 80 °C for 2 min, and heat at the increasing rate of 4 °C min−1 to 300 °C, and keep at 300 °C for 15 min. Helium used as a carrier gas at a nominal flow rate of 1.1 mL min−1. The inlet temperature held at 350 °C. The sample injection volume (1 μL) was delivered by syringe with a split ratio of 100![[thin space (1/6-em)]](https://www.rsc.org/images/entities/char_2009.gif) :
:![[thin space (1/6-em)]](https://www.rsc.org/images/entities/char_2009.gif) 1.
1.
3. Results and discussion
3.1. S-compounds and hydrocarbons analysis of real diesel
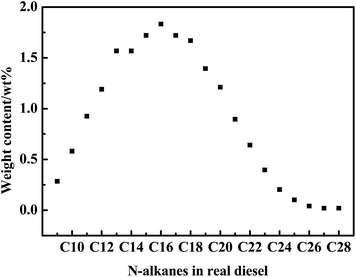
The S-compounds and hydrocarbons analysis of real diesel was helpful for further understanding the adsorption desulfurization process and the desorption mechanism. The total S-content of diesel was 34.83 ppmw and S-species in the diesel were DBTs (Table 1 and Fig. 1). Among DBTs, the content of C2-DBT was the highest, making up 45%. The contents of 4,6-dimethyl-dibenzothiophene (4,6-DMDBT) and 2,6-dimethyl-dibenzothiophene (2,6-DMDBT) were both more than 5 ppmw. Moreover, the contents of 4-methylbenzothiophene (4-MDBT), 3-methylbenzothiophene (3-MDBT) and 2,8-dimethyl-dibenzothiophene (2,8-DMDBT) were approximately 4.5 ppmw. The real diesel not only contained S-compounds but also hydrocarbons such as paraffins, cycloparaffins and aromatic compounds. The content of paraffins, cycloparaffins and aromatics compounds was 66.4 wt%, 16.3 wt% and 17.3 wt%, respectively. Typically, according to the number of aromatic rings, aromatic compounds were classified by monoaromatics, diaromatics, and triaromatics, which separately occupied 14.0 wt%, 3.1 wt% and 0.2 wt%. Moreover, the total content of n-alkanes analyzed by GC was 19.41 wt% (Fig. 1). n-Alkane mainly contained C15–C17, and the content of hexadecane was about 1.8 wt%.| Sulfur species | S-content/ppmw | Hydrocarbon types | Content/wt% |
|---|---|---|---|
| 4-MDBT | 4.74 | Paraffins | 66.4 |
| 3-MDBT | 4.63 | Cycloparaffins | 16.3 |
| 4,6-DMDBT | 5.70 | ||
| 2,6-DMDBT | 5.20 | Monoaromatics | 14.0 |
| 2,8-DMDBT | 4.27 | Diaromatics | 3.1 |
| C3-DBT | 10.29 | Triaromatics | 0.2 |
| Total sulfur | 34.83 | Total carbon | ∼100 |
3.2. Adsorption process of S-compounds on AC
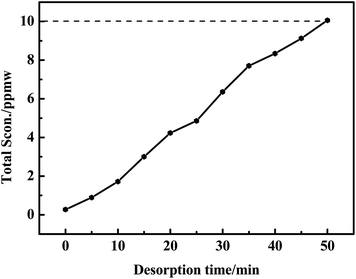
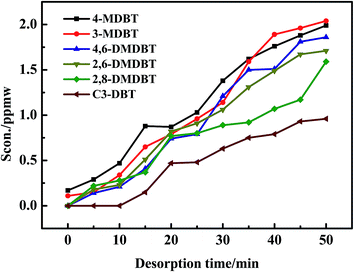
As seen in Fig. 3, 4-MDBT (0.17 ppmw) and 3-MDBT (0.11 ppmw) were detected in the outlet of fixed-bed with AC at the beginning of adsorption process. The 4,6-DMDBT (0.22 ppmw), 2,6-DMDBT (0.18 ppmw) and 2,8-DMDBT (0.17 ppmw) could be detected when the adsorption time reached 5 min. C3-DBT (0.2 ppmw) was the last detected by GC-SCD as the adsorption time reached 10 min. The breakthrough sulfur capacity of AC was 0.36 mg S per gads when the breakthrough point was 10 ppmw (Fig. 2). Most of literatures focus on the desulfurization model diesel while study on the desulfurization of real diesel is rare. Muzic M. et al.37 studied the desulfurization performance of AC for the diesel oil with the initial sulfur content of 27 mg kg−1. As the S-content reached 9.1 mg kg−1, the breakthrough sulfur capacity of AC was 0.1835 mg S per gads, only 50% in this work. This was because the specific surface area and surface acidic functional groups were favorable to the adsorption of sulfides. Althrough the adsorption performance of AC in this work is lower than that of the modified ACs in the literatures, the modified AC has the disadvantages of high cost of production, difficult regeneration of exhausted AC and poor stability after acid treatment. In contrast, AC in this work has good regeneration stability after 50 cycles. Moreover, the adsorption capacity of AC for C3-DBT (0.13 mg S per gads) is the largest in S-compounds. Therefore, adsorption force of AC for C3-DBT is stronger than C2-DBT and C1-DBT.3.3. Screening of regeneration solvent
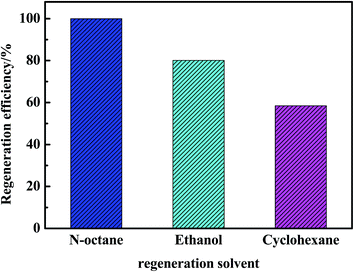
In order to investigate the regeneration performance of different regeneration solvents for AC in this work, n-octane, ethanol and cyclohexane were used as regeneration solvents to regenerate AC-A at a regeneration temperature of 50 °C, a regeneration time of 81 min and a gas space velocity of 9.97 h−1 (as shown in Fig. 4 and 5).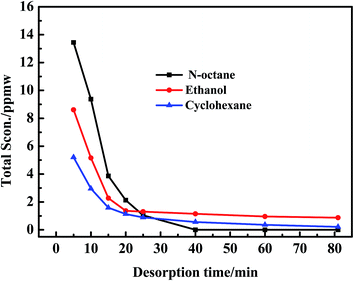 | ||
| Fig. 4 Desorption curves of total adsorbed sulfides over AC during the first cycle with different regeneration solvents. | ||
As observed in Fig. 4, no sulfides were detected in the regeneration solution at 40 min using n-octane as a regeneration solvent. However, 0.87 and 0.21 ppmw sulfides were analysized at 81 min using ethanol and cyclohexane as regeneration solvents. Besides, the amount of sulfides regenerated from AC was the largest using n-octane as a regeneration solvent. According to the Fig. 5, the regeneration efficiency of AC was 100% higher than that of ethanol (80.1%) and cyclohexane (58.5%). So it was concluded that the regeneration performance of different solvents for AC decreased as follows: n-octane > ethanol > cyclohexane. Due to the real diesel used in this experiment was mainly composed of paraffins. Therefore, n-octane was easier to dissolve with diesel compared with ethanol and cyclohexane. The extraction amount of n-octane to paraffins was higher than that of ethanol and cyclohexane. In addition, the extraction ability of n-octane on cycloparaffins and aromatics was higher than that of ethanol and cyclohexane (as shown in Fig. 6 and 7). This was due to cycloparaffins and aromatics were mainly in the form of long chain alkyl substituents. In this case, the solubility and extraction ability of n-octane on cycloparaffins and aromatics were highest. At the same time, AC-A could be completely regenerated using n-octane as a regeneration solvent.
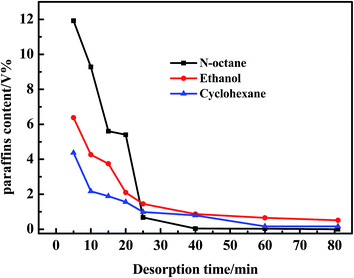 | ||
| Fig. 6 Desorption curves of adsorbed paraffins over AC during the first cycle with different regeneration solvents. | ||
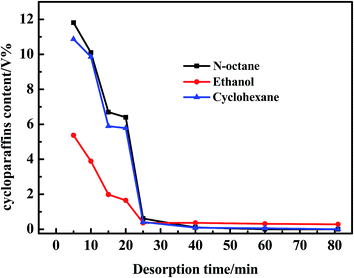 | ||
| Fig. 7 Desorption curves of adsorbed cycloparaffins over AC during the first cycle with different regeneration solvents. | ||
3.4. Desorption performance of S-compounds and hydrocarbons on AC
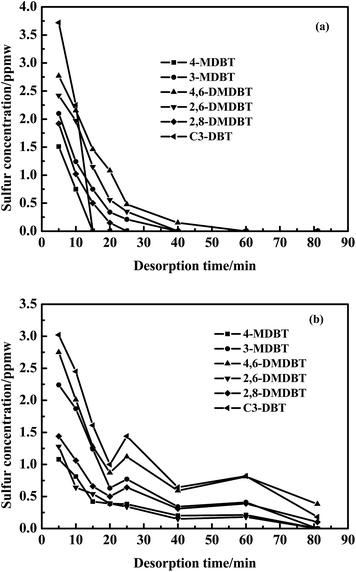
Although AC possessed high adsorptive capacity to S-compounds and hydrocarbons, a competitive adsorption of these occurred on AC, especially, large aromatics compounds such as polycyclic aromatic hydrocarbons (PAHs). This would affect the extraction capability of n-octane for S-compounds. The real diesel mainly consisted of paraffins and aromatics compounds along with S-compounds. The reason that n-octane was chosen as regenerating solvent with a good solubility. The adsorbed hydrocarbons on AC would also be extracted while S-compounds were extracted, this could further improve the regeneration performance of AC. The desorption performance of S-components and hydrocarbons on AC were both investigated.By contrast to the desorption curves of S-compounds over AC after the first cycle and 50 cycles (Fig. 8), the extraction content of S-compounds throughout the desorption process was b>a. It was found that the extraction capability of n-octane was less than the adsorption capacity of AC for S-compounds because adsorption sites of AC were occupied by S-compounds. Sulfur–sulfur interactions and π–π forces existed among S-compounds. Therefore, the multilayer adsorption of S-compounds was existed in AC. S-compounds with a content of 0.66 ppmw, still could be extracted by n-octane at the end of the regeneration process (Fig. 8b). This indicated that AC could not be completely regenerated and some S-compounds still remained in AC after 50 cycles.
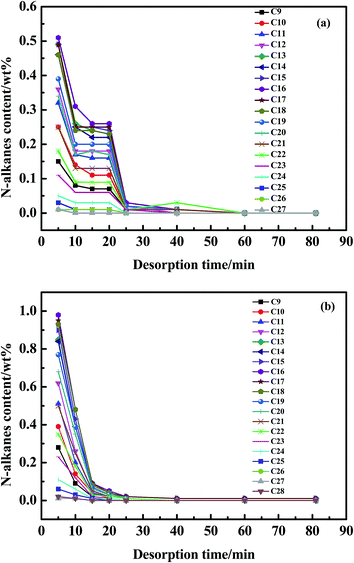
Hydrocarbons concentration in regenerating solution followed the order of: paraffins ≥ cycloparaffins > aromatics as shown in Fig. 9a. Furthermore, the extraction efficiency of paraffins was higher than that of cycloparaffins during the whole regeneration process. Hydrocarbons in the regenerating solution were barely detected up to the end of the regeneration process. In addition, cycloparaffins mainly contained alkyl substituents.
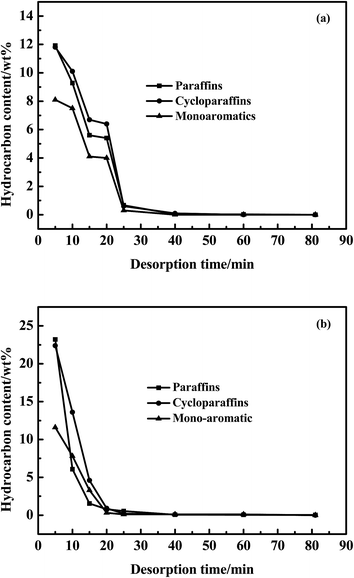 | ||
| Fig. 9 Desorption curves of paraffins/cycloparaffins/monoaromatics over AC after (a) the first cycle and (b) 50 cycles. | ||
The aromatics regenerated mainly were monoaromatics as shown in Fig. 9. However, the real diesel consisted of not only monoaromatics but also PAHs (Table 1). The adsorptive affinity of AC is stronger when hydrocarbons contain more benzene rings. Moreover, PAHs and DBTs had similar molecular diameter (8 Å), molecular structure and adsorption mechanism39 on AC. The molecular geometries of phenanthrene and 4,6-DMDBT were shown in Fig. 10. Similar to S-compounds, the multilayer adsorption of PAHs also occurred in AC. So the competitive adsorption between PAHs and S-compounds was the largest. The extraction capability of the n-octane for hydrocarbons decreased in the order of: paraffins ≥ cycloparaffins > monoaromatics > diaromatics > triaromatics. The content of hydrocarbons in the regenerating solution after 50 cycles was higher than that of the first cycle. Therefore, hydrocarbons gathered in the micro- or meso-pores of AC with the increase of regeneration process. There were still 0.03 wt% paraffins remained in AC at the end of the desorption process (Fig. 9b), which were C15, C16 and C17 as shown in Fig. 11b. This would affect the regeneration stability of AC. Therefore, the analysis of n-alkane in the desorption process was necessary in this work.
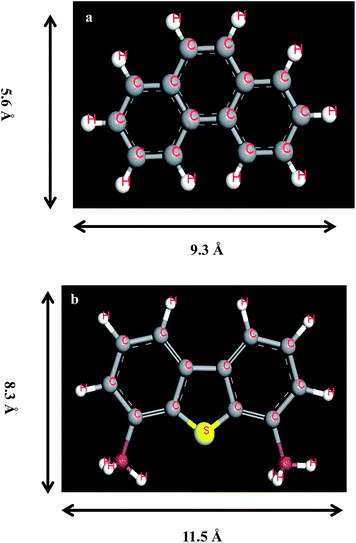 | ||
| Fig. 10 The molecular dimensions and structures of (a) phenanthrene and (b) 4,6-dimethyl-dibenzothiophene (4,6-DMDBT). | ||
The carbon number of n-alkanes in regenerating solution of the first cycle was in the range of C9–C27 except for C28 (Fig. 11), C28 also existed in diesel (Fig. 1), so C28 was remained in AC in the first desorption process.
3.5. Regeneration stability of AC
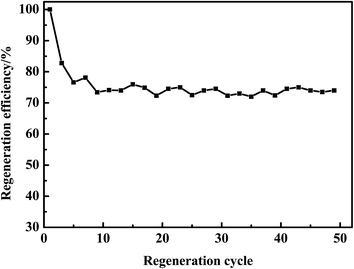
The regeneration stability of AC by n-octane was investigated (Fig. 12). The regeneration efficiency of AC was 100% after the first adsorption–desorption cycle. However, the regeneration efficiency reduced to 82.8% after 3 cycles, basically held 73% after 50 cycles. These facts illustrated that the desulfurization performance of AC kept well by n-octane.3.6. Adsorbents characterization
The desorption performance of S-compounds on AC was a complex process, mainly controlled molecular size and pore structure of AC. So the characterization of ACs could be better understanding for the desorption process. As shown in Fig. 13, the characteristics of ACs were determined by using N2 adsorption isotherms at 77 K. The textural properties of ACs were summarized in Table 2.| AC | SBET/m2 g−1 | Smic/m2 g−1 | Smes/m2 g−1 | Vt/cm3 g−1 | Vmic/cm3 g−1 | Vmes/cm3 g−1 |
|---|---|---|---|---|---|---|
| AC-F | 1684 | 1015 | 669 | 1.220 | 0.758 | 0.462 |
| AC-A | 66 | 16 | 50 | 0.160 | 0.056 | 0.104 |
| AC-R50 | 1244 | 654 | 590 | 0.983 | 0.562 | 0.421 |
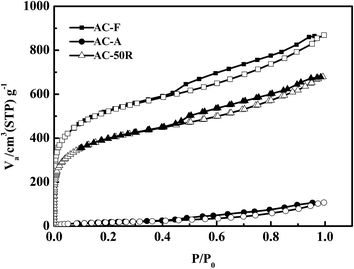
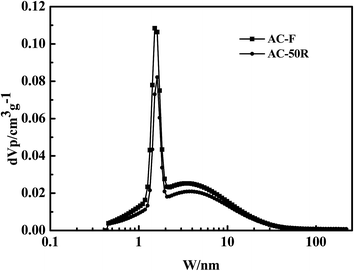
The isotherms of AC-F and AC-R50 exhibited a type I curves (Fig. 13). The isotherms of AC-R50 had lower N2 adsorption capacities and the process did not change pore structure of AC-F but reduced its porosity. The Fig. 14 also showed that 50 adsorption–desorption cycles did not change pore size distribution of AC. Type I isotherm usually indicated the adsorption of micropores. There is a distinct hysteresis loop in the isotherms of AC-F and AC-R50, which indicated the presence of mesopores. Therefore, micropores and mesopores both existed in AC-F. However, smaller hysteresis loops were also observed in AC-R50, indicating fewer mesopores in AC-R50 than that of AC-F. In addition, there were few micropores but small mesopores in AC-A. This suggests that the adsorption capacity of AC for DBTs was primarily determined by the pore structure of AC.
The analysis of BET indicated the presence of a large amount of micropores in AC (Table 2). The SBET, Smic and Smes of AC-F were 1684, 1015 and 669 m2 g−1, respectively. However, the SBET of AC-A decreased to 66 m2 g−1 and Smic decreased to 98.4% with the decrease of Smes 92.5%. These facts illustrated that micropores in AC account for a great affection, but mesopores also play a key role in S-compounds removaling.40 The recovery efficiency of Vmes for AC-R50 was nearly 91%. The adsorbates were difficult to transfer from the pores of AC into solvent due to the large diffusion resistance exists in micropores.41 So the recovery efficiency of Vmic was nearly 74%. Moreover, the recovery rate of pore volume and pore size on ACs presented in Fig. 14. After 50 cycles, both microporous volume and mesoporous volume had a better recovery using n-octane as regenerating solvent.
The average size of pores in AC-F is about 2.91 nm, whereas the critical diameter of the larger sulfur molecule (such as 4,6-DMDBT) in the present study is about 0.83 nm. Depending on the analysis results of compounds in the regenerating solution and the NLDFT pore size distribution of AC (Fig. 14), the multilayer adsorption of S-compounds and PAHs occurred in mesopores (2–10 nm), the aggregation phenomenon of small molecule hydrocarbon mainly existed in micropores (1–2 nm). Furthermore, for effective adsorption of large molecules (C1-DBT, C2-DBT and C3-DBT) not only the pore size of AC should be larger than that of the critical diameter of PAHs and DBTs, but also the pore size should be sufficiently large to reduce diffusional resistance during adsorption. It had been known that the adsorption process occurred in a series of diffusion steps into the mesopores and then into the micropores.42 For the adsorption of C2-DBT and C3-DBT, the adsorption capacity and the adsorption efficiency largely depended on the mesoporous volumes, which had a good recovery after 50 cycles.
The number of acidic groups was calculated by Boehm titration (presented in Table 3). The SBET of AC-F was 1684 m2 g−1 as shown in Table 2. It was evident that the density of carboxylic group on the surface was the largest among the acidic groups. The density of acidic groups on AC surface had a significant role in improving adsorption capacity of DBTs.43 Moreover, the adsorption capacity significantly increased as the density of carboxyl functional groups increases.44,45
| Sample | pH | Carboxyl/mmol g−1 | Lactonic/mmol g−1 | Phenolic/mmol g−1 | Total acidic/mmol g−1 |
|---|---|---|---|---|---|
| AC-F | 6.18 | 0.957 | 0.405 | 0.421 | 1.803 |
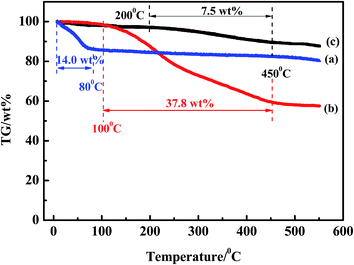
The TG curves for ACs were shown in Fig. 15. The weight loss of AC-F was 14.0 wt% before 80 °C, which was typically attributed to the removal of water.46 The TG curve for AC-A indicated the weight loss was 37.8 wt% at temperature between 100 °C and 450 °C. This was related to the removal of adsorbed compounds. However, from the TG curve of AC-R50, the weight loss (7.5 wt%) at temperature between 200 °C and 450 °C was the compounds remained in AC after 50 cycles. This was generally accepted that the weight loss at higher temperatures could be related to the decomposition of phenols, esters and carboxylic groups, basic in their chemical nature.47
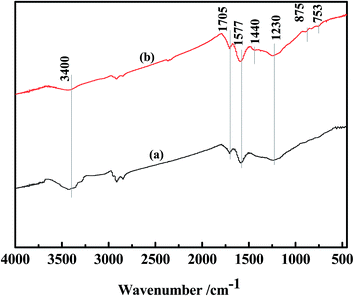
Fig. 16 showed the FT-IR spectra of AC-F and AC-R50, which identified the surface functional groups. For AC-F, the broad band around 3400 cm−1 was identified as the O–H stretching of carboxylic groups or hydroxyl groups.48 The band at 1705 cm−1 on the spectrum of AC-F was attributed to the stretching vibrations of C![[double bond, length as m-dash]](https://www.rsc.org/images/entities/char_e001.gif) O in carboxylic acid groups.49 The peak at 1230 cm−1 was the stretching vibrations of C–O in carboxyl acids or lactones.50 The band at 1577 cm−1 was ascribed to asymmetric COO− vibration.51 New peaks appeared on the spectra of AC-R50. The band at 1440 cm−1 attributed to the skeletal C
O in carboxylic acid groups.49 The peak at 1230 cm−1 was the stretching vibrations of C–O in carboxyl acids or lactones.50 The band at 1577 cm−1 was ascribed to asymmetric COO− vibration.51 New peaks appeared on the spectra of AC-R50. The band at 1440 cm−1 attributed to the skeletal C![[double bond, length as m-dash]](https://www.rsc.org/images/entities/char_e001.gif) C vibrations in aromatic rings.52 The weak band at 875 cm−1 assigned to aromatic C–H out of the plane bending vibrations.53 The weak band at about 753 cm−1 represented the out-of-plane deformation of the C–H bond in the benzene ring,54 which was the C–S bond in the thiophene ring.55 From the analysis of regeneration solution, we learn compounds remained in AC mainly included C2-DBT, C3-DBT and PAHs after 50 cycles.
C vibrations in aromatic rings.52 The weak band at 875 cm−1 assigned to aromatic C–H out of the plane bending vibrations.53 The weak band at about 753 cm−1 represented the out-of-plane deformation of the C–H bond in the benzene ring,54 which was the C–S bond in the thiophene ring.55 From the analysis of regeneration solution, we learn compounds remained in AC mainly included C2-DBT, C3-DBT and PAHs after 50 cycles.
3.7. Regeneration stability of AC and S-compounds analysis of recycled n-octane solution
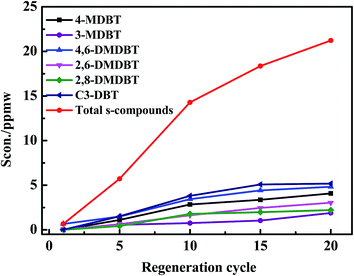
The regeneration efficiency held 73% after 50 cycles using fresh n-octane as a regeneration solvent. However, economic of the solvent regeneration would be significantly reduced due to the solvent was not recycled. So effect of n-octane as a recycled regenerating solvent on the regeneration stability of AC in this work. S-compounds analysis of recycled regeneration solution in different cycles was then analyzed by GC-SCD as shown in Fig. 18.The regeneration efficiency of n-octane for AC was 100% after the first cycle. However, the regeneration efficiency reduced to 60% after 6 cycles, basically held 45% after 20 cycles (Fig. 17). Although the regeneration performance of recycled n-octane for AC was less than fresh n-octane, recycled n-octane regeneration could be considered a solvent regeneration method for AC in this work. Moreover, further optimization process conditions of recycled solvent regeneration can improve the regeneration performance of AC.
 | ||
| Fig. 17 Regeneration stability of AC (regeneration conditions: 50 °C, 9.97 h−1 and 81 min with a recycled n-octane). | ||
The content of total S-compounds in regeneration solution increased from 0.76 to 21.22 ppmw as shown in Fig. 18. The content of each S-compound was in an increasing trend, and C3-DBT increased the maximum amount. This was due to the π–π extraction force existed between the sulfides in the recycled regenerating solution and the sulfides adsorbed on AC. However, the adsorbed substances on AC occupied some of the effective adsorption sites led to low selectivity of AC. So the regeneration efficiency of AC took on a descenting trend from the first cycle to 15 cycles. Extraction force was existed between regeneration solvent and S-compounds or hydrocarbons. Adsorption force was π–π force existed between AC and S-compounds. They were existed in the whole regeneration process, when the two forces reached balance, the regeneration efficiency of AC held 45% from 16 cycles to 20 cycles.
4. Conclusions
Adsorptions process of real diesel fuel containing paraffins, cycloparaffins, aromatics and S-compounds were analyzed by GC-SCD, GC-MS and GC. N-octane extraction performance of S-compounds and hydrocarbons outperformed than that of ethanol and cyclohexane. The regeneration efficiency of AC was 100% after first adsorption–desorption cycle, held near 73% after 50 cycles using fresh n-octane as a regenerating solvent, showing AC had a good regeneration stability. The extraction capability of n-octane for S-compounds and hydrocarbons decreased in the order of C1-DBT > C2-DBT > C3-DBT and paraffins ≥ cycloparaffins > monoaromatics > diaromatics > triaromatics. Due to S-compounds and PAHs having similar critical molecular diameter and the similar structure, the competitive desorption between PAHs and S-compounds mainly existed.The results of N2 adsorption–desorption isotherms and the NLDFT pore size distribution of ACs indicated that AC-R50 had pore shapes and pore size distribution similar to AC-F. After 50 cycles, both microporous volume and mesoporous volume of AC can be effectively recovery. According to the composition analysis of regeneration solutions and the characterization of AC samples, we found that C2-DBT, C3-DBT and PAHs occurred multilayer adsorption in mesopores (2–10 nm pore size), small hydrocarbons molecules and C1-DBT were aggregated in the micropores with the size of 1–2 nm. The regeneration efficiency of AC can maintain 45% after 20 cycles using n-octane as a recycled regeneration solvent. Moreover, further optimization conditions of recycled solvent regeneration process can improve the regeneration performance of AC.
Acknowledgements
The authors are grateful for the funding from the Project of the Natural Science Foundation of China under contract No. 51476074, the Sinopec Yangzi Petrochemical Co. Ltd. (Contract No. 30600000-10-ZC0613-2530057-0-4), the Sinopec Co. Ltd. (Contract No. 412122), and the Priority Academic Program Development of Jiangsu Higher Education Institutions (PAPD).References
- C. S. Song, Catal. Today, 2003, 86, 211–263 CrossRef CAS.
- V. C. Srivastava, RSC Adv., 2012, 2, 759–783 RSC.
- R. Nava, A. Infantes-Molina, P. Castaño, R. Guil-López and B. Pawelec, Fuel, 2011, 90, 2726–2737 CrossRef CAS.
- Z. Ismagilov, S. Yashnik, M. Kerzhentsev, V. Parmon, A. Bourane, F. M. Al-Shahrani, A. A. Hajji and O. R. Koseoglu, Catal. Rev., 2011, 53, 199–255 CAS.
- J. Li, L. N. Yang and J. Shen, Pet. Sci. Technol., 2011, 29, 247–253 CrossRef CAS.
- S. Kumar, V. C. Srivastava, S. M. Nanoti and B. R. Nautiyal, RSC Adv., 2014, 4, 38830–38838 CAS.
- C. P. Li, D. Li, S. S. Zou, Z. Li, J. M. Yin, A. L. Wang, Y. N. Cui, Z. L. Yao and Q. Zhao, Green Chem., 2013, 15, 2793–2799 RSC.
- Y. Shi, X. Zhang and G. Liu, ACS Sustainable Chem. Eng., 2015, 3, 2237–2246 CrossRef CAS.
- Y. Shen, P. Li, X. Xu and H. Liu, RSC Adv., 2012, 2, 1700–1711 RSC.
- S. Kumar, V. C. Srivastava and R. P. Badoni, Fuel, 2011, 90, 3209–3216 CrossRef CAS.
- W. M. Yang, W. Zhou, W. Z. Xu, H. Li, W. H. Huang, B. Jing, Z. P. Zhou and Y. S. Yan, J. Chem. Eng. Data, 2012, 57, 1713–1720 CrossRef CAS.
- M. J. Ahmed and M. Ahmaruzzaman, Int. J. Environ. Sci. Technol., 2015, 12, 2847–2856 CrossRef CAS.
- B. J. Liu, Y. B. Zhu, S. W. Liu and J. W. Mao, J. Chem. Eng. Data, 2012, 57, 1326–1330 CrossRef CAS.
- R. T. Yang, A. J. Hernández-Maldonado and F. H. Yang, Science, 2003, 301, 79–81 CrossRef CAS PubMed.
- S. Dasgupta, S. Divekar, A. Arya, P. Gupta, R. Chauhan, S. Bhadauria and A. Nanoti, RSC Adv., 2015, 5, 56060–56066 RSC.
- A. J. Hernández-Maldonado, F. H. Yang, G. Qi and R. T. Yang, Appl. Catal., B, 2005, 56, 111–126 CrossRef.
- C. Sentorun-Shalaby, S. K. Saha, X. Ma and C. Song, Appl. Catal., B, 2011, 101, 718–726 CrossRef CAS.
- S. Xun, W. Zhu, F. Zhu, Y. Chang, D. Zheng, Y. Qin and H. Li, Chem. Eng. J., 2015, 280, 256–264 CrossRef CAS.
- S. Achmann, G. Hagen, M. Hämmerle, I. Malkowsky, C. Kiener and R. Moos, Chem. Eng. Technol., 2010, 33, 275–280 CrossRef CAS.
- T. Jin, Q. Yang, C. Meng, J. Xu, H. Liu, J. Hu and H. Ling, RSC Adv., 2014, 4, 41902–41909 RSC.
- N. A. Khan and S. H. Jhung, Angew. Chem., 2012, 124, 1224–1227 CrossRef.
- H. X. Zhang, H. L. Huang, C. X. Li, H. Meng, Y. Z. Lu, C. L. Zhong, D. H. Liu and Q. Y. Ying, Ind. Eng. Chem. Res., 2012, 51, 12449–12455 CAS.
- M. Seredych, E. Deliyanni and T. J. Bandosz, Fuel, 2010, 89, 1499–1507 CrossRef CAS.
- J. Qiu, G. Wang, Y. Bao, D. Zeng and Y. Chen, Fuel Process. Technol., 2015, 129, 85–90 CrossRef CAS.
- S. P. Hernandez, D. Fino and N. Russo, Chem. Eng. Sci., 2010, 65, 603–609 CrossRef CAS.
- E. Vilarrasa-García, A. Infantes-Molina, R. Moreno-Tost, E. Rodríguez-Castellón, A. Jiménez-López, C. L. Cavalcante and D. C. Azevedo, Energy Fuels, 2010, 24, 3436–3442 CrossRef.
- N. F. Nejad, E. Shams and M. K. Amini, J. Magn. Magn. Mater., 2015, 390, 1–7 CrossRef.
- C. Yu, X. Fan, L. Yu, T. J. Bandosz, Z. Zhao and J. Qiu, Energy Fuels, 2013, 27, 1499–1505 CrossRef CAS.
- Y. Shi, X. Zhang and G. Liu, ACS Sustainable Chem. Eng., 2015, 3, 2237–2246 CrossRef CAS.
- Y. Shi, X. Zhang and G. Liu, Fuel, 2015, 158, 565–571 CrossRef CAS.
- W. Zhang, H. Liu, Q. Xia and Z. Li, Chem. Eng. J., 2012, 209, 597–600 CrossRef CAS.
- M. Seredych, J. Rawlins and T. J. Bandosz, Ind. Eng. Chem. Res., 2011, 50, 14097–14104 CrossRef CAS.
- B. S. Schueller and R. T. Yang, Ind. Eng. Chem. Res., 2001, 40, 4912–4918 CrossRef CAS.
- N. F. Nejad, E. Shams, M. K. Amini and J. C. Bennett, Microporous Mesoporous Mater., 2013, 168, 239–246 CrossRef.
- X. Han, E. Wishart and Y. A. Zheng, Can. J. Chem. Eng., 2014, 92, 884–891 CrossRef CAS.
- C. Yu, J. S. Qiu, Y. F. Sun, X. H. Li, G. Chen and Z. B. Zhao, J. Porous Mater., 2008, 15, 151–157 CrossRef CAS.
- M. Muzic, K. Sertic-Bionda and Z. Gomzi, Chem. Eng. Technol., 2008, 31, 355–364 CrossRef CAS.
- J. Xiao, C. Song, X. Ma and Z. L. Li, Ind. Eng. Chem. Res., 2012, 51, 3436–3443 CrossRef CAS.
- C. Pelekani and V. L. Snoeyink, Carbon, 2001, 39, 25–37 CrossRef CAS.
- J. Bu, G. Loh, C. G. Gwie, S. Dewiyanti, M. Tasrif and A. Borgna, Chem. Eng. J., 2011, 166, 207–217 CrossRef CAS.
- C. Pelekani and V. L. Snoeyink, Carbon, 2000, 38, 1423–1436 CrossRef CAS.
- M. Anbia and Z. Parvin, Chem. Eng. Res. Des., 2011, 89, 641–647 CrossRef CAS.
- J. Bu, G. Loh, C. G. Gwie, S. Dewiyanti, M. Tasrif and A. Borgna, Chem. Eng. J., 2011, 166, 207–217 CrossRef CAS.
- Y. X. Yang, H. Y. Liu, P. L. Ying, Z. X. Jiang and C. Li, Carbon, 2007, 45, 3042–3044 CrossRef CAS.
- C. O. Ania and T. J. Bandosz, Langmuir, 2005, 21, 7752–7759 CrossRef CAS PubMed.
- I. I. Salame and T. J. Bandosz, Langmuir, 1999, 15, 587 CrossRef CAS.
- J. L. Figueiredo, M. F. R. Pereira, M. M. A. Freitas and J. J. M. Orfao, Carbon, 1999, 37, 1379–1389 CrossRef CAS.
- N. Rambadu, R. Azargohar, A. K. Dalai and J. Adjaye, Fuel Process. Technol., 2013, 106, 501–510 CrossRef.
- T. Murayama and I. Yamanaka, J. Phys. Chem. C, 2011, 115, 5792–5799 CAS.
- M. J. Lazaro, L. Calvillo, E. G. Bordeje, R. Moliner, R. Juan and C. R. Ruiz, Microporous Mesoporous Mater., 2007, 103, 158–165 CrossRef CAS.
- Y. F. Jia and K. M. Thomas, Langmuir, 2000, 16, 1114–1122 CrossRef CAS.
- G. F. Zhao, P. Bai, H. M. Zhu, R. X. Yan, X. M. Liu and Z. F. Yan, Asia-Pac. J. Chem. Eng., 2008, 3, 284–291 CrossRef CAS.
- A. N. A. El-Hendawy, J. Anal. Appl. Pyrolysis, 2006, 75, 159–166 CrossRef CAS.
- F. Wan, L. Li, X. Wan and G. Xue, J. Appl. Polym. Sci., 2002, 85, 814–820 CrossRef CAS.
- K. Castillo, J. G. Parsons, D. Chavez and R. R. Chianelli, J. Catal., 2009, 268, 329–334 CrossRef CAS.
| This journal is © The Royal Society of Chemistry 2016 |

