DOI:
10.1039/C6RA01869F
(Paper)
RSC Adv., 2016,
6, 33599-33605
Enhanced breakdown strength and energy density in PVDF nanocomposites with functionalized MgO nanoparticles
Received
21st January 2016
, Accepted 21st March 2016
First published on 24th March 2016
Abstract
Dielectric polymer materials with high energy storage capability are highly desirable for use in both electric power and electronics industries. Previous studies have focused on developing polyvinylidene fluoride (PVDF)-based dielectric polymer materials with enhanced dielectric permittivity, but such nanocomposites also have a considerably decreased breakdown strength. In this study, we provide an effective strategy to considerably improve the breakdown strength of PVDF nanocomposites by introducing a small amount of functionalized MgO nanoparticles. The Weibull breakdown strength has been increased by 59% and the charge–discharge energy efficiency has also been considerably improved. This study's findings enable the design and development of advanced dielectric polymer nanocomposites with high breakdown strength and energy density for energy storage applications.
Introduction
Dielectric materials, which are used to control and store electric charge, are present in most modern electronics and electric power systems. Their ultrafast charge–discharge rate and ultrahigh power density have enabled the development of energy storage systems with high power density and energy capacity.1,2 Consequently, they are important components in mobile electronic devices, stationary power systems, and hybrid electric vehicles, as well as in pulse power applications such as medical devices and electric weapon systems.1,3–7 Compared with ceramics, polymer nanocomposites are easily processable, mechanically flexible, and lightweight. They can be operated at high voltages and electrical breakdown is quiet and non-disruptive; they are thus set to become the favored dielectric material for capacitors.5,6
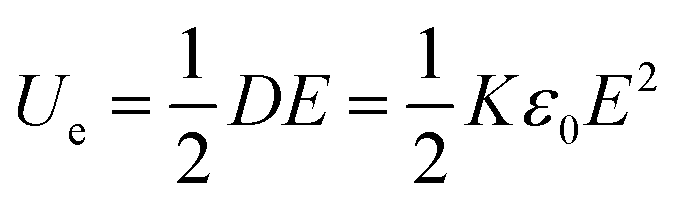
For linear dielectrics, the energy density (Ue) of capacitors is expressed as:
| |
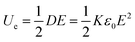 | (1) |
where
E is the applied electric field,
D is the induced electric displacement within the dielectric material,
K is the relative permittivity of the dielectrics and
ε0 is the permittivity of vacuum (8.85 × 10
−12 F m
−1).
According to eqn (1) there are two main ways to increase Ue: (1) by increasing the dielectric permittivity K or (2) increasing the breakdown strength (Eb) of the dielectric material. So far, most studies have focused on the former method. Either ceramic nanoparticles such as BaTiO3, TiO2, and lead zirconate titanate or conductive substance like graphene and nanoscale metal particles have been introduced into the polymer matrix to obtain a higher dielectric permittivity.6–16 However, the introduction of these particles always results in a decrease of breakdown strength because they introduce inhomogeneous electric fields and increase defects within the dielectric material.6–10 Hou and coworkers demonstrated enhancement in permittivity and energy density in PVDF/BaTiO3 nanocomposites with a maximum discharge energy density of 6.37 J cm−3 at 340 MV m−1.9 Reduced graphene oxide (rGO) was added in PVDF to fabricate PVDF/rGO composites and the dielectric constant increased from 10 to 41 with 0.1 wt% rGO while the breakdown strength decreased to 84 MV m−1.10
In this study, we focused on improving the breakdown strength. MgO was selected as the nanofiller as recent studies reported that addition of a small amount of MgO nanoparticles to polymer like LDPE and PP can increase the breakdown strength of the matrix effectively.17–20 PVDF was chosen as the polymer matrix owing to its large permittivity among dielectric polymer materials.4 Consequently, functionalized MgO nanoparticles were used to improve Eb of the polyvinylidene fluoride (PVDF) matrix and the dielectric properties of a PVDF/MgO nanocomposite were studied. We observed a considerable improvement of the energy charge–discharge efficiency in the nanocomposites compared with the pristine PVDF, which further led to an increased discharge energy density in the PVDF/MgO nanocomposites. The Weibull breakdown strength has reached up to 501.4 MV m−1 for the PVDF/MgO nanocomposite, with the maximum discharge energy density increased to 10.52 J cm−3.
Experimental
Surface modification of MgO nanoparticles
MgO nanoparticles with an average diameter of 50 nm, and a specific surface of 86.96 m2 g−1 were obtained from Aladdin Industrial Corporation. (3-Aminopropyl) triethoxy-silane (code name KH550) was chosen as the coupling agent to functionalize the nanoparticles.17 First, 5 g of MgO nanoparticles were vacuum-dried at 373 K for 12 h before being dispersed in 100 ml toluene by sonication for 30 min. Afterwards a KH550/toluene mixture (5 ml/50 ml) was slowly added to the nanoparticle suspension and then heated in an oil bath at about 373 K and stirred for 12 h. Finally, the nanoparticles were collected by centrifugation, washed with toluene to remove excess coupling agent, and dried overnight under vacuum at 333 K.
Fabrication of PVDF/MgO nanocomposite
First, the functionalized MgO nanoparticles were dispersed in N,N-dimethyl formamide (DMF) by tip-type sonication (120 W) for 30 min. Afterwards, PVDF powder (Solvey 6020) was dissolved in the MgO/DMF mixture at a concentration of 100 mg ml−1 and stirred for 12 h to form a homogeneous solution. Then the solution was spin-coated onto glass plates and dried at 343 K overnight to obtain nanocomposite films. The films were dried under vacuum at 343 K for another 24 h to remove the DMF solvent. PVDF/MgO nanocomposite films with different MgO loadings (1, 2, 3, 4 wt%) were fabricated using this method; the typical film thickness was around 25 μm.
Characterization
Fourier transform infrared spectroscopy (FTIR) spectra of MgO nanoparticles ranging from 400 to 4000 cm−1 were obtained in transmission mode with a Nicolet 6700 FTIR spectrometer. X-ray photoelectron spectra (XPS) spectrum of the nanoparticles were obtained using an Escalab 250XI XPS. Thermogravimetric analysis (TGA) was performed on the nanoparticles with a TA Q500 instrument. The nanocomposites' cross section morphology was studied using a scanning electron microscope (SEM) (Zeiss Sigma, Germany); the samples were sputtered with gold before the measurement. The DC breakdown strength measurements of the PVDF and nanocomposite films were performed under a sphere–sphere electrode configuration, with a DC voltage ramp of 500 V s−1. The films were immersed in silicone oil to prevent breakdown in air. Hysteresis loops of PVDF and nanocomposite films were obtained using a Sawyer–Tower circuit. The samples were sputtered with gold and a triangle wave with a frequency of 100 Hz was applied to the samples. The permittivity and dielectric loss of the films were obtained with an Alpha-A high-performance frequency analyzer (Novolcontrol, Germany). All of the measurements were carried out at room temperature with a 1 V alternating-current voltage. The DC volume resistivity measurements were performed using a standard three-electrode system.
Results and discussion
Characterization of surface modified MgO nanoparticles
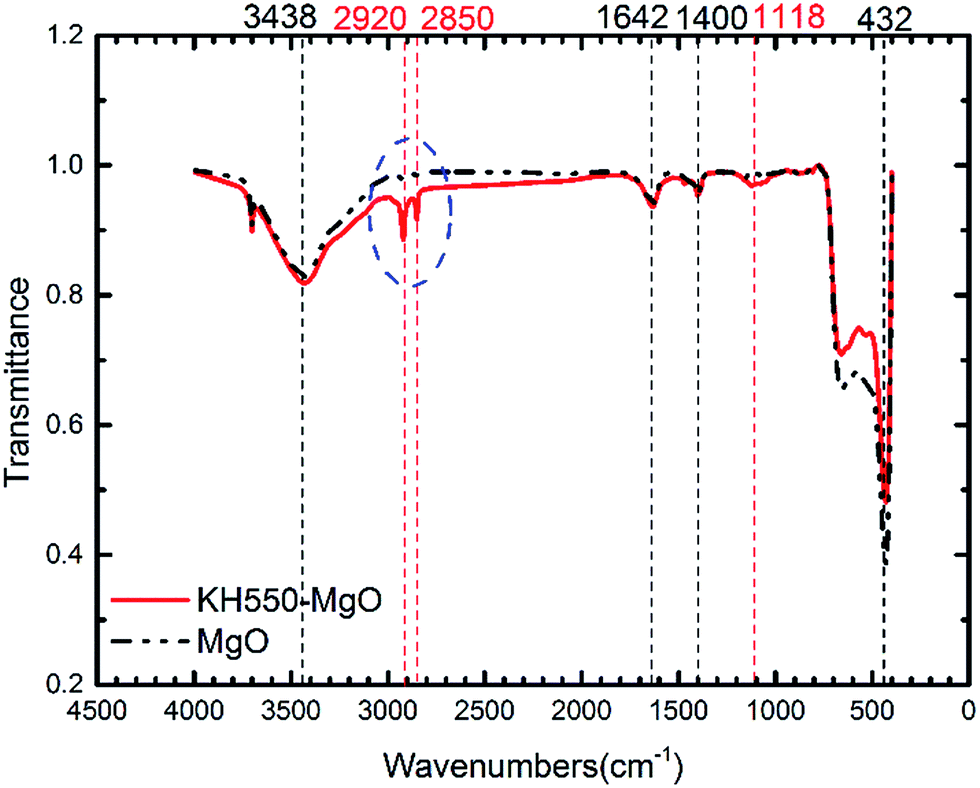
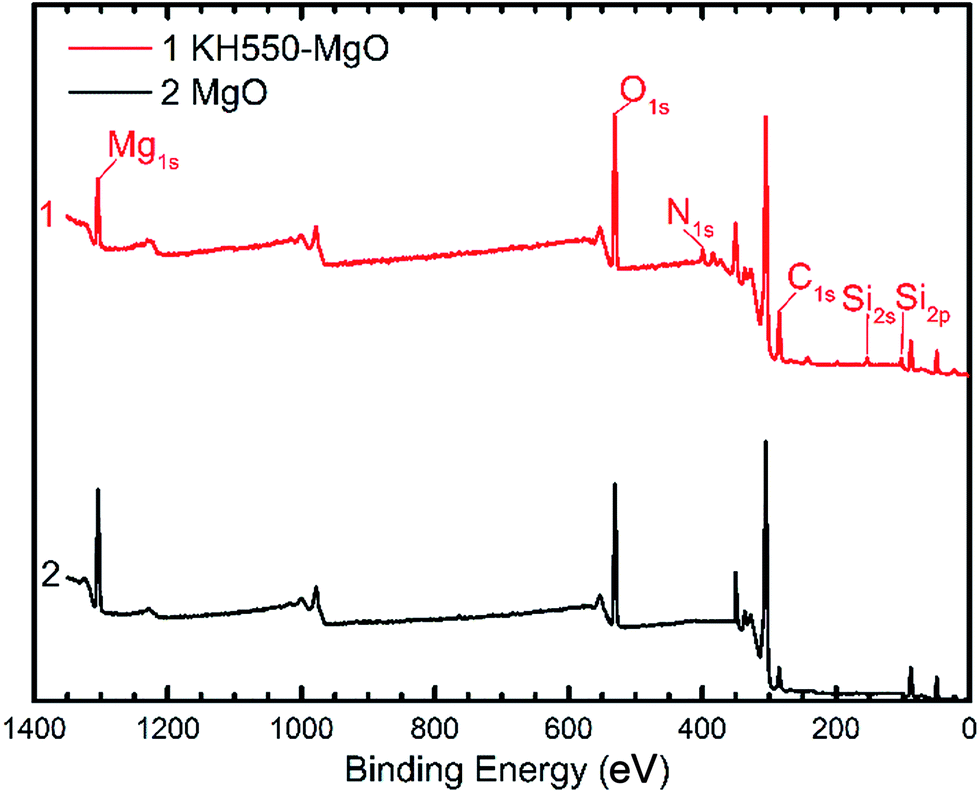
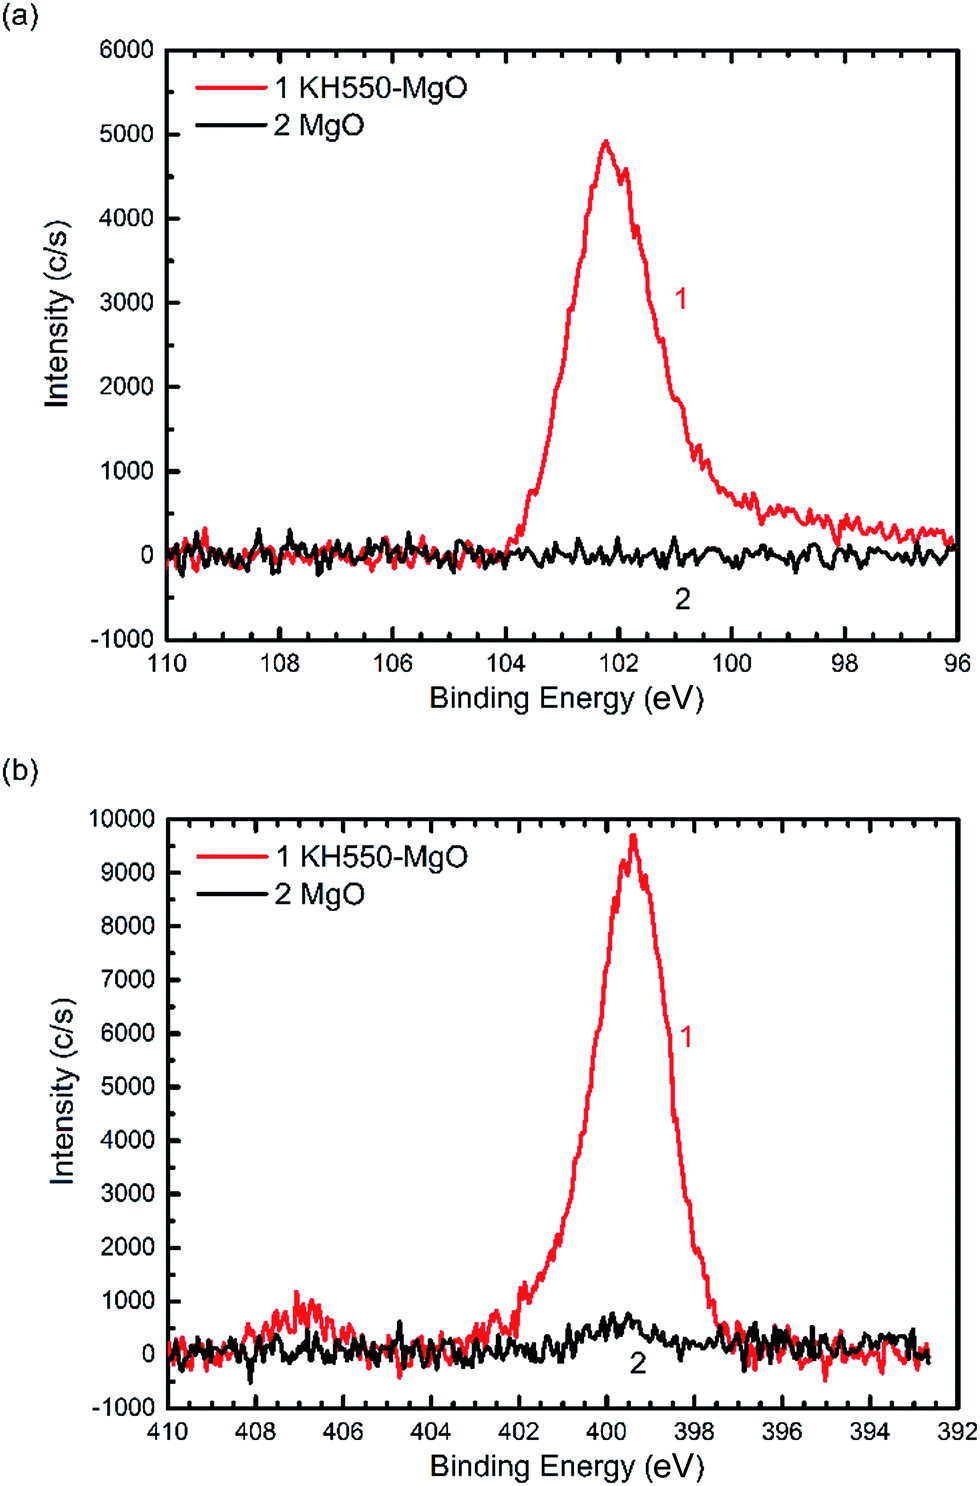
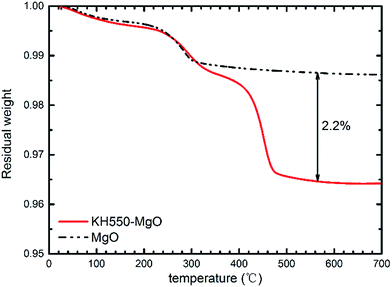
As illustrated in Fig. 1, the coupling agent (KH550) can be grafted onto the surface of MgO nanoparticles through a reaction with the hydroxyl groups attached to the MgO surface. Fig. 2 shows the FTIR spectra of the MgO nanoparticles with and without surface modification, while Table 1 lists the absorption peaks in the FTIR spectra. After surface modification new absorption peaks arise at 2920 and 2850 cm−1, which are assigned to the stretching mode of the C–H bond.17 Moreover, a new peak at 1118 cm−1 also indicates the existence of Si–O bonds.17 The FTIR results suggest that the coupling agent was coated onto the MgO nanoparticles. Furthermore, the typical XPS survey spectrum of the KH550 treated MgO and original MgO is shown in Fig. 3, and the XPS spectra of Si2p and N1s are shown in Fig. 4. The new peaks of Si2p and N1s after modification also indicate that KH550 was coated onto the surface of MgO nanoparticles successfully.21,22 Besides, the TGA results in Fig. 5 also provide quantitative evidence. Compared with the unmodified nanoparticles, the functionalized MgO nanoparticles undergo a large weight loss at around 400–600 °C, which we attribute to the loss of organics coated onto the nanoparticles.18
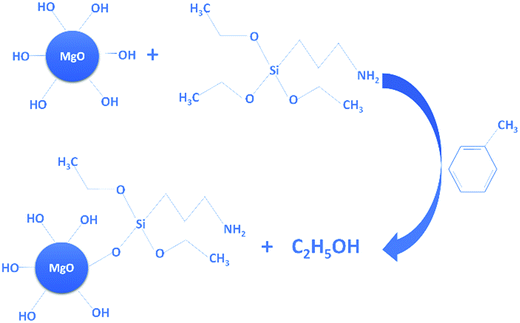 |
| | Fig. 1 Diagrams illustrating the surface modification of MgO nanoparticles. | |
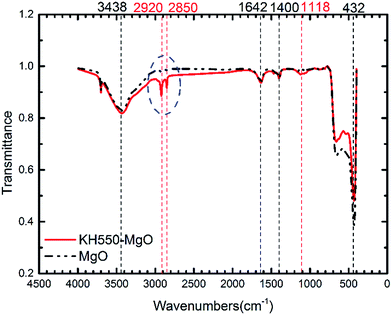 |
| | Fig. 2 The FTIR spectra of MgO nanoparticles with and without surface modification. | |
Table 1 FTIR peak assignments for MgO nanoparticles with and without surface modification
| Peak/cm−1 |
Without surface modification |
With surface modification |
| 432 |
Mg–O (stretching vibration) |
Mg–O (stretching vibration) |
| 3438 |
O–H (stretching vibration) |
O–H (stretching vibration) |
| 1642 |
O–H (stretching vibration) |
O–H (stretching vibration) |
| 1400 |
O–H (stretching vibration) |
O–H (stretching vibration) |
| 1118 |
— |
Si–O (stretching vibration) |
| 2920 |
— |
C–H (stretching vibration) |
| 2850 |
— |
C–H (stretching vibration) |
 |
| | Fig. 3 The XPS survey spectrum of the KH550 treated MgO and original MgO. | |
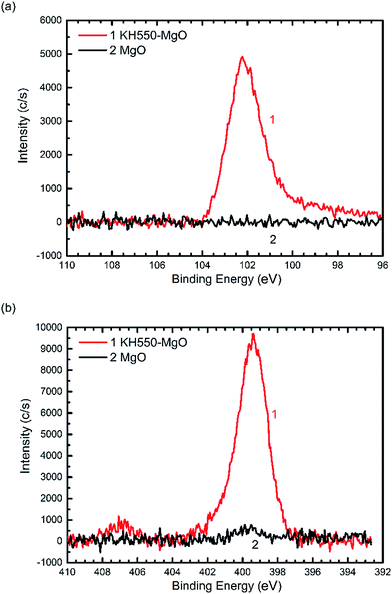 |
| | Fig. 4 The XPS spectra of MgO nanoparticles before and after modification (a) Si2p (b) N1s. | |
 |
| | Fig. 5 The TGA curves of MgO nanoparticles with and without surface modification. | |
Morphology
Fig. 6 shows cross section SEM images of PVDF/MgO nanocomposite films with 2 wt% and 4 wt% MgO. The images show that the MgO nanoparticles with an average diameter of less than 100 nm were well dispersed in the nanocomposites. Meanwhile, the compatibility between MgO nanoparticles and PVDF matrix was good; there were no visible defects, which we believe is mainly because the coated KH550 acted as a bridge-link and thereby enhanced the compatibility between MgO nanoparticles and PVDF.23
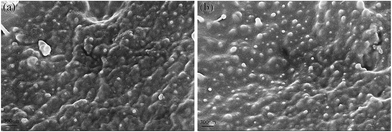 |
| | Fig. 6 The cross section SEM images of PVDF/MgO nanocomposite films with: (a) 2 wt% MgO (b) 4 wt% MgO. | |
Dielectric performance
The DC breakdown strength results of the pristine PVDF and PVDF/MgO nanocomposites are calculated using a two-parameter Weibull statistical distribution described by the equation:| | |
P(E) = 1 − exp(−(E/E0)β)
| (2) |
where E is the experimental breakdown strength, and P(E) is the cumulative probability as a function of E. E0 is the breakdown strength when the cumulative failure probability is 63.2% and is also referred to as the characteristic Weibull breakdown strength, Eb. β is the shape parameter that reflects the scatter of the breakdown strength E. According to the IEEE standard 930-2004, a good approximation for the most likely probability of failure is the following equation:| |
 | (3) |
where Pi is the i-th result when the values of the applied electric field are sorted in ascending order and n is the number of specimens.24
Fig. 7a shows the Weibull plots of the breakdown strength of PVDF and PVDF/MgO nanocomposites. For each sample, 40 specimens were tested. The calculated Weibull breakdown strength and shape parameters are plotted in Fig. 7b. It is apparent that there is a large enhancement of the electric breakdown strength in the PVDF/MgO nanocomposite compared with the pristine PVDF films. For 1 wt% MgO the highest value of 501.4 MV m−1 is achieved, which is 59% higher than the highest value achieved for pristine PVDF (314.5 MV m−1). Meanwhile, the PVDF/MgO nanocomposite with higher MgO content (2, 3, 4 wt%) show only a slight decrease of Eb compared with the PVDF/1 wt% MgO nanocomposite, which can probably be attributed to reduced nanoparticle aggregation in the 1 wt% nanocomposite. Generally speaking, large improvements of the dielectric breakdown strength can be achieved through the introduction of surface-modified MgO nanoparticles in PVDF nanocomposites, even at low weight percent.
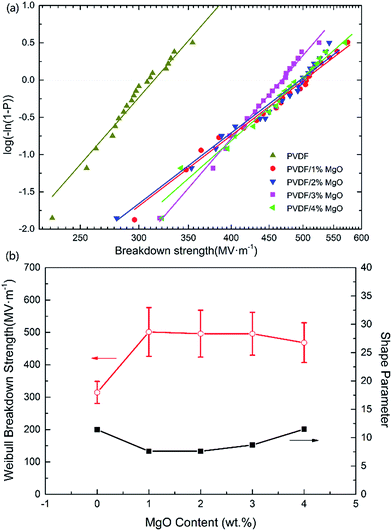 |
| | Fig. 7 (a) The Weibull plots for PVDF and PVDF/MgO nanocomposites. (b) The Weibull breakdown strength and shape parameter as functions of MgO content. | |
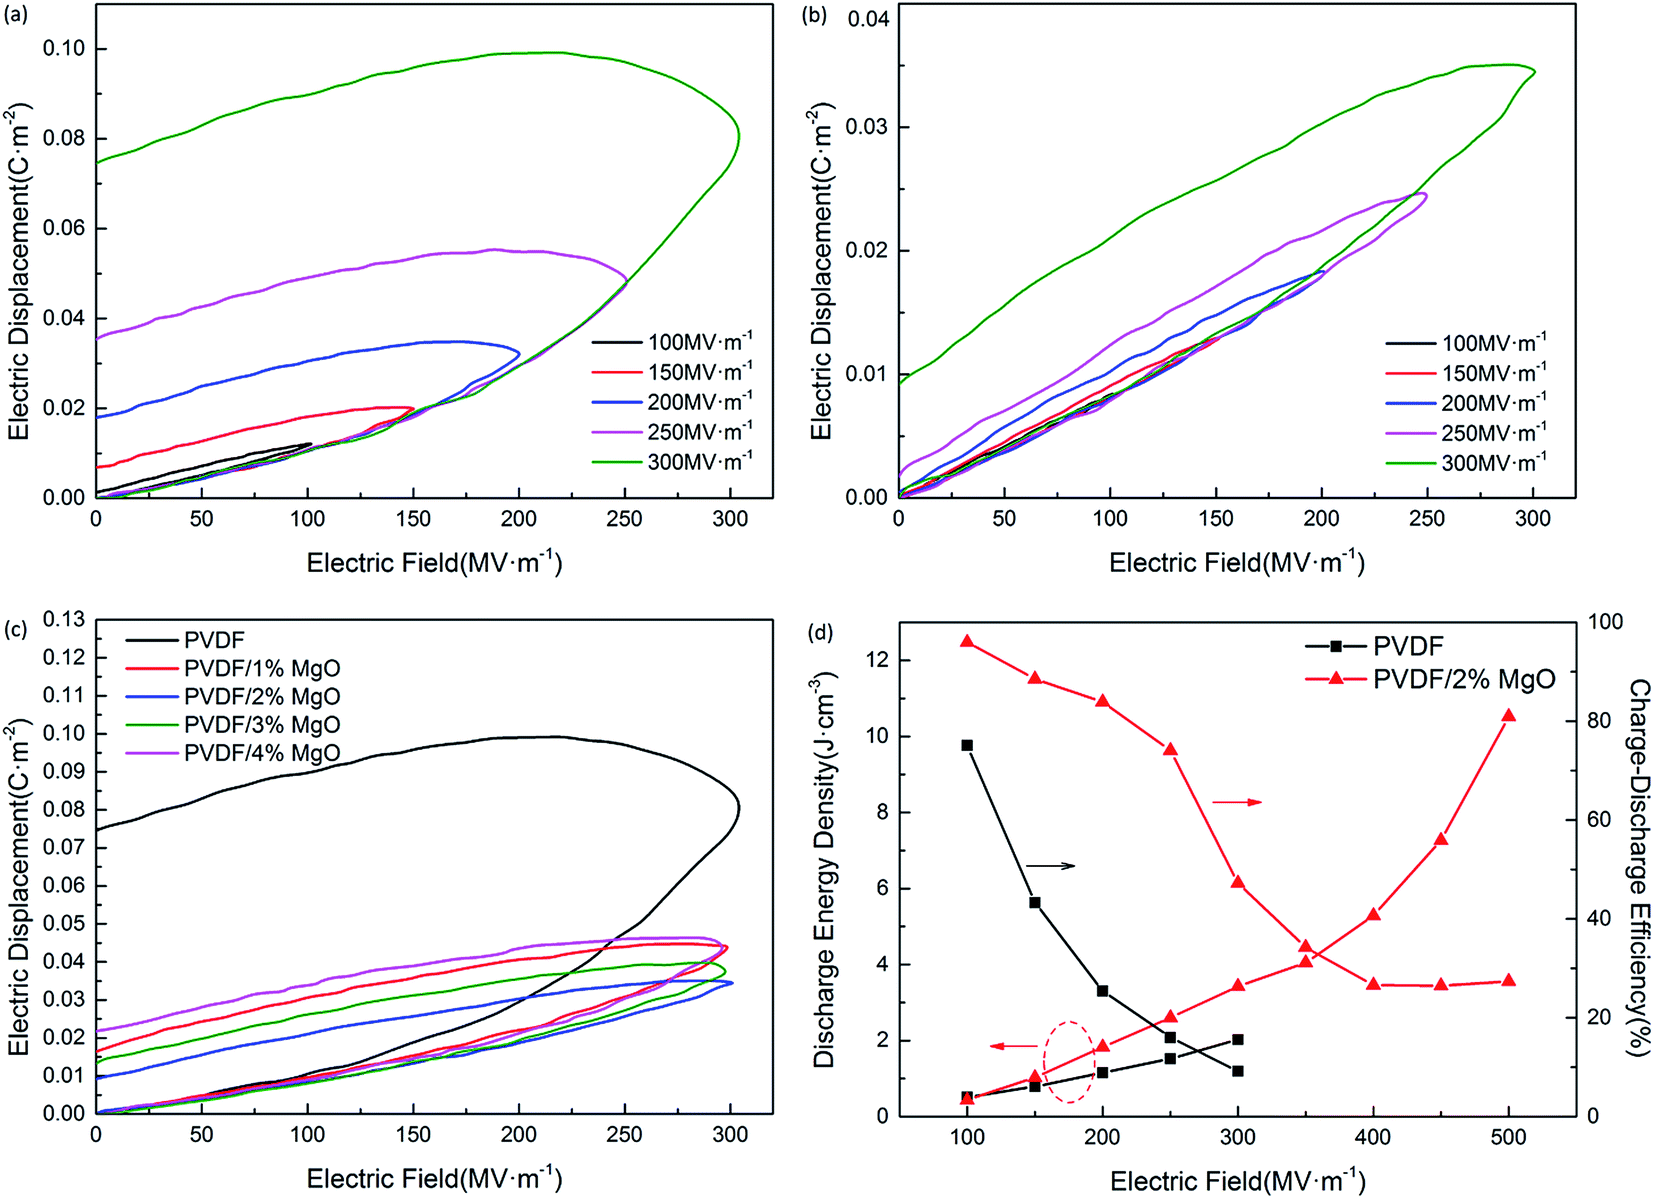
Fig. 8 shows hysteresis loops (D–E loops) of PVDF and PVDF/MgO nanocomposites obtained using a Sawyer–Tower circuit and the charge–discharge energy density is evaluated from the D–E loops according to:
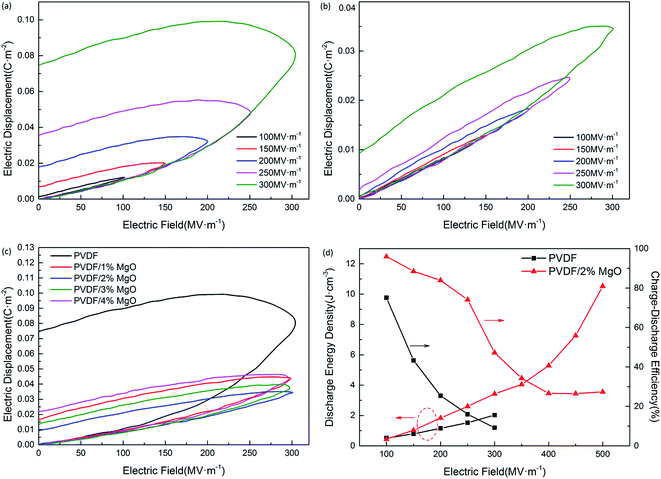 |
| | Fig. 8 The energy storage characteristics of the pristine PVDF and PVDF/MgO nanocomposites: D–E loops of (a) pristine PVDF; (b) PVDF/2 wt% MgO nanocomposite under a series of electric fields; (c) comparison of D–E loops of pristine PVDF and PVDF/MgO nanocomposite at an electric field of 300 MV m−1; (d) discharge energy density and charge–discharge efficiency of PVDF and PVDF/2 wt% MgO nanocomposite under a series of electric fields. | |
Compared with the pristine PVDF (plotted in Fig. 8a), the D–E loops of PVDF/2 wt% MgO nanocomposite are much slimmer (shown in Fig. 8b) and exhibit a more pronounced decrease in the remnant polarization (around 0.009 C m−2 at 300 MV m−1). Meanwhile the remnant polarization of pristine PVDF was 0.075 C m−2. The PVDF/MgO nanocomposite with 1, 3, and 4 wt% nanoparticle content displayed a similar tendency, as illustrated in Fig. 8c. Thus the charge–discharge efficiency is considerably improved, from 16.0% for the pristine PVDF sample at 250 MV m−1 to 74.1% for the PVDF/2 wt% MgO nanocomposite sample. As shown in Fig. 8d and Table 2, although the maximum dielectric displacement reduces, the PVDF/2 wt% MgO nanocomposites possess an enhanced discharge energy density over pristine PVDF, which is 3.43 J cm−3 at 300 MV m−1; this is 69% higher than that of pristine PVDF (2.03 J cm−3). Furthermore, because of this increased breakdown strength, the maximum discharge energy density of PVDF/MgO nanocomposites can reach up to 10.52 J cm−3 (with an MgO content of 2 wt% under an electric field of 500 MV m−1). Therefore, it can be concluded that the introduction of the functionalized MgO nanoparticles can tremendously lower energy loss in PVDF, thus giving rise to an increased energy density and efficiency in the nanocomposites.
Table 2 Comparison of discharge energy density and charge–discharge efficiency of PVDF and PVDF/2 wt% MgO nanocomposite
| Electric field/MV m−1 |
Discharge energy density/J cm−3 |
Charge–discharge efficiency/% |
| PVDF |
PVDF/2 wt% MgO |
PVDF |
PVDF/2 wt% MgO |
| 100 |
0.51 |
0.44 |
75.1 |
96.0 |
| 150 |
0.79 |
1.03 |
43.3 |
88.5 |
| 200 |
1.16 |
1.83 |
25.5 |
83.9 |
| 250 |
1.52 |
2.60 |
16.0 |
74.1 |
| 300 |
2.03 |
3.43 |
9.2 |
47.2 |
| 350 |
— |
4.04 |
— |
34.3 |
| 400 |
— |
5.29 |
— |
26.6 |
| 450 |
— |
7.27 |
— |
26.5 |
| 500 |
— |
10.52 |
— |
27.4 |
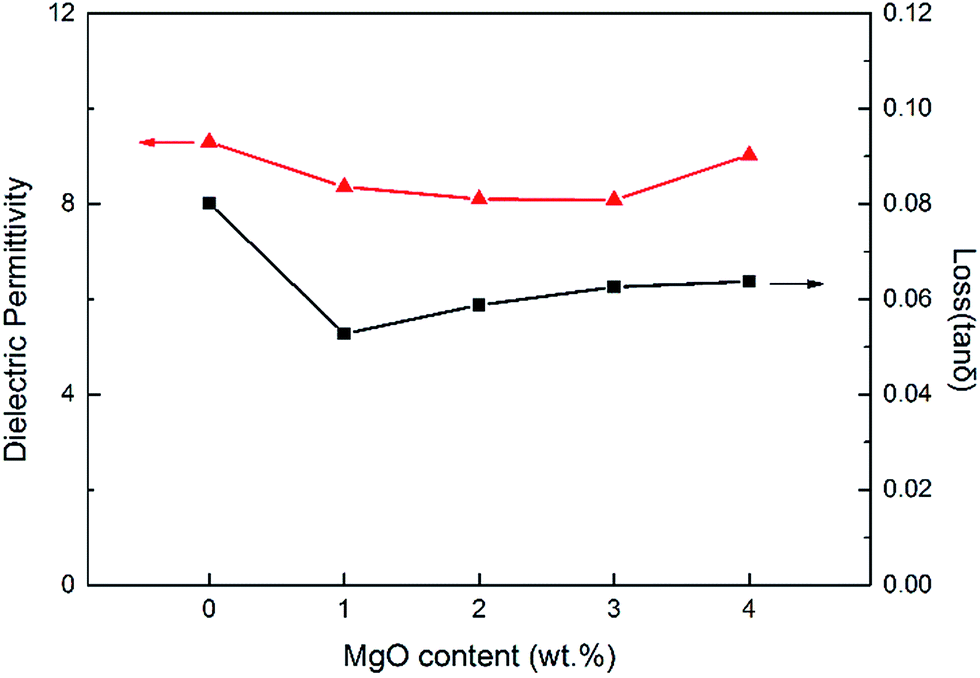
The permittivity and loss tangent of PVDF and PVDF/MgO nanocomposite are shown in Fig. 9. Generally speaking, both the matrix and nanocomposite show the same dependence of frequency. The dielectric permittivity decreases as the frequency increases mainly because the dipoles cannot shift their orientation sufficiently fast when the frequency is considerable high.12 The loss tangent presents a minimum value around 1 kHz, and it is possibly because the conduction loss become considerably large at low frequencies while the dipole relaxation loss increases at high frequencies. Comparably, the dielectric permittivity of PVDF/MgO nanocomposites is slightly smaller than that of pristine PVDF. This is probably because MgO has a dielectric permittivity of 9.7,25,26 which is slightly lower than that of PVDF. Furthermore, we suggest that the presence of the MgO nanoparticles hinders the dipole polarization of PVDF's molecular chain,27 thus decreasing the permittivity of the nanocomposites. The loss tangent of PVDF/MgO nanocomposites is also decreased, which is likely related to reduced conduction loss in the materials. Furthermore, the dielectric permittivity and loss tangent both show first a decrease and then an increase with increasing MgO content, especially at low frequencies such as 100 Hz (shown in Fig. 10). This could be caused by an increased aggregation of the MgO nanoparticles.
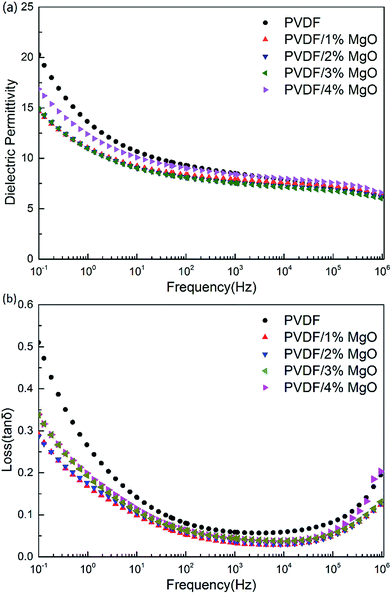 |
| | Fig. 9 The frequency dependence of (a) dielectric permittivity and (b) loss tangent of PVDF and PVDF/MgO nanocomposites at room temperature. | |
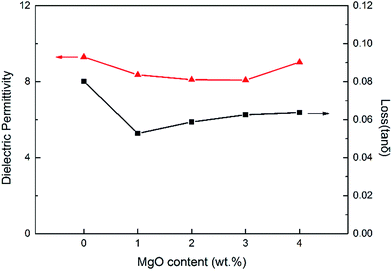 |
| | Fig. 10 The dielectric permittivity and loss tangent of PVDF and PVDF/MgO nanocomposites at 100 Hz as a function of MgO content. | |
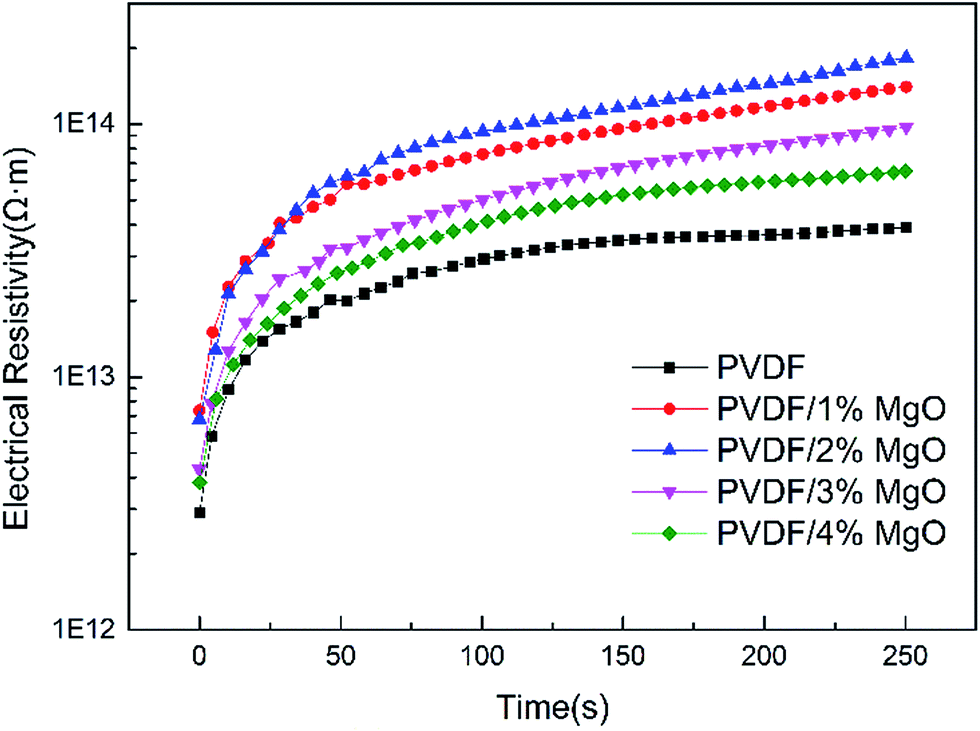
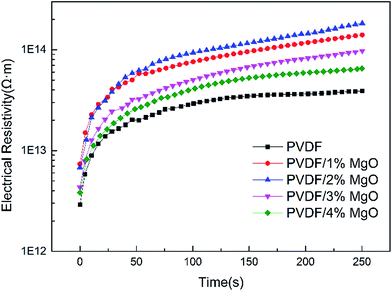
To fully characterize the enhancement of the breakdown strength and charge–discharge energy efficiency of the PVDF/MgO nanocomposites, electrical conduction measurements were taken; the results are shown in Fig. 11. As shown in Fig. 11, the introduction of MgO nanoparticles increases the electrical resistivity of PVDF. The resistivity of pristine PVDF is 3.9 × 10¹³ Ω m at a decay time of 250 s, while the resistivity of the PVDF/2 wt% MgO nanocomposite is 360% higher at 1.8 × 10¹⁴ Ω m. Moreover, the breakdown strength and electrical resistivity of PVDF/MgO nanocomposite share a similar dependence of MgO content. In conclusion, the existence of functionalized MgO nanoparticles can enormously increase the electrical resistivity of the PVDF nanocomposites, which we believe is related to the improved electrical breakdown strength of the polymer.4 Additionally, the increased resistivity causes lower conduction leakage current and loss, which leads to the reduced dielectric loss tangent and the increased energy efficiency.
 |
| | Fig. 11 The electrical resistivity of PVDF and PVDF/MgO nanocomposite under an electric field of 5 MV m−1. | |
Furthermore, previous studies indicate that the presence of MgO nanoparticles act as traps for the injected charges and decrease the space charge formation in polymer materials.17–20,28 This effect reduces the local field distortion at the electrodes. In addition, the similar permittivity between PVDF and MgO avoided large local field distortion which occurs when there is large permittivity contrast in the two phases.6 Eventually, more homogeneous local field and enhancement in electrical breakdown strength of the materials were generated. Additionally, reductions in the hysteresis loss of dielectric materials are largely caused by reductions in charge polarization loss. Hence, the decreased space charge formation should lead to a reduced space charge polarization loss, which would also increase charge–discharge energy efficiency in the nanocomposites.
Conclusions
In this work, PVDF and PVDF/MgO nanocomposite films were fabricated via solution-casting process. The morphology, DC breakdown strength, energy storage capability, dielectric permittivity, loss tangent and DC electrical resistivity of the films were investigated. After modifying the nanoparticle surface with KH550, a good dispersion of the MgO nanoparticles in the nanocomposite was obtained. Introducing a small amount of functionalized MgO nanoparticles caused a considerable enhancement of the dielectric breakdown strength, charge–discharge efficiency, and energy density owing to the MgO nanoparticles trapping the injected charge, reducing space charge formation and increasing the electrical resistivity of the nanocomposite. As a result, a more uniform electric field in the bulk, higher electrical resistivity and decreased dielectric loss were obtained. The Weibull breakdown strength has been increased from 314.5 MV m−1 for pristine PVDF to 501.4 MV m−1 for the PVDF/MgO nanocomposite. The maximum energy density of the PVDF/MgO nanocomposite increased to 10.52 J cm−3, while it was 2.03 J cm−3 for pristine PVDF. This study will contribute to the development of advanced dielectric polymer nanocomposites with high breakdown strength and energy density for energy storage applications.
Acknowledgements
This work was supported by the National Basic Research Program of China (2014CB239504) and National Natural Science Foundation of China (No. 51207009, 51377010 and 51425201).
Notes and references
- B. Chu, X. Zhou and K. Ren, Science, 2006, 5785, 334–336 CrossRef PubMed.
- X. Zhang, Y. Shen and Q. Zhang, Adv. Mater., 2015, 27, 819–824 CrossRef CAS PubMed.
- Q. Li, L. Chen and M. R. Gadinski, Nature, 2015, 7562, 576–579 CrossRef PubMed.
- Q. Li, G. Zhang and F. Liu, Energy Environ. Sci., 2015, 8, 922–931 CAS.
- Q. Li, K. Han and M. R. Gadinski, Adv. Mater., 2014, 36, 6244–6249 CrossRef PubMed.
- Z. M. Dang, J. K. Yuan and S. H. Yao, Adv. Mater., 2013, 44, 6334–6365 CrossRef PubMed.
- P. Barber, S. Balasubramanian and Y. Anguchamy, Materials, 2009, 4, 1697–1733 CrossRef.
- Q. Wang and L. Zhu, J. Polym. Sci., Part B: Polym. Phys., 2011, 49, 1421–1429 CrossRef CAS.
- Y. Hou, Y. Deng and Y. Wang, RSC Adv., 2015, 88, 72090–72098 RSC.
- L. Huang, C. Lu and F. Wang, RSC Adv., 2014, 85, 45220–45229 RSC.
- L. Gao, J. He and J. Hu, J. Phys. Chem. C, 2014, 118, 831–838 CAS.
- H. Tang and H. A. Sodano, Appl. Phys. Lett., 2013, 102(6), 063901 CrossRef.
- S. F. Mendes, C. M. Costa and R. S. i Serra, J. Polym. Res., 2012, 19, 1–14 CrossRef CAS.
- J. Shang, Y. Zhang and L. Yu, Mater. Chem. Phys., 2012, 134, 867–874 CrossRef CAS.
- B. P. Mandal, K. Vasundhara and E. Abdelhamid, J. Phys. Chem. C, 2014, 118, 20819–20825 CAS.
- H. P. Xu, H. Q. Xie and D. D. Yang, J. Appl. Polym. Sci., 2011, 122, 3466–3473 CrossRef CAS.
- S. Peng, J. He and J. Hu, IEEE Trans. Dielectr. Electr. Insul., 2015, 22, 1512–1519 CrossRef CAS.
- Y. Zhou, J. He and J. Hu, J. Appl. Polym. Sci., 2016, 133, 42863 Search PubMed.
- Y. Murakami, M. Nemoto and S. Okuzumi, IEEE Trans. Dielectr. Electr. Insul., 2008, 15, 33–39 CrossRef CAS.
- S. Ju, H. Zhang and M. Chen, Composites, Part A, 2014, 66, 183–192 CrossRef CAS.
- H. Li, R. Wang and H. Hu, Appl. Surf. Sci., 2008, 255, 1894–1900 CrossRef CAS.
- C. Cai, Z. Shen and Y. Xing, J. Phys. D: Appl. Phys., 2006, 39, 4829 CrossRef CAS.
- Z. M. Dang, H. Y. Wang and H. P. Xu, Appl. Phys. Lett., 2006, 89, 2902 CrossRef.
- IEEE Std 930-2004, Guide for the Statistical Analysis of Electrical Insulation Breakdown Data, International Electrotechnical Commission, Geneva, Switzerland, 2004 Search PubMed.
- J. Krupka, R. G. Geyer and M. Kuhn, IEEE Trans. Microwave Theory Tech., 1994, 42, 1886–1890 CrossRef CAS.
- J. S. Thorp, N. E. Rad and D. Evans, J. Mater. Sci., 1986, 21, 3091–3096 CrossRef CAS.
- D. Fragiadakis, P. Pissis and L. Bokobza, Polymer, 2005, 46, 6001–6008 CrossRef CAS.
- E. Kanegae, Y. Ohki and T. Tanaka, 2010 10th IEEE International Conference on Solid Dielectrics, 2010, pp. 1–4 Search PubMed.
|
| This journal is © The Royal Society of Chemistry 2016 |
Click here to see how this site uses Cookies. View our privacy policy here. 
 ,
Yao Zhou,
Si-min Peng,
Jin-liang He and
Zhi-min Dang
,
Yao Zhou,
Si-min Peng,
Jin-liang He and
Zhi-min Dang