Facile synthesis and evaluation of quercetin reduced and dextran sulphate stabilized gold nanoparticles decorated with folic acid for active targeting against breast cancer†
Raja Modhugoor Devendirana,
Senthil kumar Chinnaiyanb,
Narra Kishore Yadavb,
Giriprasath Ramanathana,
Sivakumar Singaravelua,
Paramasivan Thirumalai Perumal*c and
Uma Tirichurapalli Sivagnanam*a
aBioproducts Lab, CSIR-Central Leather Research Institute, Chennai-600020, Tamilnadu, India. E-mail: suma67@gmail.com; Fax: +91 44 24911589; Tel: +91 44 24420709
bDepartment of Pharmaceutical Technology, Anna University, BIT campus, Tiruchirappalli-620024, India
cOrganic Chemistry Division, CSIR-Central Leather Research Institute, Adyar, Chennai-600020, Tamilnadu, India. E-mail: ptperumal@gmail.com; Fax: +91 44 24911539; Tel: +91 44 24437223
First published on 24th March 2016
Abstract
In the present work, gold nanoparticles (GNPs) were successfully prepared by green synthesis using a strong antioxidant Quercetin (Q) as a reducing agent in the presence of Dextran Sulphate (DS) as a stabilizing agent at room temperature (DS–Q–GNPs). DS–Q–GNPs were characterized by several in vitro techniques to understand their physiochemical and biological properties. However, the average particle size was found to be around 38 nm, and the zeta potential of DS–Q–GNPs was found to be around −42 mV, indicating that the particles were highly stable. TEM results showed that the particles prepared were nearly spherical and crystalline in nature. DS–Q–GNPs exhibited good stability and showed excellent biocompatibility in MTT assay using the NIH 3T3 fibroblast cell line. Similarly, hemocompatibility and in vivo zebra fish toxicity studies confirmed that the DS–Q–GNPs were highly biocompatible and safe in vivo. Doxorubicin (DOX) was successfully loaded on DS–Q–GNPs and decorated with folic acid (FA) for targeting drug delivery to the cancer site (DOX–DS–Q–GNPs–FA). In vitro drug release studies revealed the drug was released in a controlled manner. The anticancer activity of DOX–DS–Q–GNPs–FA against the human breast cancer cell lines (MCF-7) was evaluated using MTT assay. Both doxorubicin loaded GNPs and the free doxorubicin inhibit the growth of MCF-7 cells in a concentration-dependant manner. The enhanced activity of DOX–DS–Q–GNPs–FA against MCF-7 cells was observed with its effect on the cell cycle progression of MCF-7 cells using flow cytometry. Similarly, Western blotting was employed to understand the cell cycle pathways during the treatment of DOX–DS–Q–GNPs–FA. It was found that DOX-loaded DS–Q–GNPs conjugated with FA represent a new potential delivery system for improved cancer therapy.
1. Introduction
Breast cancer is considered as one of the most commonly occurring cancers in women, and it is the second leading cause of cancer deaths in women.1 Moreover, breast cancer is highly metastatic and so significantly decreases the survival rate of breast cancer patients.2 In the past few decades, the incidence of breast cancer has gone high especially in Asian countries. It has been reported that in India over about 90![[thin space (1/6-em)]](https://www.rsc.org/images/entities/char_2009.gif) 000 cases were diagnosed annually.3 Breast cancer treatment can include surgery, chemotherapy and radiation therapy. Furthermore, chemotherapeutic agents that are widely used in the treatment of breast cancer include anthracyclines, antimetabolites, alkylating agents and alkaloids. However, the prolonged use of these agents results in various side effects.4
000 cases were diagnosed annually.3 Breast cancer treatment can include surgery, chemotherapy and radiation therapy. Furthermore, chemotherapeutic agents that are widely used in the treatment of breast cancer include anthracyclines, antimetabolites, alkylating agents and alkaloids. However, the prolonged use of these agents results in various side effects.4
Doxorubicin (DOX) is an anthracycline antibiotic frequently used in chemotherapy of many common human cancers including breast cancer.5,6 DOX is limited by its cumulative dose-dependent cardiotoxicity, and moreover the repeated administration of doxorubicin also results in the drug-resistant cells within the tumor. One of the best ways to overcome the delivering the DOX using a suitable nanocarrier with therapeutic efficacy at the tumor site and limits the distribution to normal tissues.7,8
The gold nanoparticles (GNPs) received a predominant attention as nanocarriers due to their unique biocompatibility and surfaces fictionalization, which makes them as a suitable carrier for targeted drug delivery application.9 GNPs were synthesized by different physical and chemical methods. However green synthesis GNPs has become familiar with the green chemistry methods are simple, economically cheap and environmentally safe and more over the green synthetic methods yields biocompatible nanoparticles which are suitable for biological applications.10 Biosynthesis of GNPs by plant phytochemicals is currently under exploitation. Many biomolecules in plants such as proteins/enzymes, amino acids, polysaccharides, alkaloids, alcoholic compounds, and vitamins could be involved in reduction and stabilization of nanoparticles.11 It has been shown that flavones such as apigenin,12 dihydromyricetin,13 tannic acid14 and rutin15 were able to reduce HAuCl4 solution to form GNPs.
Quercetin (Q), a glycone flavonoid found in many plants with strong antioxidant because of its ability to scavenge free radicals and forms complexes with metal ions.16,17 In general different drug molecules can be loaded on GNPs surfaces via ionic or covalent bonding or by physical absorption.18 Loading of the drug on nanoparticles through electrostatic or hydrogen bonds may be a sufficient approach than covalent linkages.19
Considering this fact, in the present study GNPs were synthesized using Q as reducing agent and dextran sulphate (DS) as the capping agent. DS will wrap itself around the GNPs during stabilization and be an anionic polymer it gives a net anionic charge on GNPs. By exploiting this situation, cationic DOX can be quickly loaded on to anionic GNPs by simple electrostatic interaction mechanism. However, the most important limitations of anti-cancer drug delivery is to lack specificity. An active targeting is a technique of delivering the drug-loaded nanocarriers to tumors by exploiting the distinctive features between cancer and healthy cells. This strategy was more suitable for cancer therapy because of high precision in delivering the therapeutics to the target tumor site.20 Among different active targeting, strategies surface functionalization of nanocarriers with targeting ligands with affinity to receptors were the easy, effective and widely accepted approach.21 Folic acid (FA) can be used as a non-immunogenic ligand to target the folate receptors (FRs). The FRs was often over expressed on the surface of breast cancer cells through receptor-mediated endocytosis through folic acid functionalization.22
The ultimate aim of the present study was the green synthesis of GNPs using quercetin and subsequent DOX loading and folic acid functionalization on GNPs (Scheme 1) and characterization of DOX-loaded GNPs by investigating their drug release properties and antiproliferative effects on MCF-7 cells for potential utilization as a targetable drug delivery system in breast cancer treatment.
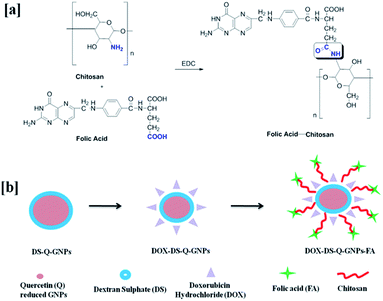 | ||
| Scheme 1 Schematic representation for (a) mechanism of folic acid–chitosan conjugation and (b) synthesis of quercetin reduced and dextran sulphate stabilized gold nanoparticles. | ||
2. Experimental methods
Chloroauric acid (HAuCl4), doxorubicin hydrochloride, quercetin, dextran sulphate sodium salt, chitosan (molecular weight 150 kDa, deacetylation degree 85%), folic acid 1-(3-dimethylaminopropyl)-3-ethylcarbodiimide hydrochloride (EDC), DMEM medium, fetal bovine serum, MTT (3-(4,5-dimethylthiazolyl-2)-2,5-diphenyltetrazolium bromide) were obtained from Sigma-Aldrich Chemicals (India). Human breast cancer MCF-7 cell lines were obtained from National centre for cell sciences (NCCS), India. E3 medium, a standard medium to work with zebra fish embryos (34.8 g NaCl, 1.6 g KCl, 5.8 g CaCl2·2H2O, 9.78 g MgCl2·6H2O), to prepare a stock solution (60×). Dissolve the given amount of salts in 2 L of water. Adjust the pH to 7.2 with NaOH and autoclave it. To prepare 1× medium, dilute 16.5 mL of the 60× stock solution to 1 L using sterile water. All experiments were performed in compliance with Committee for the Purpose of Control and Supervision of Experiments on Animals guidelines (CPCSEA), and performed after the approval from the Institutional Animal Care and Use Committee (IACUC).Synthesis of GNPs
GNPs were prepared by the reduction of 1 mM HAuCl4 with Q in the presence of DS. 200 μL of 1 mM HAuCl4 was mixed well with 200 μL 0.5% DS w/v solution. To determine the effect of Q concentration on the formation of GNPs varying quercetin solution (1% w/v in 0.5% NaOH) volumes (2, 4, 6, 8 and 10 μL) were used for reduction of above mixture. The reaction occurred very rapidly leading to the development of a ruby-red color indicating the formation of Q reduced DS capped GNPs (DS–Q–GNPs) within 3 minutes. ICP-OES analysis was performed to know the concentration of gold in the sample.Characterization techniques
The UV-vis absorption spectra of the synthesized DS–Q–GNPs were recorded using UV-VIS Spectrophotometer (Analytica Jena, Germany). The samples were scanned in the range of 400 to 800 nm. The dried DS–Q–GNPs were loaded on the stubs by using conductive carbon tapes and the morphology, and elemental composition of GNPs was investigated by using field emission electron microscopy coupled with energy-dispersive spectroscopy. The shape and size of the DS–Q–GNPs were measured by TEM analysis. Samples were appropriately diluted using deionised water, sonicated well, and a drop of gold nanoparticles suspension was loaded on a grid and vacuum dried and analyzed by using FEI Tecnai G2 F20 S-Twin transmission electron microscope equipped with selected area electron diffraction pattern (SAED). The mean particle size was measured by Photon correlation spectroscopy (PCS) (Malvern Instruments 3000SH, UK). The sample was diluted with double distilled water to an appropriate scattering intensity. The surface charge of DS–Q–GNPs was determined by measurement of zeta potential. The lyophilized powder of DS–Q–GNPs was subjected to X-ray diffraction analysis (Seifert JSO-Debye flex 2002) at an operating voltage of 40 kV and a current of 30 mA with Cu Kα1 radiation (wavelength = 1.54056 Å).In vitro stability studies of DS–Q–GNPs
The stability of synthesized DS–Q–GNPs was analyzed in conditions mimicking physiological environment (phosphate buffer pH 1.2, 4.5, pH 6.8 and pH 7.4) and normal saline. 200 μL of DS–Q–GNPs was added to eppendorf tubes containing 800 μL of normal saline and buffer solutions and incubated at 37 ± 1 °C for a period of 48 h. In vitro stability was evaluated by analyzing the variation in SPR band after the incubation period using UV-visible spectroscopy.Temperature dependent stability
DS–Q–GNPs was stored in screw capped vials and incubated at 4 °C and 25 °C for a period of 3 months to confirm the storage stability. SPR bands of DS–Q–GNPs were monitored by UV-vis spectroscopy to understand their stability.FT-IR analysis
FT-IR analysis was performed for lyophilized chitosan, folic acid, FA–chitosan, DS, Q, DOX, DOX–DS–Q–GNPs and DS–Q–GNPs. FT-IR analysis of the samples was performed in an ABB 3000 Fourier transform infra-red spectrometer between 4000 and 400 cm−1 using KBr pellet technique.Haemolytic assay
Briefly, 30 μL of RBC suspension was added to the eppendorf tubes containing varying concentrations of DS–Q–GNPs (5, 10, 15, 20 and 25 μM) in heparinised buffer. Samples were incubated at 37 °C for about 2 h. At the end of incubation period, samples were centrifuged at 18![[thin space (1/6-em)]](https://www.rsc.org/images/entities/char_2009.gif) 000 rpm for 10 min at 4 °C. Free haemoglobin content in supernatant was analyzed by measuring the absorbance at 540 nm. Samples containing RBC suspension with heparinised buffer was considered as negative control and samples containing RBC suspension with distilled water was considered as positive control. Percentage of haemolysis was calculated according to given formula.
000 rpm for 10 min at 4 °C. Free haemoglobin content in supernatant was analyzed by measuring the absorbance at 540 nm. Samples containing RBC suspension with heparinised buffer was considered as negative control and samples containing RBC suspension with distilled water was considered as positive control. Percentage of haemolysis was calculated according to given formula.In vitro biocompatibility studies
In vitro biocompatibility evaluation of DS–Q–GNPs was performed using NIH 3T3 fibroblasts cells. Fibroblast cells at the exponential growth phase were seeded in wells of cell culture plate and were incubated at 37 °C in CO2 incubator at 5% CO2. Various concentration of DS–Q–GNPs (10, 25, 50, 75, 100, 125 and 150 μM) were added in to the wells containing cells. Every concentration was maintained in triplicate. After 24 h incubation, MTT working solution was added and incubated for a period of 4 h. Formazan crystals formed were solubilized using DMSO and purple colour developed was measured using multi plate reader operating at 570 nm wavelength. Cells maintained under same conditions without the addition of DS–Q–GNPs were treated as control and were considered 100% viable.Evaluation of in vivo toxicity using zebra fish embryo model
After natural mating of zebra fishes, embryos ∼2 h post fertilization (hpf), were collected from the tank and cleaned well by washing with E3 medium. 10 embryos were transferred to each well of a 24 well plate containing 1 mL of E3 medium. Different concentrations of DS–Q–GNPs (400, 800, 1200, 1600 and 2000 ng mL−1) were added to wells containing zebra fish embryos and incubated for 96 h. Embryos untreated with DS–Q–GNPs were served as control. In vivo toxicity was assessed by studying the hatching rate, percentage survival rate and morphology of embryos.Doxorubicin loaded gold nanoparticles (DOX–DS–Q–GNPs)
0.5 mL of stock solution (1 mg mL−1) of DOX was added to 2 mL of DS–Q–GNPs solution and kept overnight for incubation at 4 °C. Unbound DOX was removed from the reaction mixture by centrifugation process (14![[thin space (1/6-em)]](https://www.rsc.org/images/entities/char_2009.gif) 000 rpm for 10 min) and its concentration in supernatant was calculated using UV-vis spectroscopy at 485 nm. Finally, the drug loading was calculated by indirect method.
000 rpm for 10 min) and its concentration in supernatant was calculated using UV-vis spectroscopy at 485 nm. Finally, the drug loading was calculated by indirect method.Folic acid conjugation on DOX–DS–Q–GNPs
Folic acid (FA) (50 mg) was dissolved in 10 mL of 0.1 M of NaOH together with EDC (molar ratio 1![[thin space (1/6-em)]](https://www.rsc.org/images/entities/char_2009.gif) :
:![[thin space (1/6-em)]](https://www.rsc.org/images/entities/char_2009.gif) 1) and kept under stirring for 3 h. To this add, 0.5% (w/v) chitosan solution (1% acetic acid) was added to this mixture and allowed to stir for 24 h, followed by dialysis against water to remove unreacted EDC, FA from chitosan–FA conjugates. 10 mg of conjugate was added to DOX–DS–Q–GNPs and allowed to stir for 12 h followed by centrifugation to form folic acid functionalised DOX loaded GNPs (DOX–DS–Q–GNPs–FA).
1) and kept under stirring for 3 h. To this add, 0.5% (w/v) chitosan solution (1% acetic acid) was added to this mixture and allowed to stir for 24 h, followed by dialysis against water to remove unreacted EDC, FA from chitosan–FA conjugates. 10 mg of conjugate was added to DOX–DS–Q–GNPs and allowed to stir for 12 h followed by centrifugation to form folic acid functionalised DOX loaded GNPs (DOX–DS–Q–GNPs–FA).
The percentage of modified amino groups on the chitosan was determined by 2,4,6-trinitrobenzene sulfonic acid (TNBSA) assay by detecting the remnant amino group on the chitosan molecules. The percentage of modified amino group on the chitosan was calculated by the following equation
In vitro drug release studies
DOX–DS–Q–GNPs–FA was dialyzed against 30 mL phosphate buffer pH 7.4 and acetate buffer pH 5.7 at 37 °C with continuous stirring at 100 rpm. 0.5 mL of sample was pipetted out at specific time intervals and analyzed spectrophotometrically. Sink condition was maintained by replacing equal volume of fresh buffer during every time of sample collection to maintain sink condition.Evaluation of anticancer activity in MCF-7 cells by MTT assay
The cytotoxicity of DOX–DS–Q–GNPs on MCF-7 cells was determined by the MTT assay. MCF-7 cells (1 × 10⁵ cells per well) were seeded in cell culture plates. After the cells reached the confluence, the MCF-7 cells were treated with known concentrations of DOX–DS–Q–GNPs and DOX–DS–Q–GNPs–FA and incubated at 4, 24 and 48 h at 37 °C, 5% CO2. After careful removal of the DMEM medium, MTT solution was added and the plates were incubated. After 4 h incubation, DMSO was added and formazan crystals were solubilized by gentle shaking. The absorbance at 570 nm was measured using multiplate reader. The effect of DOX–DS–Q–GNPs–FA on the proliferation of human breast cancer cells was analyzed by determining the percentage cell viability and IC50 concentration of test samples (concentration required for the inhibition of 50% cell population). Cells incubated at same conditions without the test samples were considered as control. All experiments were performed in triplicate.Apoptotic assay
The MCF-7 cells were plated in 96 well plates (1 × 10⁴ cells per well) and incubated at 37 °C in a humidified atmosphere of 5% CO2 incubator. Free DOX, DS–Q–GNPs, DOX–DS–Q–GNPs–FA were added in the wells and tested for their apoptotic activity. After incubation 10 μL of the AO/EB dye mixture (100 μg mL−1 of AO and 100 μg mL−1 of EB in phosphate buffer saline) was added to each well. The basic principle of apoptosis assay involves the usage of two fluorescent dyes acridine orange and ethidium bromide which specifically binds with live and dead cells, giving green and red fluorescence respectively. The excitation and emission maxima for acridine orange and ethidium bromide are 500/530, and 510/595 respectively. The apoptotic, necrotic and live cells were examined under the fluorescence microscope (OlympusCK40/U-RFLT50, Olympus, Japan). The experiment was performed in triplicate.Western blot analysis
1 × 10⁵ MCF-7 cells at log phase were seeded onto 6 well plates. Cells were then treated with IC50 concentration of DOX–DS–Q–GNPs–FA and incubated. After incubation cells were collected by trypsinization (cell lysis buffer containing 0.05 mol L−1 Tris–HCl (pH 7.5), 0.15 M NaCl, 0.001 mol L−1 PMSF, 0.001 M EDTA (pH 8.0), 1% Triton X-100, 0.1% SDS, 2 μg mL−1 leupeptin) and washed 3 times with PBS, and then centrifuged at 12![[thin space (1/6-em)]](https://www.rsc.org/images/entities/char_2009.gif) 000 rpm for 5 min at 4 °C. The extracted protein samples (10 μg total protein per lane) were added in 5 times the volume of sample buffer and subjected to denaturation at 100 °C for 10 min, then electrophoresed on SDS-PAGE (8% for Bcl-2, 15%, caspases-3, and -9, β-actin) at 200 V for 45 min, and finally transferred on to PVDF membrane. The PVDF membrane was treated with PBS containing 5% skimmed milk at room temperature for 1 h and then incubated with the primary antibodies anti Bcl-2 (dilution 1
000 rpm for 5 min at 4 °C. The extracted protein samples (10 μg total protein per lane) were added in 5 times the volume of sample buffer and subjected to denaturation at 100 °C for 10 min, then electrophoresed on SDS-PAGE (8% for Bcl-2, 15%, caspases-3, and -9, β-actin) at 200 V for 45 min, and finally transferred on to PVDF membrane. The PVDF membrane was treated with PBS containing 5% skimmed milk at room temperature for 1 h and then incubated with the primary antibodies anti Bcl-2 (dilution 1![[thin space (1/6-em)]](https://www.rsc.org/images/entities/char_2009.gif) :
:![[thin space (1/6-em)]](https://www.rsc.org/images/entities/char_2009.gif) 2000), mouse monoclonal primary antibodies against anti-human caspase 3 (1
2000), mouse monoclonal primary antibodies against anti-human caspase 3 (1![[thin space (1/6-em)]](https://www.rsc.org/images/entities/char_2009.gif) :
:![[thin space (1/6-em)]](https://www.rsc.org/images/entities/char_2009.gif) 2000), anti-human caspase (1
2000), anti-human caspase (1![[thin space (1/6-em)]](https://www.rsc.org/images/entities/char_2009.gif) :
:![[thin space (1/6-em)]](https://www.rsc.org/images/entities/char_2009.gif) 2000), anti-human Bax (1
2000), anti-human Bax (1![[thin space (1/6-em)]](https://www.rsc.org/images/entities/char_2009.gif) :
:![[thin space (1/6-em)]](https://www.rsc.org/images/entities/char_2009.gif) 2000), anti Bcl-2 (1
2000), anti Bcl-2 (1![[thin space (1/6-em)]](https://www.rsc.org/images/entities/char_2009.gif) :
:![[thin space (1/6-em)]](https://www.rsc.org/images/entities/char_2009.gif) 1000), at 37 °C for 1 h at 4 °C overnight. After being washed 3 times with PBS for 15, 10 and 10 min respectively, the corresponding secondary antibody (dilution 1
1000), at 37 °C for 1 h at 4 °C overnight. After being washed 3 times with PBS for 15, 10 and 10 min respectively, the corresponding secondary antibody (dilution 1![[thin space (1/6-em)]](https://www.rsc.org/images/entities/char_2009.gif) :
:![[thin space (1/6-em)]](https://www.rsc.org/images/entities/char_2009.gif) 2000) was added to it and incubated at room temperature for 1 h. The membrane was then washed 3 times for 15, 10, and 10 min respectively. After reacting with horseradish peroxidase-conjugated goat anti mouse antibody, the immune complexes were visualized by using the chemiluminescence ECL PLUS detection reagents following the manufacturer's procedure.
2000) was added to it and incubated at room temperature for 1 h. The membrane was then washed 3 times for 15, 10, and 10 min respectively. After reacting with horseradish peroxidase-conjugated goat anti mouse antibody, the immune complexes were visualized by using the chemiluminescence ECL PLUS detection reagents following the manufacturer's procedure.
Flow cytometric analysis
Cell cycle analysis was performed by cellular DNA content of MCF-7 in flow cytometer. MCF-7 cells were grown to exponential phase, seeded at a density of 1 × 10⁶ cells per 6 well dish, and treated with the IC50 concentration of DOX–DS–Q–GNPs–FA. After treatment, the cells were collected by trypsinization, and fixed in ice-cold 70% ethanol at −20 °C overnight. The cells were re-suspended in PBS containing 1% Triton X-100, 0.5 mg mL−1 of RNase and 4 mg mL−1 of PI at 37 °C for 30 min in dark room. Samples were analyzed for DNA content of 10![[thin space (1/6-em)]](https://www.rsc.org/images/entities/char_2009.gif) 000 cells per analysis using FACS, Calibur flow cytometer, immediately after incubation (Becton Dickinson, San Jose, CA). The cell cycle was determined and analyzed using cell quest software.
000 cells per analysis using FACS, Calibur flow cytometer, immediately after incubation (Becton Dickinson, San Jose, CA). The cell cycle was determined and analyzed using cell quest software.
3. Results and discussion
UV-visible spectroscopic analysis
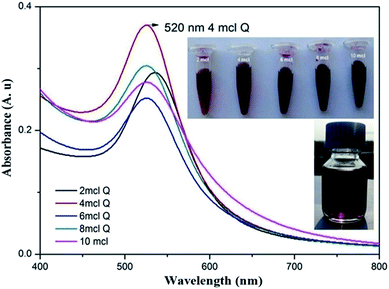
UV-visible spectroscopy is the primary characterization technique to confirm the formation of GNPs. The addition of different volumes of Q solution (2, 4, 6, 8 and 10 μL) to a mixture of 200 μL of HAuCl4 and 200 μL of DS solution resulted in instantaneous formation of red wine colour within 2 min. Observed red colour was characteristic of the surface plasmon resonance (SPR) of gold nanoparticles. It is interesting to note that DS–Q–GNPs were formed spontaneously with the simple addition of Q solution to HAuCl4 solution. The reduction reaction does not required application of any external energy like heating, sunlight irradiation, sonication or microwave treatment.Fig. 1 shows the absorption spectra of GNPs synthesized using Q solution. It was generally considered that the intensity and width of SPR band was influenced by the factors such as number of particles, particle shape, dielectric constant of the medium and temperature.
Moreover the SPR band also gives preliminary information regarding the dispersity of metal nanoparticles. A broad band is indication of the formation of varied size and shape of GNPs. From the UV-visible spectra it is understood that the SPR peaks was observed in the range of 520 to 530 nm. The absorption spectra of reaction solution reduced with 4 μL of Q solution showed a characteristic absorption band of gold at 520 nm.23 Moreover SPR band of the GNPs solution reduced with 4 μL of Q exhibited higher intensity suggesting that 4 μL of Q has produced the maximum reduction of Au3+ ions and lead to the formation of large number of GNPs, respectively. But when the quantity of Q is increased above 4 μL, the intensity of the SPR band becomes low indicating that of 4 μL of Q is sufficient to reduce the given HAuCl4 solution used for the reaction.24 As the volume of Q was increased the SPR band became narrow and was shifted slightly towards the shorter wavelength region (blue shift) indicating the decrease in particle size.12,14 Overall from the close observation of visible spectra, it was confirmed that volume of Q plays an important role in the synthesis of GNPs and 4 μL was the ideal volume of Q for 200 μL 1 mM solution and it produced GNPs rapidly without any aggregation.
FE-SEM with EDS
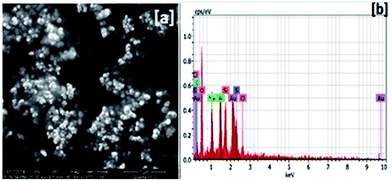
The morphology and size of the DS–Q–GNPs were studied by the FE-SEM analysis. DS–Q–GNPs particles were found to be nearly spherical in shape (Fig. 2(a)). The size of the DS–Q–GNPs was analysed by Image tool 3.0 software and mean size of DS–Q–GNPs was found to be 29 ± 3 nm. The EDS spectrum was illustrated as Fig. 2(b). The EDS spectrum showed gold signal confirming the presence of elemental gold in the DS–Q–GNPs sample. However, other signals corresponding to elements like carbon and sulphur GNPs were observed in the spectrum which may be due to the DS polymer that present over the surface of the DS–Q–GNPs.25TEM analysis
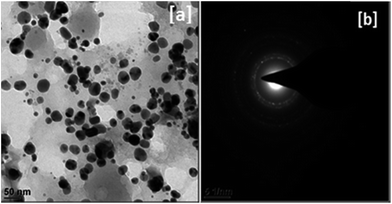
Fig. 3(a) shows typical TEM micrographs of DS–Q–GNPs. The TEM image revealed that the DS–Q–GNPs were nearly spherical in shape. Few quasi spherical shaped particles were also observed. The average size of be GNPs was found to be 29 ± 4 nm. Bright circular rings were seen in the selected area electron diffraction (SAED) pattern (Fig. 3(b)) which corresponds to the (111), (200), (220) and (311) reflections of the face-centered-cubic (fcc) structure of gold revealing that the synthesized GNPs were crystalline in nature.26Particle size analysis
The particle size and zeta potential were measured using zeta sizer and the size distribution and zeta potential were shown in Fig. 4(a)–(c) respectively. The obtained mean values represent the hydrodynamic diameter of a sphere (i.e. diameter of particle with hydration shell) having the same volume as the particle. The mean particle size of DS–Q–GNPs measured by PCS was found to be 38 ± 4 nm. Particle size measured by PCS was slightly larger than particle size given by TEM analysis (29 nm). The difference in the size measurement may be due to the fact that during the TEM analysis the size of the dried GNPs core was measured while in the PCS the hydrodynamic diameter of the DS capped GNPs was measured in the presence of liquid medium. The hydrophilic dextran sulphate capping the GNPs probably expanded in the liquid medium and resulted in the slight increase of particle size of DS–Q–GNPs during PCS measurement. Similar observations were previously reported by number of researchers who had employed pullulan,27 chitosan,28 heparin29 and soya phytochemicals30 as reducing and capping agents for the synthesis of GNPs.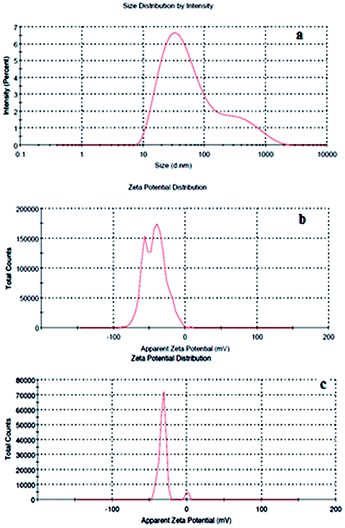 | ||
| Fig. 4 (a) Particle size distribution of DS–Q–GNPs and (b) zeta potential of DS–Q–GNPs (c) zeta potential of DOX loaded GNPS. | ||
Zeta potential values reveal information regarding the surface charge of the nanoparticles and the magnitude can be used to predict the long-term stability of the nanoparticulate dispersion.31 The negative zeta potential of −42.5 mV for DS–Q–GNPs can be attributed to the anionic nature of DS which cap the GNPs surface and the zeta potential above −30 mV indicates that synthesized DS–Q–GNPs are highly stable.32,33
XRD analysis
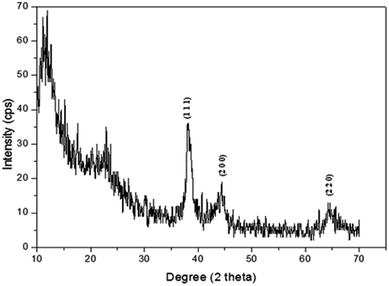
The typical XRD spectrum of DS–Q–GNPs was given as Fig. 5. The Bragg's reflection peaks at 2θ = 37°, 43° and 65° were predominant and can be indexed as (111), (200), (220) reflections of fcc structures of metallic gold. The obtained XRD results were comparable to the standard data (JCPDS file no. 04-0784) confirming crystalline nature of the synthesized GNPs.Determination of modified amino group and FT-IR spectroscopy
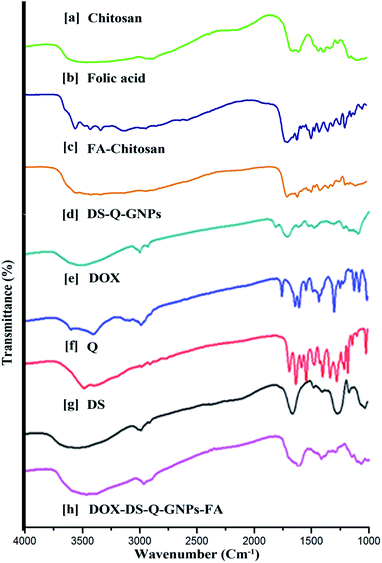
The percentage of the modified amino group of the chitosan molecules exhibited about 54%.34 The modified percentage of amino group were found to be medium and further they used for the preparation of DOX–DS–Q–GNPs–FA.The characteristic stretching vibration of C![[double bond, length as m-dash]](https://www.rsc.org/images/entities/char_e001.gif) O in quercetin was observed at 1663 cm−1. Benzopyran group of quercetin responded at 1093 cm−1 and the characteristics aromatic C
O in quercetin was observed at 1663 cm−1. Benzopyran group of quercetin responded at 1093 cm−1 and the characteristics aromatic C![[double bond, length as m-dash]](https://www.rsc.org/images/entities/char_e001.gif) C stretching in quercetin molecule was found at 1614 and 1431 cm−1. Characteristic peak at 1240 cm−1 due to phenolic C–O–H stretching was also found in the spectrum solely responsible for the GNPs synthesis (Fig. 6(f)). In DS–Q–GNPs the characteristic peaks of quercetin was found with small shift indicating that Q was capped over the surface of the GNPs, which increases the stability of the nanoparticles (Fig. 6(d)). A broad strong characteristic peak at 3316 cm−1 corresponds to N–H and C–H stretching for the pure doxorubicin was found in final formulation (Fig. 6(e)).
C stretching in quercetin molecule was found at 1614 and 1431 cm−1. Characteristic peak at 1240 cm−1 due to phenolic C–O–H stretching was also found in the spectrum solely responsible for the GNPs synthesis (Fig. 6(f)). In DS–Q–GNPs the characteristic peaks of quercetin was found with small shift indicating that Q was capped over the surface of the GNPs, which increases the stability of the nanoparticles (Fig. 6(d)). A broad strong characteristic peak at 3316 cm−1 corresponds to N–H and C–H stretching for the pure doxorubicin was found in final formulation (Fig. 6(e)).
The FTIR spectrum of chitosan (Fig. 6(a)) exhibited all the characteristic peaks of chitosan possessing the OH stretching and CH stretching at 3418 cm−1 and 2862 cm−1 respectively. The characteristic absorption band at 1614 cm−1 corresponds to the NH bending. Similarly the FTIR spectrum of folic acid (Fig. 6(b)) showed characteristic peaks at 1693, 1605 and 1487 cm−1 which are corresponding to the C![[double bond, length as m-dash]](https://www.rsc.org/images/entities/char_e001.gif) O, amino group in the pteridine ring and C
O, amino group in the pteridine ring and C![[double bond, length as m-dash]](https://www.rsc.org/images/entities/char_e001.gif) O or C
O or C![[double bond, length as m-dash]](https://www.rsc.org/images/entities/char_e001.gif) N bonds present in folic acid. FTIR spectrum of the FA–chitosan (Fig. 6(c)) observed to have the corresponding amino acid and pteridine ring peak at 1697 cm−1 and 1610 cm−1 respectively. Furthermore the conjugate between the folic acid and chitosan contain the –CONH– group. The two characteristic absorption band, carbonyl absorption band (C
N bonds present in folic acid. FTIR spectrum of the FA–chitosan (Fig. 6(c)) observed to have the corresponding amino acid and pteridine ring peak at 1697 cm−1 and 1610 cm−1 respectively. Furthermore the conjugate between the folic acid and chitosan contain the –CONH– group. The two characteristic absorption band, carbonyl absorption band (C![[double bond, length as m-dash]](https://www.rsc.org/images/entities/char_e001.gif) O) and N–H vibration band altogether corresponds to the amide I and amide II shift, which attribute coupling of FA with chitosan.34 The DS stabilized GNPs (Fig. 6(d)) have the characteristic peaks at 1598 cm−1 for chitosan and 1259 cm−1 for DS. The FTIR spectrum of the complex evidenced that the band at 1598 cm−1 shifted to 1529 cm−1, while the characteristic band for DS remained unchanged, which clearly indicates the presence of both polymers in the composition of the final formulation. In (Fig. 6(h)) DOX–DS–Q–GNPs–FA, the presence of characteristic peaks at 1452, 1510 and 1606 cm−1 corresponds to the folic acid and the presence of DOX attribute to the characteristic absorption band at 3522 cm−1 which represent the OH stretching at 2928 cm−1.35,36 Moreover, the presence of small shift in the DS–Q–GNPs and DOX–DS–Q–GNPs–FA confirms the presence of both doxorubicin and folic acid on the synthesized DS–Q–GNPs for further investigation and against MCF-7 cancer cells.
O) and N–H vibration band altogether corresponds to the amide I and amide II shift, which attribute coupling of FA with chitosan.34 The DS stabilized GNPs (Fig. 6(d)) have the characteristic peaks at 1598 cm−1 for chitosan and 1259 cm−1 for DS. The FTIR spectrum of the complex evidenced that the band at 1598 cm−1 shifted to 1529 cm−1, while the characteristic band for DS remained unchanged, which clearly indicates the presence of both polymers in the composition of the final formulation. In (Fig. 6(h)) DOX–DS–Q–GNPs–FA, the presence of characteristic peaks at 1452, 1510 and 1606 cm−1 corresponds to the folic acid and the presence of DOX attribute to the characteristic absorption band at 3522 cm−1 which represent the OH stretching at 2928 cm−1.35,36 Moreover, the presence of small shift in the DS–Q–GNPs and DOX–DS–Q–GNPs–FA confirms the presence of both doxorubicin and folic acid on the synthesized DS–Q–GNPs for further investigation and against MCF-7 cancer cells.
In vitro stability studies of DS–Q–GNPs
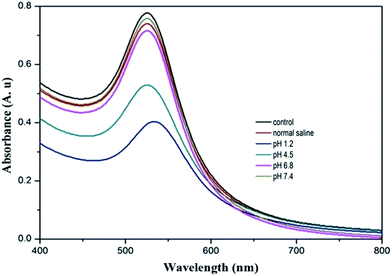
For the successful use of any biosynthesized GNPs in field of biomedicine they should be stable in different biological media which mimic the in vivo conditions. Therefore, testing the stability of the GNPs in different buffers can be considered as an initial screening test for compatibility with physiological conditions.37 The intensity and shift in the SPR band was monitored to understand the stability of DS–Q–GNPs and the respective UV-visible spectrum was shown in Fig. 7. A slight shift (∼1–5 nm) in SPR band was found in case of buffers pH 4.5, 6.8 and 7.4 but a shift of about ∼15 nm in SPR band was observed in case of buffer (pH 1.2). Similarly minimal changes (<10%) were observed in the SPR peak intensity of DS–Q–GNPs incubated buffers of pH 4.5, 6.8 and 7.4 and normal saline except at pH 1.2, where 25% reduction in the peak intensity was observed. Over all in vitro stability studies revealed that DS–Q–GNPs were suitable for parenteral applications.Effect of storage temperature on stability
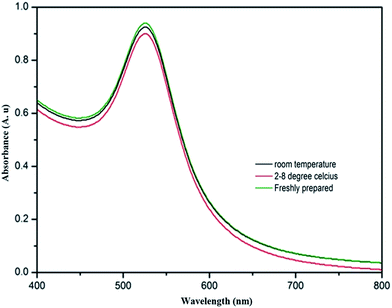
As shown in Fig. 8 only negligible changes were observed in the SPR band at 520 nm of the DS–Q–GNPs which were incubated at different temperature conditions indicating that DS–Q–GNPs were extremely stable at different storage conditions.Hemocompatibility
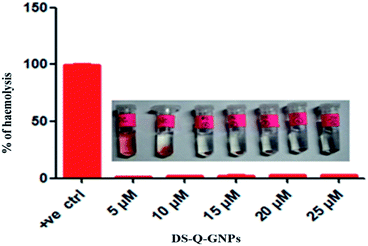
When RBC cells come in to contact with foreign materials, swelling will occur and lead to breakage of cell membranes and release of the internal components including haemoglobin. Thus, hemolysis of the blood cells is an important parameter to be analyzed for the materials which is supposed to be used in vivo. Less than 5% haemolysis was permissible for any biomaterial.38 The effect of DS–Q–GNPs on RBCs is evaluated by analyzing the amount of hemoglobin released during the assay. From the results it was apparent that DS–Q–GNPs were highly haemocompatible as they caused about only 2% haemolysis (Fig. 9). It has been reported that sulphated polysaccharides were promising materials usually employed to improve the blood compatibility of biomaterials.39 Hence lack of significant hemolysis for DS–Q–GNPs can be attributed to the presence of dextran sulphate as the capping agent which completely covers the surface of the GNPs and made DS–Q–GNPs as hemocompatible.Biocompatibility assay using NIH 3T3 fibroblasts
The cytotoxicity of DS–Q–GNPs under in vitro conditions was evaluated by using NIH 3T3 fibroblast cells in terms of percentage cell viability and result was shown in Fig. 10. After treatment with DS–Q–GNPs for a period of about 48 h, the treated cells showed excellent cell viability of about more than 90% (Fig. 10). It has been previously reported that dextran sulphate was biocompatible with fibroblast cells.40 Our MTT assay results assured the same and it clearly revealed that the dextran sulphate (capping agent) provided a non-toxic coating on DS–Q–GNPs and made them highly biocompatible. Similar results were obtained for GNPs synthesized using biocompatible polymer, bovine serum albumin.41 As fibroblasts showed >90% cell viability it can be confirmed that DS–Q–GNPs were biocompatible and 75 μM found to be the optimized concentration for further in vivo therapeutic applications.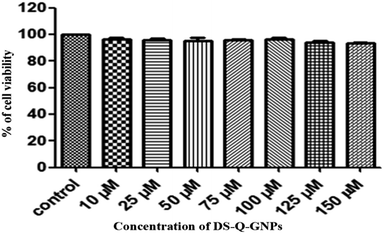 | ||
| Fig. 10 In vitro biocompatibility using NIH 3T3 fibroblast cell line. Each bar represent (mean ± SD; n = 3). | ||
In vivo toxicity study using zebra fish embryos
Zebra fish was effective in vivo model for the study of toxicity of the nanomaterials as it possesses high degree of homology to the human genome.42 Zebra fish embryos were employed to assess the toxic effect of DS–Q–GNPs. Primarily in vivo toxicity effect was studied in terms of hatching rate and percentage survival rate and results were shown in Fig. 11(a) and (b) respectively. It was found that DS–Q–GNPs treated group's hatching rate was normal and comparable to control group but in case of survival rate a slight deviation from control groups was observed when treated with DS–Q–GNPs (>1600 ng mL−1).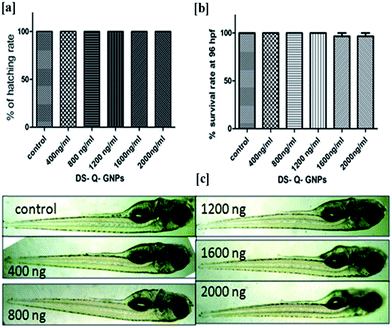 | ||
| Fig. 11 (a) Hatching rate (%) of zebra fish embryos (b) survival rate (%) of zebra fish embryos (c) morphology of zebra fish embryos (mean ± SD; n = 3). | ||
Moreover the morphology of hatched larvae's was observed under optical microscope for changes like pericardial edema, pigmentation, yolk sac edema, bent trunk and tail malformations. No differences were observed in the percentage hatching rate and percentage survival rate between the normal and control group.
The morphology of hatched larvae's was observed under Leica DM1000 microscope and representative images of the different groups were shown in Fig. 11(c). After DS–Q–GNPs treatment none of the embryos showed differences in their total length from control. Similarly there was no significant morphological changes such as bent trunk, heart oedema, head or tail deformities or yolk sac oedema were observed in the treated group of zebra fish embryos. Overall the results imply that DS–Q–GNPs were safe in vivo and suitable for various diagnostic and therapeutic applications.
Drug loading
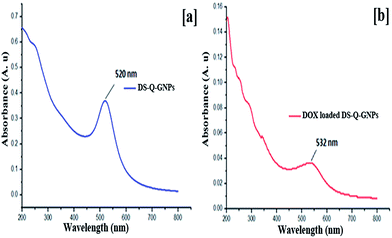
In general loading the drugs over GNPs using non-covalent methods are considered as simple and effective approach as the therapeutic activities of the drug molecules would be retained without changing in the drug's chemical structures.43 Based on the UV-visible absorbance studies percentage of doxorubicin loading in the GNPs was calculated and found to be 90.39 ± 2.32% (Fig. S1†). High drug loading attributed to the electrostatic interactions between the drug and the GNPs. Dhar et al. 2011 has also achieved high doxorubicin loading on the GNPs having anionic gellan gum as stabilising agent.44 Doxorubicin binding on to DS–Q–GNPs was further confirmed from the red shift happened in the SPR band towards higher wavelength from 520 to 532 nm were shown in Fig. 12(a) and (b).45–47Doxorubicin loaded GNPs were subjected to zeta potential measurements. The zeta potential of DOX–DS–Q–GNPs was found to be −31.1 mV. The zeta potential of DS–Q–GNPs was −42.5 mV. Thus, the observed reduction in zeta potential of DOX loaded was ascribed to the presence of positively charged DOX on the surface of GNPs.48,49
Drug release studies
The in vitro release profile of DOX from DS–Q–GNPs–FA was evaluated at pH 5.7 and pH 7.4 as they mimic the physiological characteristics of the cancer cells and normal cells respectively.50Fig. 13 depicts the release of DOX from DOX–DS–Q–GNPs–FA in buffers (pH 5.7 and pH 7.4). DOX release from DOX–DS–Q–GNPs–FA was found to be much lower than free DOX. It was found that >80% of the free DOX was released quickly within 4 h but release of DOX from DOX–DS–Q–GNPs–FA was found to be following typical sustained drug release pattern.
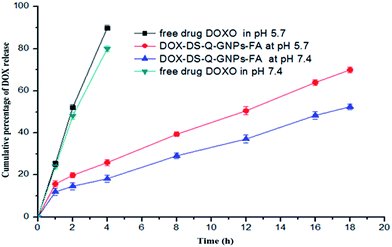 | ||
| Fig. 13 In vitro release profiles of DOX from the DOX–DS–Q–GNPs and free DOX at different pH (pH 7 and 7.4 at 37 °C) (mean ± SD; n = 3). | ||
Comparing the release curves at pH 5.7 and 7.4, it can be understood that there was minimal difference between the drug release at pH 5.7 and that at pH 7.4 in the first 2 h, but at the end of 18 h maximum cumulative DOX release (70%) at pH 5.7 was much higher than that (50%) at pH 7.4. The release studies confirm the pH dependent release of DOX from the DOX–DS–Q–GNPs–FA. Over all it was understood that the release of DOX was higher in acidic pH as compared to basic pH. Thus faster release of DOX from DOX–DS–Q–GNPs–FA at acidic pH is advantageous as the same can be expected to occur at in vivo conditions where the DOX release from GNPs would be facilitated by the acidic environment of tumor tissues.51 Ultimately it would result in better cytotoxic efficacy against cancer cells. Moreover relatively low amount of DOX release from GNPs at pH 7.4 will also ensure the reduced toxicity of DOX to the normal tissues since the physiological pH of body is maintained at pH 7.4.52
Evaluation of anti cancer activity
The cytotoxicity of free DOX, DOX–DS–Q–GNPs, DOX–DS–Q–GNPs–FA against MCF-7 cells was evaluated by MTT assay and results were shown in Fig. 14. It was observed that free DOX and DOX–DS–Q–GNPs and DOX–DS–Q–GNPs–FA showed a dose dependent cytotoxicity against MCF-7 cells. The inhibitory concentration (IC50) of DOX–DS–Q–GNPs, DOX–DS–Q–GNPs–FA was found to be 820 and 518 nM respectively, but for free DOX it was around 1140 nM on the MCF-7 cells. From the IC50 values it is clear that the DOX–DS–Q–GNPs and DOX–DS–Q–GNPs–FA showed significant cytotoxic effect than free doxorubicin hydrochloride after 48 h incubation in MCF-7 cell lines. Moreover the cytotoxic effect after 4 h and 24 h was evaluated against MCF-7 cells (Fig. S2 and S3†). The DOX–DS–Q–GNPs and DOX–DS–Q–GNPs–FA exhibited about 82 and 80% during the 4 h. However the activity started increasing at the end of 24 h upto 35 and 30% cytotoxicity. The effect of cytotoxicity against MCF-7 stared and was statically significant when compared with the cytotoxicity at 48 h. The enhanced cytotoxic activity of doxorubicin gold nanoparticulate complex could be due to difference in uptake profile between free drug and doxorubicin gold nanoparticulate complex in to the MCF-7 breast cancer cells. Normally any free drug molecules enter in to the cancer cell through passive diffusion mechanism but if the drug was delivered to the cancer cells using suitable nanocarriers (GNPs) drug can enter in to the cancer cells by endocytosis mechanism which will result in higher cellular uptake of the entrapped drug molecules.53,54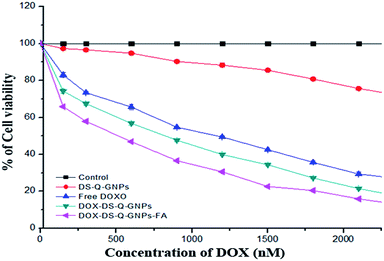 | ||
| Fig. 14 In vitro cytotoxicity studies of on MCF-7 cancer cell lines. All assays were performed in triplicate and the mean ± SD; n = 3. | ||
Moreover MTT results clearly establish that folic acid functionalization on the GNPs surface leads to enhanced cytotoxicity towards the MCF-7 cells. Folic acid functionalization leads to the better cellular internalisation of the DOX–DS–Q–GNPs–FA through specific folate receptor-mediated endocytosis mechanism which in turn resulted in superior cytotoxic activity of DOX–DS–Q–GNPs–FA over MCF-7 cells. It has been reported earlier that folic acid functionalization will lead to enhanced cytotoxic activity of the drug loaded nanoparticles in the cancer cells due to folic acid targeting mechanism.55–57
Apoptosis assay
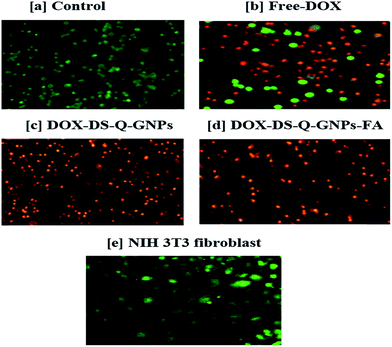
Acridine orange (AO) and ethidium bromide (EB) stains were used to examine whether the cell death was due to apoptosis process after DOX–DS–Q–GNPs–FA treatment. AO will stain both live and dead cells and it will fluoresce green in living cells and fluoresce red in dead cells but EB stains cells that lost membrane integrity and it fluoresce in red colour.58 Viable cells will intact DNA and nucleus and display a round and green nuclei. Late apoptotic cells will have fragmented DNA and show red fluorescence. Control cells (Fig. 15(a)) were found to be fluoresced green confirming their normal state. But MCF-7 cells were treated with DOX–DS–Q–GNPs (Fig. 15(c)) and DOX–DS–Q–GNPs–FA (Fig. 15(d)) showed the indication of apoptosis such as shape alteration, shrunken cytoplasm, contracted nucleus contraction and chromatin condensation. Increased number of later apoptotic cells (red coloured cells) was observed in the case of MCF-7 cell population treated with DOX–DS–Q–GNPs–FA. On the whole it was confirmed that DOX–DS–Q–GNPs–FA caused high degree of apoptosis than the free DOX (Fig. 15(b)). To find out the cell specific delivery of DOX–DS–Q–GNPs–FA the apoptosis study was carried out in two different cell lines (MCF-7 and NIH 3T3 fibroblasts cells). MCF-7 cells are positive for folate receptors (FR positive) and NIH 3T3 cells lack folate receptors (FR negative). According to Cuong et al., 2012 has adopted various endocytosis pathways with folate micelles for delivering DOX in to cells via FR-mediated endocytosis and caveolae/lipid-raft mediated endocytosis. However, the DOX loaded folic acid coupled GNPs act as nanocarrier through FR-mediated endocytosis pathway to inhibit MCF-7 cells.59 Fig. 15(e) show that DOX–DS–Q–GNPs–FA did not produce any significant cell death confirming the cell specific delivery characteristic of the folate functionalized GNPs.Cell cycle analysis
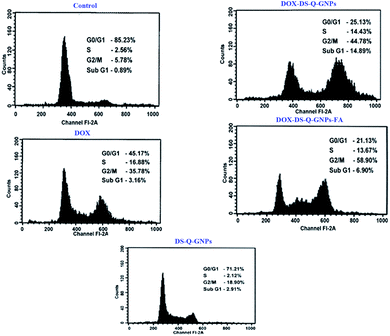
The effect of DOX–DS–Q–GNPs–FA treatment over the cell cycle was studied by flow cytometry. Fig. 16 shows the cell cycle analysis of control, free drug DOX, DS–Q–GNPs, DOX–DS–Q–GNPs and DOX–DS–Q–GNPs–FA. Flow cytometric studies reveal that the DOX–DS–Q–GNPs–FA induce cell cycle arrest significantly at the G2/M phase in MCF-7 cells.Western blot analysis
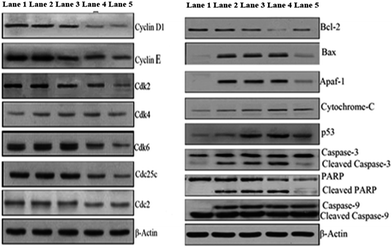
The western blot results showed that substantial alterations occurred in concentration of apoptotic proteins in the MCF-7 cells. Cyclin D1 and cyclin E plays a critical role in the regulation of cell proliferation.60Free DOX led to a strong reduction of cyclin D1 protein levels in tumors. The results as seen in Fig. 17, showed that DOX–DS–Q–GNPs–FA were able to inhibit the function of cyclin D1, cyclin E. Expression of different cyclin dependent kinases such as cdk-4, cdk-6, β-actin was used as a loading control and it showed similar expression in all lanes.
Intrinsic pathways of western blot studies are shown in Fig. 17. Bax protein is a pro-apoptotic member and Bcl-2 is an anti-apoptotic member in the Bcl-2 protein family. Formation of heterodimers among these pro-apoptotic and anti-apoptotic proteins will switch on and switch off the caspase-mediated cell death.42 In the present investigation DOX–DS–Q–GNPs–FA induced down-regulation of and cdk-2 was evaluated and it was found that reduced expression of the same indicating that occurrence of apoptosis in the MCF-7 cells. Bcl-2 proteins and up-regulation of Bax proteins in MCF-7 cells. Caspases are cysteine acid proteases, playing major role in apoptosis mechanism.61 Fig. 17 shows that DOX–DS–Q–GNPs–FA treated cells induced cleavage of caspase 9, and caspase 3. Cleaved form of PARP facilitates cellular disassembly and it serves as an apoptotic marker.62 Fig. 17 also showed that PARP proteins cleaved into a fragment after treatment with DOX–DS–Q–GNPs–FA. Over all our studies confirmed that DOX–DS–Q–GNPs–FA induced apoptosis in MCF-7 cells effectively.
4. Conclusion
In the current study, green synthesis GNPs using quercetin as a reduced agent at room temperature with the presence of dextran sulphate as the stabilising agent. The FE-SEM and TEM confirm the morphology with spherical, well-dispersed GNPs with a narrow size distribution. The DS–Q–GNPs exhibited better stability and highly biocompatible to NIH 3T3 fibroblasts cell line. Similarly, in vivo zebra fish toxicity studies revealed that DS–Q–GNPs were safe. DOX-loaded DS–Q–GNPs decorated with FA reveals to have high drug loading efficiency due to the electrostatic interaction between the anionic DS capped over GNPs and cationic drug DOX. In vitro controlled drug release of DOX was higher at pH 5.7 than pH 7.4 which is highly advantageous to improve the therapeutic activity of drugs in cancer cells but also leads to the reduction in the toxic effect of cancer drugs on normal cells. The FACS analysis of the DOX–DS–Q–GNPs–FA induced the cell cycle arrest significantly at G2/M phase and increased in apoptotic protein levels in the MCF-7 cells during western blotting. Overall the following studies suggest that doxorubicin-loaded gold nanoparticles conjugated with folic acid represent a new potential delivery system for targeted breast cancer therapy.Acknowledgements
The author Raja M. D. thanks Council of Scientific and Industrial Research (CSIR), New Delhi, India, for providing the funds to carry out this study.References
- B. Lu, S. B. Xiong, H. Yang, X. D. Yin and R. B. Zhao, Int. J. Pharm., 2006, 307, 168–174 CrossRef CAS PubMed.
- N. Abu, M. N. Akhtar, W. Y. Ho, S. K. Yeap and N. B. Alitheen, Molecules, 2013, 18, 10367–10377 CrossRef CAS PubMed.
- S. Kondath, B. Srinivas Raghavan, R. Anantanarayanan and R. Rajaram, Chem.–Biol. Interact., 2014, 224, 78–88 CrossRef CAS PubMed.
- J. ElHazzat and M. E. El-sayed, Curr. Breast Cancer Rep., 2010, 2, 146–151 CrossRef CAS.
- Y. Q. Du, X. X. Yang, W. L. Li, J. Wang and C. Z. Huang, A cancer-targeted drug delivery system developed with gold nanoparticle mediated DNA–doxorubicin conjugates, RSC Adv., 2014, 4, 34830–34835 RSC.
- A.-M. Osman, H. M. Bayoumi, S. E. Al-Harthi, Z. A. Damanhouri and M. F. ElShal, Cancer Cell Int., 2012, 12, 47 CrossRef CAS PubMed.
- S. Vijayaraghavalu, J. K. Dermawan, V. Cheriyath and V. Labhasetwar, Mol. Pharm., 2013, 10, 337–352 CrossRef CAS PubMed.
- J. Gautiera, E. Munniera, A. Paillard, K. Hervea, L. Douziech-Eyrollesa, M. Soucé, P. Dubois and I. Chourpa, Int. J. Pharm., 2012, 423, 16–25 CrossRef PubMed.
- A. Madhusudhan, G. B. Reddy, M. Venkatesham, G. Veerabhadram, D. A. Kumar, S. Natarajan, M. Y. Yang, A. Hu and S. S. Singh, Int. J. Mol. Sci., 2014, 15, 8216–8234 CrossRef CAS PubMed.
- S. Mukherjee, V. Sushma, S. Patra, A. K. Barui, M. P. Bhadra, B. Sreedhar and C. R. Patra, Nanotechnology, 2012, 23, 455103 CrossRef PubMed.
- S. Iravani, Green Chem., 2011, 13, 2638–2650 RSC.
- I. Rajendran, H. Dhandapani, R. Anantanarayanan and R. Rajaram, RSC Adv., 2015, 5, 51055–51066 RSC.
- Q. Guo, Q. Guo, J. Yuan and J. Zeng, Colloids Surf., A, 2014, 441, 127–132 CrossRef CAS.
- S. A. Aromal and D. Philip, Phys. E, 2012, 44, 1692–1696 CrossRef.
- L. A. Levchenko, S. A. Golovanova, N. V. Lariontseva, A. P. Sadkov, D. N. Voilov, Y. M. Shulga and A. F. Shestakov, Russ. Chem. Bull., 2011, 60, 426–433 CrossRef CAS.
- A. K. Mittal, S. Kumar and U. C. Banerjee, J. Colloid Interface Sci., 2014, 1, 194–199 CrossRef PubMed.
- D. K. Das, A. Chakraborty, S. Bhattacharjee and S. Dey, J. Exp. Nanosci., 2013, 8, 649–655 CrossRef CAS.
- A. Hameed, N. U. Islam, M. R. Shah and S. Kanwal, Chem. Commun., 2011, 47, 11987–11989 RSC.
- A. Z. Mirza and H. Shamshad, Arabian J. Chem., 2014, 08, 009 Search PubMed.
- E. S. Krystofiak, V. Z. Matson, D. A. Steeber and A. Julie, J. Nanomater., 2012, 431012 Search PubMed.
- H. Yang, Y. Li, T. Li, M. Xu, Y. Chen, C. Wu, X. Dang and Y. Liu, Sci. Rep., 2014, 4, 7072 CrossRef PubMed.
- U. Gunduz, T. Keskin, G. Tansık, P. Mutlu, S. Yalcın, G. Unsoy, A. Yakar, R. Khodadust and G. Gunduz, Biomed. Pharmacother., 2014, 68, 729–736 CrossRef CAS PubMed.
- S. T. Hussain, M. Iqbal and M. Mazhar, J. Nanopart. Res., 2009, 11, 1383–1391 CrossRef.
- S. R. Bhuvanasree, D. Harini and A. Rajaram, Spectrochim. Acta, Part A, 2013, 106, 190–196 CrossRef CAS PubMed.
- K. Tokarek, J. L. Hueso, P. Kuśtrowski, G. Stochel and A. Kyzioł, Eur. J. Inorg. Chem., 2013, 2301, 4940–4947 Search PubMed.
- C. C. Wu and D. H. Chen, Gold Bull., 2010, 43, 234–240 CrossRef CAS.
- M. Ganeshkumar, T. Ponrasu, M. D. Raja, M. K. Subamekala and L. Suguna, Spectrochim. Acta, Part A, 2014, 130, 64–71 CrossRef CAS PubMed.
- A. Komalam, L. G. Muraleegharan, S. Subburaj, S. Suseela, A. Babu and S. George, Int. Nano Lett., 2012, 2, 1–9 CrossRef.
- I. C. Sun, D. K. Eun, J. H. Na, S. Lee, I. J. Kim, I. C. Youn and C. H. Ahn, Chem.–Eur. J., 2009, 15, 13341–13347 CrossRef CAS PubMed.
- R. Shukla, S. K. Nune, N. Chanda, K. Katti, S. Mekapothula, R. R. Kulkarni and K. V. Katti, Small, 2008, 4, 1425–1436 CrossRef CAS PubMed.
- K. Kattia, N. Chandaa, R. Shuklaa, A. Zambrea, T. Suibramaniana, R. R. Kulkarnia, R. Kannana and K. V. Kattia, Int. J. Green Nanotechnol., 2009, 1, B39–B52 CrossRef PubMed.
- G. Sonavane, K. Tomoda and K. Makino, Colloids Surf., B, 2008, 66, 274–280 CrossRef CAS PubMed.
- G. Zhang, J. Li, A. Shen and J. Hu, Phys. Chem. Chem. Phys., 2015, 17, 21261 RSC.
- S.-J. Yang, F.-H. Lin, K.-C. Tsai, M.-F. Wei, H.-M. Tsai, J.-M. Wong and M.-J. Shieh, Bioconjugate Chem., 2010, 21, 679–689 CrossRef CAS PubMed.
- V. E. Bosio, V. Machain, A. G. Lopez, I. O. P. De Berti, S. G. Marchetti, M. Mechetti and G. R. Castro, Appl. Biochem. Biotechnol., 2012, 167, 1365–1376 CrossRef CAS PubMed.
- R. Chouhan and A. K. Bajpai, J. Nanobiotechnol., 2009, 7, 5 CrossRef PubMed.
- K. P. Kumar, W. Paul and C. P. Sharma, Process Biochem., 2011, 46, 2007–2013 CrossRef CAS.
- H. Jiang, X. B. Wang, C. Y. Li, J. S. Li, F. J. Xu, C. Mao and J. Shen, Langmuir, 2011, 27, 11575–11581 CrossRef CAS PubMed.
- H. Fasl, J. Stana, D. Stropnik, S. Strnad, K. Stana-Kleinschek and V. Ribitsch, Biomacromolecules, 2010, 11, 377–381 CrossRef CAS PubMed.
- A. Kros, M. Gerritsen, V. S. Sprakel, N. A. Sommerdijk, J. A. Jansen and R. J. Nolte, Sens. Actuators, B, 2001, 81, 68–75 CrossRef CAS.
- P. Murawala, S. M. Phadnis, R. R. Bhonde and B. L. V. Prasad, Colloids Surf., B, 2009, 73, 224–228 CrossRef CAS PubMed.
- S. S. D. Kumar, M. Surianarayanan, R. Vijayaraghavan, A. B. Mandal and D. R. MacFarlane, Eur. J. Pharm. Sci., 2014, 51, 34–44 CrossRef CAS PubMed.
- J. J. Liang, Y. Y. Zhou, J. Wu and Y. Ding, Curr. Drug Metab., 2014, 15, 620–631 CrossRef CAS PubMed.
- S. Dhar, E. M. Reddy, A. Prabhune, V. Pokharkar, A. Shiras and B. L. V. Prasad, Nanoscale, 2011, 3, 575–580 RSC.
- S. Kayal and R. V. Ramanujan, J. Nanosci. Nanotechnol., 2010, 10, 5527–5539 CrossRef CAS PubMed.
- A. Chaudhary, C. Dwivedi, A. Gupta and C. K. Nandi, RSC Adv., 2015, 5, 97330 RSC.
- A. Z. Mirza and H. Shamshad, Eur. J. Med. Chem., 2011, 46, 1857–1860 CrossRef CAS PubMed.
- V. Venkatpurwar, A. Shiras and V. Pokharkar, Int. J. Pharm., 2011, 409, 314–320 CrossRef CAS PubMed.
- R. K. Mohanty, S. Thennarasu and A. B. Mandal, Colloids Surf., B, 2014, 114, 138–143 CrossRef CAS PubMed.
- F. M. Kievit, F. Y. Wang, C. Fang, H. Mok, K. Wang, J. R. Silber, R. G. Ellenbogen and M. Zhang, J. Controlled Release, 2011, 152, 76–83 CrossRef CAS PubMed.
- A. Shalviri, G. Raval, P. Prasad, C. Chan, Q. Liu, H. Heerklotz, A. M. Rauth and X. Y. Wu, Eur. J. Pharm. Biopharm., 2012, 82, 587–597 CrossRef CAS PubMed.
- A. Santosh, J. J. Grailer, S. Pilla, A. S. Douglas and S. Gong, J. Mater. Chem., 2009, 19, 7879–7884 RSC.
- H. S. Yoo, K. H. Lee, J. Oh and T. G. Park, J. Controlled Release, 2000, 683, 419–431 CrossRef.
- S. Dhar, E. M. Reddy, A. Shiras, V. Pokharkar and B. E. E. Prasad, Chem.–Eur. J., 2008, 14, 10244–10250 CrossRef CAS PubMed.
- H. N. Nguyen, T. M. N. Hoang, T. T. T. Mai, T. Q. T. Nguyen, H. D. Do, T. H. Pham and P. T. Ha, Adv. Nat. Sci.: Nanosci. Nanotechnol., 2015, 6, 025005 CrossRef.
- S. K. Sahu, S. Maiti, T. K. Maiti, S. K. Ghosh and P. Pramanik, Macromol. Biosci., 2011, 11, 285–295 CrossRef CAS PubMed.
- S. K. Sahu, S. Maiti, T. K. Maiti, S. K. Ghosh and P. Pramanik, J. Drug Targeting, 2011, 19, 104–113 CrossRef CAS PubMed.
- K. Ho, L. S. Yazan, N. Ismail and M. Ismail, Cancer Epidemiol., 2009, 33, 155–160 CrossRef CAS PubMed.
- N.-V. Cuong, Y.-L. Lia and M.-F. Hsieh, J. Mater. Chem., 2012, 22, 1006 RSC.
- H. Matsushime, D. E. Quelle, S. A. Shurtleff, M. Shibuya, C. J. Sherr and J. Y. Kato, Mol. Cell. Biol., 1994, 14, 2066–2076 CrossRef CAS PubMed.
- T. J. Fan, L. H. Han, R. S. Cong and J. Liang, Acta Biochim. Biophys. Sin., 2005, 37, 719–727 CrossRef CAS PubMed.
- S. S. Dhule, P. Penfornis, T. Frazier, R. Walker, J. Feldman, G. Tan, J. He, A. Alb, V. John and R. Pochampally, J. Nanomed. Nanotechnol., 2012, 8, 440–451 CrossRef CAS PubMed.
Footnote |
| † Electronic supplementary information (ESI) available: Figure. See DOI: 10.1039/c6ra01756h |
| This journal is © The Royal Society of Chemistry 2016 |


