Co-supported catalysts on nitrogen and sulfur co-doped vertically-aligned carbon nanotubes for oxygen reduction reaction

Yunmei Liua, Bin Zhao*b, Ying Zhangb, Huijuan Zhanga, Ke Zhanb, Junhe Yangb and Jianqiang Li*b
aSchool of Energy and Power Engineering, University of Shanghai for Science and Technology, Shanghai 200093, China
bSchool of Materials Science and Engineering, University of Shanghai for Science and Technology, Shanghai 200093, China. E-mail: zhaobin@usst.edu.cn; jqli@home.ipe.ac.cn

Received 10th January 2016 , Accepted 23rd March 2016

First published on 24th March 2016


Abstract

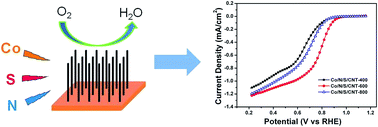
Co supported on nitrogen and sulfur co-doped vertically-aligned carbon nanotubes (Co/NS-CNT) has been fabricated as an efficient electrocatalyst for oxygen reduction reaction (ORR) by a two-step process involving sputtering of cobalt and subsequent annealing in a nitrogen and sulfur-containing atmosphere. The surface morphology, crystal structure and chemical composition of the samples have been investigated. Both cyclic voltammetry (CV) and rotating-disk electrode (RDE) measurements reveal that the annealing temperature has a significant impact on the ORR activity of the catalyst in both alkaline and acid electrolytes. And the best ORR performance is achieved for the catalyst annealed at 600 °C (Co/NS-CNT-600) in 0.1 M KOH solution, which exhibits an onset potential of 0.962 V and an ORR peak potential of 0.803 V. Rotating ring-disk electrode (RRDE) testing in KOH shows an electron transfer number of around 3.7, indicating a four-electron pathway-dominated ORR process. The Co/NS-CNT-600 catalyst also exhibits the best ORR catalytic activity in 0.5 M H2SO4 medium. The excellent ORR activity of the Co/NS-CNT catalyst is attributed to the synergistic effects from N and S co-doping and the increased active sites from metallic cobalt or CoS2.
1. Introduction

Fuel cells have attracted a great deal of attention as a promising power source for future mobile and stationary applications, due to their high energy conversion efficiency, high power density, and low emission.1,2 Although many breakthroughs with respect to component performance and durability have been demonstrated, there are still open challenges to face before fuel cells become a commercially viable technology.3,4 High cost and sluggish oxygen reduction reaction (ORR) on the cathode are crucial factors limiting the commercialization of fuel cells. Up to now, Pt-based materials have been widely used as electrocatalysts in fuel cells. Nevertheless, they still suffer from several drawbacks, including limited natural reserves, poor stability and low tolerance to methanol poisoning.5

To address these issues, tremendous efforts have been devoted to reducing or replacing Pt-based catalysts by employing non-precious metal catalysts and heteroatom-doped carbonaceous materials.5–7 Nitrogen-coordinated cobalt supported on carbon nanostructures (M/N/C) has been proved to be a promising electrocatalyst due to the low cost, reasonable activity and remarkable selectivity towards ORR.8,9 Traditional approach for preparing Co-based catalysts involves pyrolysis of different cobalt and nitrogen-containing precursors absorbed on carbon.10–12 Although these catalysts have shown promise towards fuel cell reactions, their activity are still quite low compared with commercial Pt/C catalyst. Therefore, further investigation is necessary to improve ORR performance of the non-precious metal catalysts.

Vertically-aligned carbon nanotubes (VACNTs) have been explored as ideal support materials for high-performance metal catalysts8,13 and metal-free N-doped catalysts,14,15 since they have excellent electrical conductivity, high specific surface area and superb thermal stability. Recently, it has been demonstrated that doping CNTs with nitrogen and other elements can further improve the ORR catalytic activity than the corresponding single-atom doped counterpart due to a synergistic effect.16–18

Since magnetron sputtering allows nano-scale metal films to be deposited with more precise control of metal content and film thickness, it has been employed to be an effective method to fabricate fuel cell electrode. Kim et al. sputtered Fe onto CNTs grown on carbon paper to prepare the Fe/N/CNT electrocatalysts, which showed promising ORR catalytic activity.19 Our group fabricated Co/N/VACNT catalysts by reactive sputtering and achieved a good catalytic performance towards ORR after annealing at 400 °C.8 In spite of these advances, research on fabrication of non-precious metal/CNT catalysts by sputtering is still insufficient.

Herein, a two-step synthesis method for Co-based catalysts supported on N and S co-doped VACNTs (Co/NS-CNT) was proposed. Firstly, metallic cobalt was sputtered onto VACNTs in an Ar/N2 atmosphere. Then, the samples were treated at various temperatures in the sulfur-containing atmosphere for S-doping. The electrochemical catalytic performance of the Co/NS-CNT catalysts towards ORR was investigated to clarify the possible catalytic mechanisms.

2. Experimental

2.1 Synthesis of VACNTs

Vertically-aligned CNTs were grown by water-assisted chemical vapor deposition (CVD) under atmospheric pressure at 815 °C. Si (100) substrate coated with Al2O3 (∼30 nm)/Fe (1.0 nm) bilayer films was used as catalyst. High-purity ethylene (99.99%) was used as carbon source and high-purity Ar (99.999%) with H2 (99.999%) was employed as carrier gas at a total flow of 650 sccm. A small and controlled amount of water vapor was supplied by passing a portion of the Ar carrier gas through a water bubbler. Typical CVD growth was carried out with ethylene (30–50 sccm) and a water concentration of 100–200 ppm for 40 s. CNT forests with a uniform height of ∼12 μm and nanotubes of 6–8 nm in diameter were synthesized and utilized as-grown.

2.2 Preparation of Co/NS-CNT

Co was firstly sputtered onto the as-grown CNT forests in a home-made vacuum chamber at a power of 50 W using a RF power supply (CESAR 136). During sputtering, pure N2 (99.999%) was introduced together with Ar (99.999%) at a ratio of 3 to 1 for nitrogen doping. The work pressure was kept at 1.0 Pa. Co amount was adjusted by controlling the sputtering time. The loading amount of Co on VACNTs was 9.5, 17.6, and 38.3 μg cm−2, which corresponds to sputtering for 3 min, 5 min, and 10 min, respectively. Hereinafter, if without special illustration, the catalyst refers to the sample made by 5 min sputtering.

After sputtering, the samples were annealed at various temperatures in a sulfur-containing atmosphere for sulfur doping. Specifically, 2.5 g ammonium thiocyanate (NH4SCN) in a quartz boat was placed in the first zone of a dual-stage furnace equipped with a horizontal quartz tube; and the samples were located in the second zone. The precursors evaporated at ∼170 °C in the first zone and were carried into the second zone by a gas of 100 sccm Ar. They were then pyrolyzed in the second zone at temperatures ranging between 400 and 800 °C for 1 h. The samples are denoted based on the annealing temperature as Co/NS-CNT-400, Co/NS-CNT-600 and Co/NS-CNT-800, respectively. Finally, the furnace was cooled to room temperature in an Ar atmosphere. To better understand the role of sulfur in the Co/NS-CNT catalysts, Co/N-CNT was also prepared by annealing without sulfur precursor for comparison.

2.3 Characterization

Surface morphology of pristine VACNTs and Co/NS-CNT catalysts were examined by field-emission scanning electron microscope (FE-SEM, FEI, Quanta FEG 450) operated at 20–30 kV and transmission electron microscope (TEM). X-ray diffraction (XRD) measurements were performed on a Germany Bruker D8-Advance X-ray diffractometer using a Cu Kα radiation (λ = 0.154 nm). The operating current and voltage were 40 mA and 40 kV, respectively. X-ray photoelectron spectroscopy (XPS, PHI, 5000CESCA) was carried out to evaluate chemical state and composition of different Co/NS-CNT catalysts using a Mg Kα source (1253.6 eV).

Electrochemical measurements were carried out in a conventional three-electrode cell filled with 0.1 M KOH or 0.5 M H2SO4 solution at room temperature using a CHI 750D electrochemical workstation. Cyclic voltammograms (CV), rotating disk electrode (RDE) and rotating ring-disk electrode (RRDE) techniques were utilized to characterized electrochemical activity of the catalysts. A Pt wire and a saturated calomel electrode (SCE) were used as the counter electrode and reference electrode, respectively. The catalyst-coated glassy carbon (GC) on the RDE (diameter: 5 mm) or RRDE (GC disk diameter: 5.61 mm) was utilized as the working electrode. To make catalyst ink, the as-prepared catalysts were scraped off the Si substrates. Then a given mass of the Co/NS-CNT catalyst powder, 10 μL of 5 wt% Nafion (Alfa) and 190 μL of ethanol were mixed in an ultrasonic bath. Subsequently, 10 μL of this catalyst ink was deposited on the GC disk and dried in air for 20 min.

CVs were recorded in N2-saturated or O2-saturated 0.1 M KOH (or 0.5 M H2SO4) solution by scanning the disk potential from 0.2 V to −0.8 V (or from −0.2 V to 0.8 V) at a scan rate of 5 mV s−1 after steady cycle (at least 10 cycles). And the current–potential polarization curves of RDE study were obtained at an electrode rotating speed of 900 rpm. For RRDE measurements in KOH solution, a Pt ring-GC disk electrode was employed, and the catalyst ink was dropped onto the disk only. The ring potential was kept at 0.5 V and the disk potential was scanned at a rate of 5 mV s−1.

All potentials reported in this paper are corrected to the reversible hydrogen electrode (RHE). The calibration of SCE reference electrode was performed in a standard three-electrode system with polished Pt wires as the counter electrodes, and the RDE or RRDE as the working electrode. Electrolytes (0.1 M KOH or 0.5 M H2SO4) were pre-purged and saturated with high purity N2. CVs was then run at a scan rate of 5 mV s−1, and the average of the two potentials at which the current crossed zero was taken to be the thermodynamic potential for the hydrogen electrode reactions.8

3. Results and discussion

3.1 Morphology and structure of catalysts

Fig. 1a shows SEM image of a pristine VACNT sample grown by water-assisted CVD, which presents a typical morphology of CNT forests with a spaghetti-like surface. From the side-view SEM image (Fig. 1b), the nanotubes are found to be vertically aligned and densely packed with average height of 12 μm. After sputtering, the nitrogen-containing Co particles (Co/N) were uniformly deposited on the surface of VACNTs, as shown in Fig. 2a.
image file: c6ra00752j-f1.tif
Fig. 1 (a) Top-view SEM image of a pristine CNT forest, (b) low magnification side-view SEM image of the CNT forest.

image file: c6ra00752j-f2.tif
Fig. 2 SEM images of the catalysts synthesized at different temperatures: (a) as-sputtered, (b) Co/NS-CNT-400, (c) Co/NS-CNT-600, (d) Co/NS-CNT-800; (e) and (f) show TEM images of Co/NS-CNT-600.

Then, the Co/N supported on VACNTs was annealed in a nitrogen and sulfur-containing atmosphere to achieve a good ORR performance. Fig. 2b–d presents typical SEM images of the samples annealed at different temperatures. The annealing temperature shows obvious influence on the surface morphology. After annealing at 400 °C, the Co/N deposited on CNT surface exhibits some agglomeration (Fig. 2b). With further increasing the temperature, the agglomeration becomes more pronounced and more blocky-shaped particles are observed on the forest surface, as shown in Fig. 2c and d. TEM observation on the Co/NS-CNT-600 sample reveals some small particles distributed along the CNT length below the surface (Fig. 2e), which suggests that the cobalt not only agglomerates on the forest surface, but also disperses as small particles on CNTs, which might be more favorable for good ORR performance. High resolution TEM image of a typical nanoparticle is shown in Fig. 2f. The lattice space measurement of 0.219 nm is in close agreement with the theoretical {211} spacing of CoS2 (0.226 nm), indicating the possible presence of CoS2 nanoparticles.

XRD was used to analyze phase structure of the catalysts, with diffraction patterns provided in Fig. 3. For the as-sputtered sample, only one crystalline phase exists and the diffraction peaks at 44.3°, 47.7° and 61.8° are attributed to Co(002), Co(101) and Co(102) with hexagonal cubic packing (HCP) crystalline structure, respectively. After annealing in the sulfur-containing atmosphere, some new peaks are observed in the patterns, indicating formation of a new crystalline phase. The diffraction peaks at 32.3°, 36.2°, 39.9° and 54.9° can be well assigned to CoS2 (200), CoS2 (210), CoS2 (211), and CoS2 (311).20 More close observation reveals a significant decrease in the peak intensity of Co(102) after annealing, suggesting the decline of preferred orientation in Co. Furthermore, the peak intensities of CoS2 decrease as the annealing temperature increases, indicating possible decomposition of the cobalt disulfide.


image file: c6ra00752j-f3.tif
Fig. 3 XRD spectra of the catalysts synthesized at different temperatures: (a) as-sputtered, (b) Co/NS-CNT-400, (c) Co/NS-CNT-600, (d) Co/NS-CNT-800.

3.2 Surface characterization of catalysts

To obtain information about surface atomic composition of the catalysts, XPS analysis was performed. Fig. 4 shows XPS survey spectra of the as-sputtered sample and the catalysts annealed at various temperatures. Three main peaks observed at 285.6, 533 and 780 eV correspond to C 1s, O 1s and Co 2p, respectively. The characteristic peak at 400 eV is attributed to N 1s. For the as-sputtered sample, presence of the N 1s peak in the spectra indicates successful doping of nitrogen by sputtering. After annealing, two small peaks appear at 164 and 229.2 eV, respectively, which are ascribed to presence of sulfur. Table 1 summarizes the surface element composition for the catalysts fabricated in various conditions. Quantitative analysis shows a surface composition of 30.7 at% C, 27.0 at% Co, 4.9 at% N and 37.4 at% O. After annealing, the cobalt and oxygen contents decrease significantly, and the nitrogen content shows a slight increase. As the annealing temperature rise to 600 °C, the nitrogen content further increases from 5.8 to 10.2 at%. This phenomenon of increase in nitrogen content upon heat treatment is different from that reported in the Co/N/CNT catalyst,8 possibly due to presence of ammonia gas in the annealing atmosphere, which decomposed from the NH4SCN.21 Meanwhile, the sulfur content increases greatly from zero to over 30 at% when the temperature rises from room temperature (as-sputtered) to 600 °C. These facts confirm the successfully doping of nitrogen and sulfur to the catalysts upon annealing. With further increasing the temperature to 800 °C, the nitrogen content drops, consistent with observation made for thermally pyrolyzed N-containing carbon materials,22,23 while the sulfur concentration decreases significantly, which might be attributed to the instability of CoS2 at high temperature.24 EDS measurement also confirms the incorporation of nitrogen and sulfur into the Co/NS-CNT catalyst by annealing (Table 2 and Fig S1). Not surprisingly, the sulfur content decreases significantly from over 5.5 at% to 2.33 at% as the temperature increases to 800 °C, which agrees with the XPS result. Therefore, the blocky-shaped particles formed on top surface of VACNTs after 800 °C annealing should originate from metallic Co rather than CoS2.
image file: c6ra00752j-f4.tif
Fig. 4 XPS survey spectra of the catalysts synthesized at different temperatures.
Table 1 Surface element contents from XPS analysis for various catalysts
Samples C (at%) Co (at%) N (at%) S (at%) O (at%)
As-sputtered 30.7 27.0 4.9 0 37.4
Co/NS-CNT-400 58.7 11.4 5.8 15.1 9.0
Co/NS-CNT-600 43.3 11.5 10.2 30.9 4.1
Co/NS-CNT-800 72.2 2.3 9.0 5.2 16.1


Table 2 Element contents from EDS results for the catalyst synthesized in different conditions
Catalyst C (at%) Co (at%) N (at%) S (at%) O (at%)
As-sputtered 96.30 0.56 2.17 0 0.97
Co/NS-CNT-400 88.62 1.26 2.93 6.40 0.79
Co/NS-CNT-600 89.08 1.02 3.67 5.72 0.51
Co/NS-CNT-800 94.29 0.55 2.43 2.33 0.40


To further understand chemical state of nitrogen in different catalysts, high-resolution XPS analysis was carried out. Fig. 5 presents high-resolution N 1s spectra of the as-sputtered sample and the Co/NS-CNT catalysts annealed at various temperatures. Deconvolution of N 1s peak of the as-sputtered sample shows four peaks, which is assigned to pyridinic-N (N1, 398.3 eV), Co–Nx (N2, 399 eV), graphitic-N (N3, 400.3 eV) and oxidized-N (N4, 403 eV), respectively.8,25–27 Pyridinic-N refers to N atoms at the edges of graphene planes, where each N atom is bonded to two carbon atoms and donates one p-electron to the aromatic π system.28 While graphitic-N, which is also termed as “quaternary-N”, represents the N atoms bonded to three carbon atoms within a graphite (basal) plane.29 After annealing, relative content of various N 1s components changes obviously. Specifically, Co–Nx decreases gradually, while oxidized-N increases with the increase of the annealing temperature. Meanwhile, graphitic-N increases as the temperature rises and reaches the maximum (30.2 at%) at the temperature of 600 °C. With further increasing the temperature to 800 °C, graphitic-N decreases again. Table 3 lists the detailed content of various N 1s components for samples prepared in different conditions.


image file: c6ra00752j-f5.tif
Fig. 5 High resolution XPS spectra in N 1s region of the various catalyst: (a) as-sputtered, (b) Co/NS-CNT-400, (c) Co/NS-CNT-600, (d) Co/NS-CNT-800.
Table 3 Relative contents (at%) of various components in N 1s and S 2p XPS spectra for the catalyst treated in different conditions
Catalyst N 1s S 2p
N1 N2 N3 N4 S1 S2 S3 S4 S5 S6
As-sputtered 35.7 39.7 15.8 8.8 0 0 0 0 0 0
Co/NS-CNT-400 40.0 30.5 20.0 9.5 0 49.2 30.7 12.4 7.7 0
Co/NS-CNT-600 27.2 26.1 30.2 16.4 9.4 33.4 9.5 18.4 6.6 22.7
Co/NS-CNT-800 25.8 21.1 26.2 26.9 24.0 42.7 11.2 9.1 5.3 7.7


Fig. 6 shows high-resolution XPS spectra of S 2p for the Co/NS-CNT samples annealed at various temperatures. The spectra for the catalyst annealed at 400 °C consist of four components. The doublet with peaks located at 162.4 (S2) and 163.6 eV (S3) is attributed to the CoS2 phase.20 And the second pair with peaks at 164.3 (S4) and 165.4 eV (S5) is assigned to thiophenic sulfur, which is bonded directly to the carbon atoms in a heterocyclic configuration.30 As the annealing temperature ascends to over 600 °C, two more peaks can be deconvolved from the spectra, which are assigned to the CoS phase (S1) and –C–SOx–C– species (S6).5,30 Relative content of various S 2p components are also presented in Table 3. Quantitative analysis reveals that the content of thiophenic sulfur (sum of S4 and S5) first increases with increasing the temperature and reach the maximum of 25.0 at% at 600 °C. After annealing at 800 °C, the thiophenic sulfur drops to 14.4 at%. As for the sulfur in CoS2 (sum of S2 and S3), the absolute amount is found to be almost identical in the catalysts annealed at 400 and 600 °C by considering the changes in total sulfur amount and the relative content, indicating stability of the CoS2 phase up to 600 °C. After 800 °C annealing, the amount of sulfur in CoS2 decreased significantly although the relative content increases than that at 600 °C.


image file: c6ra00752j-f6.tif
Fig. 6 High resolution XPS spectra in S 2p region of the various catalyst: (a) Co/NS-CNT-400, (b) Co/NS-CNT-600, (c) Co/NS-CNT-800.

3.3 Oxygen reduction activity

3.3.1 Electrochemical activity of Co/NS-CNT catalysts towards the ORR. Catalytic activities of the catalysts are investigated by CV measurement. To elucidate the activity of the catalyst due to the presence of oxygen, a background scan is performed under N2-saturated environment before the voltammogram is recorded in O2-saturated 0.1 M KOH electrolyte. The potential scan rate was fixed at 5 mV s−1. Compared with the featureless CVs obtained in N2-saturated solution, the CVs tested in O2-saturated solution show well defined cathodic ORR peaks, indicating obvious catalytic activity of the catalyst in alkaline solution (shown in Fig. S2). Fig. 7a shows typical CVs of various catalysts in 0.1 M KOH electrolyte after the background correction. The ORR peak potential is 0.665, 0.803, and 0.734 V for the catalysts annealed at 400, 600 and 800 °C, respectively, suggesting that the 600 °C treated catalyst exhibits the best catalytic performance.
image file: c6ra00752j-f7.tif
Fig. 7 (a) Typical CVs after the background correction of Co/NS-CNT catalysts annealed at different temperatures in O2-saturated 0.1 M KOH solution; (b) polarization curves of the disk electrode for the various Co/NS-CNT catalysts measured in O2-saturated 0.1 M KOH solution; (c) RRDE voltammograms and the corresponding amperometric responses for oxygen reduction in O2-saturated 0.1 M KOH at rotation rate of 900 rpm for the Co/NS-CNT-600 catalyst; (d) percentage of peroxide and the electron transfer number (n) of the Co/NS-CNT-600 catalyst based on the corresponding RRDE data in (c).

RDE voltammetry was carried out to further investigate the influence of annealing temperature on catalytic activity of the catalysts. The measurement was carried out using a potential scan rate of 5 mV s−1 and an electrode rotation rate of 900 rpm. Fig. 7b displays polarization curves of the Co/NS-CNT catalysts annealed at various temperatures in 0.1 M KOH solution. None of diffusion-limited current plateau is observed over the whole potential range. As the annealing temperature increases, the onset potential shifts positively from 0.923 V (400 °C) to 0.962 V (600 °C), then shifts negatively to 0.911 V (800 °C). And the half-wave potential shows a similar dependence on the temperature. Therefore, the Co/NS-CNT catalyst annealed at 600 °C demonstrates the best catalytic activity towards ORR in terms of the onset potential and half-wave potential. It is worth noting that the onset potential of the 600 °C treated Co/NS-CNT catalyst is comparable to those of the Pt/C catalyst (1.05 V vs. RHE, 0.1 M KOH)31 and CoS2/N,S-GO (0.97 V vs. RHE, 0.1 M KOH),32 and more positive than those of Co3O4/rmGO (0.88 V vs. RHE, 0.1 M KOH),33 N and S co-doped graphene/carbon black (0.96 V vs. RHE, 0.1 M KOH),5 Co/N/CNT (0.933 V vs. RHE, 0.1 M KOH),8 Co/N/HCOs (0.92 V vs. RHE, 0.1 M KOH),25 and Fe–N–S/rGO (0.95 V vs. RHE, 0.1 M KOH),26 which highlights the excellent ORR catalytic activity of our catalyst.

To verify the ORR catalytic pathway of the Co/NS-CNT catalyst, RRDE measurements were performed to investigate the yield of peroxide species (HO2) and the transferred electron number (n) during the ORR process. Fig. 7c presents ring current and disk current as a function of disk potential for ORR of the Co/NS-CNT-600 catalyst in 0.1 M KOH. The number of electrons transferred per oxygen molecule (n) and the percentage of peroxide produced (% HO2) in alkaline solution can be determined by the following equation:

 
image file: c6ra00752j-t1.tif(1)
 
image file: c6ra00752j-t2.tif(2)
where Id is the disk current, Ir is the ring current, and N is the geometric factor of the RRDE known as current collection efficiency of the Pt ring, which was determined to be 0.37.

Fig. 7d illustrates the number of electrons transferred per oxygen molecule (n) and the corresponding peroxide percentage (% HO2) calculated from the experimental data shown in Fig. 7c. The calculated n value ranges between 3.65 and 3.72 in the potential range of 0.3–0.7 V, and the corresponding % HO2 is less than 18% for the disk potential studied, indicating a four-electron pathway dominated ORR process by reducing oxygen directly to OH ions.

Catalytic activity of the N-doped carbon catalyst is often related to the chemical state of nitrogen species. Based on the aforementioned results, ORR catalytic performance of the Co/NS-CNT catalysts was affected significantly by the annealing temperature. The best catalytic activity was achieved on the 600 °C annealed sample, which has the highest graphitic-N content (30.2 at%), indicating close correlation between the graphitic-N and the ORR activity. Therefore, it is believed that the graphitic-N is the possible active site for ORR on the Co/N/S-CNT catalyst. Similar results have also been reported previously. Geng et al. proposed that the graphitic-N played the most important role for ORR activity in the N-doped graphene.34 Lai et al. concluded that the electrocatalytic activity of the N-doped graphene-based catalysts was highly dependent on the graphitic-N content.35 Furthermore, it is also found that thiophenic sulfur reaches the maximum content (25 at%) in the catalyst having the best ORR performance, indicating that thiophenic sulfur is also the possible active site for ORR on the Co/NS-CNT catalyst, as reported in the literatures.26,36

To further understand impact of N and S doping on ORR activity of the Co/N/S/CNT catalysts, a comparison experiment was carried out by CV and RDE voltammetry for as-sputtered Co/N/CNT, Co/N/CNT catalyst annealed in Ar atmosphere at 600 °C (Co/N/CNT-600), nitrogen and sulfur co-doped CNTs synthesized by annealing CNTs in NH4SCN-containing atmosphere at 600 °C (NS-CNT-600), and the Co/NS-CNT-600 catalyst. Fig. 8a and b present the CV and polarization curves in O2-saturated 0.1 M KOH solution. The as-sputtered sample shows an ORR peak potential at 0.564 V and an onset potential at 0.816 V. After annealing in Ar atmosphere at 600 °C, both the ORR peak potential and the onset potential for Co/N/CNT-600 shifts positively, suggesting that the ORR catalytic activity is enhanced during the heat treatment. Interestingly, the ORR activity is further improved significantly by annealing at the same temperature in Ar atmosphere containing NH4SCN. Accordingly, sulfur doping and nitrogen doping occurred during the annealing process in NH4SCN-containing atmosphere contributes to the enhanced catalytic activity towards ORR. Based on these finding and the above-mentioned XPS analysis, the excellent ORR activity of the Co/N/S/CNT-600 catalyst might originate from the two types of active sites (graphitic-N and thiophenic sulfur), and from the synergistic effect of N and S that arises from introducing larger asymmetrical spin and charge density.37 Besides, compared to the Co/NS-CNT-600 catalyst, metal-free nitrogen and sulfur co-doped CNTs shows much lower ORR catalytic activity in KOH solution, indicating that the cobalt and/or CoS2 on CNTs also contributes to the excellent ORR performance of the Co/NS-CNT-600 catalyst. Presence of metallic cobalt has been reported to facilitate the formation of more active sites on CNTs.38 And CoS2 supported on N,S-GO is recently found to exhibit high ORR activity,20,32 thus it might also play a role in the ORR process of our catalyst.


image file: c6ra00752j-f8.tif
Fig. 8 (a) Typical CVs of different catalysts in O2-saturated 0.1 M KOH solution; (b) polarization curves of oxygen reduction on the different catalysts in O2-saturated 0.1 M KOH solution; (c) polarization curves of oxygen reduction on Co/NS-CNT-600 catalyst with different Co loading in O2-saturated 0.1 M KOH; (d) the durability testing curves of Co/NS-CNT-600 and NS-CNT-600 catalysts at 0.68 V (vs. RHE) for 20[thin space (1/6-em)]000 s with a rotation rate of 1600 rpm in O2-saturated 0.1 M KOH.

Cobalt loading amount on VACNTs was also investigated to optimize ORR catalytic performance of the Co/NS-CNT catalyst. Fig. 8c demonstrates RDE polarization curves for the Co/NS-CNT catalysts with different Co loading after 600 °C annealing. As Co loading amount increases from 9.5 μg cm−2 to 17.6 μg cm−2, the onset potential of the catalyst shows a positive shift from 0.870 V to 0.962 V, suggesting an improved ORR activity. With further increase in Co loading, the onset potential exhibits an inverse tendency and shifts negatively. Therefore, the Co/NS-CNT catalyst with Co loading of 17.6 μg cm−2 has the best catalytic activity for ORR in our experimental conditions. Similar dependence has also been found in our Co/N/CNT catalyst reported previously.8 Although transition metals are believed to facilitate the formation of active sites for ORR,38 excessive Co loading may not contribute to the ORR performance effectively because most of the cobalt distributes on the surface of CNT forests.

Long-term stability of catalysts for ORR is one of the major concerns in current fuel cell technology. Therefore, the stability of Co/NS-CNT-600 and NS-CNT-600 catalysts was evaluated by current–time (it) chronoamperometry at a constant potential of 0.68 V (vs. RHE) in an O2-saturated 0.1 M KOH solution with a rotating speed of 1600 rpm.5 As shown in Fig. 8d, the Co/NS-CNT-600 catalyst exhibits a slow attenuation and a high relative current of 84% that still persists after 20[thin space (1/6-em)]000 s, while the NS-CNT-600 catalyst shows a faster decrease with a current retention of 73.4% after the same time. Therefore, the Co/NS-CNT-600 catalyst also outperforms the NS-CNT-600 catalyst in terms of the long-term stability. In fact, the stability of the Co/NS-CNT-600 is comparable to that of the previously reported non-Pt ORR catalysts, including nitrogen/sulfur co-doped graphene foam39 and Co–N/HGS.40

Finally, ORR performance of the Co/NS-CNT catalysts was also examined in 0.5 M H2SO4 solution by CV and RDE voltammetry with a potential scan rate of 5 mV s−1. From CV curves shown in Fig. 9a, distinct cathodic ORR peaks are observed for all the catalysts. ORR peak potential is 0.442, 0.509 and 0.450 V, respectively, for the Co/NS-CNT catalysts annealed at 400, 600 and 800 °C, suggesting that the 600 °C treated sample has the best ORR activity in H2SO4 solution. Fig. 9b presents polarization curves of the catalysts in 0.5 M H2SO4. As the annealing temperature rises, the onset potential first shifts positive from 0.661 V (400 °C) to 0.700 V (600 °C), then shifts negatively to 0.670 V (800 °C). And the half-wave potential shows a similar dependence on the temperature. Therefore, the Co/NS-CNT-600 catalyst is confirmed to exhibit the best ORR activity in acidic medium. Although the onset potential and ORR peak potential of our best catalyst is still negative than those of commercial Pt/C catalyst, they are comparable to those of nitrogen and sulfur co-doped mesoporous carbon,41 showing a reasonable catalytic activity towards ORR in the acid medium.


image file: c6ra00752j-f9.tif
Fig. 9 (a) Typical CVs after the background correction of Co/NS-CNT catalysts annealed at different temperatures in O2-saturated 0.5 M H2SO4 solution; (b) polarization curves of the disk electrode for the various Co/NS-CNT catalysts in O2-saturated 0.5 M H2SO4 solution at a potential scan rate of 5 mV s−1 and a rotation rate of 900 rpm.

4. Conclusions

Cobalt supported on nitrogen and sulfur co-doped VACNT catalyst for ORR has been developed by sputtering of Co onto VACNTs and subsequent annealing at temperature of 400–800 °C in nitrogen and sulfur-containing atmosphere by using NH4SCN as the source of N and S. A small amount of nitrogen is incorporated into the catalyst as a result of the sputtering in Ar/N2 atmosphere. Upon annealing, nitrogen and sulfur is successfully doped and XPS analysis confirms the presence of cobalt, nitrogen and sulfur on the surface of VACNTs. Electrochemical measurement reveals that the annealing temperature has significant influence on ORR activity of the Co/NS-CNT catalyst. The catalyst annealed at 600 °C exhibits the best catalytic performance in KOH medium with an onset potential of 0.962 V, an ORR peak potential of 0.803 V and an electron transfer number of around 3.7, which is comparable to that of commercial Pt/C catalyst. ORR performance of the Co/NS-CNT catalysts in acid solution is also explored and the Co/NS-CNT-600 is found to have the best ORR activity. The excellent ORR catalytic performance of the Co/NS-CNT catalyst is attributed to the synergistic effect of N and S doping and the increased active sites from metallic cobalt or CoS2.

Acknowledgements

The authors gratefully acknowledge financially support from NSFC (51072118, 51272157), Natural Science Foundation of Shanghai (16ZR1423500), the Hujiang Foundation of China (B14006).

Notes and references

  1. Z. T. Cui, S. G. Wang, Y. H. Zhang and M. H. Cao, J. Power Sources, 2014, 259, 138–144 CrossRef CAS.
  2. S. F. Jiang, B. L. Yi, C. K. Zhang, S. Liu, H. M. Yu and Z. G. Shao, J. Power Sources, 2015, 276, 80–88 CrossRef CAS.
  3. Z. W. Chen, H. Drew, A. P. Yu, L. Zhang and J. J. Zhang, Energy Environ. Sci., 2011, 4, 3167–3192 CAS.
  4. D. Banham, S. Y. Ye, K. Pei, J. Ozaki, T. Kishimoto and Y. Imashiro, J. Power Sources, 2015, 285, 334–348 CrossRef CAS.
  5. M. Wu, J. Wang, Z. X. Wu, H. L. L. Xin and D. L. Wang, J. Mater. Chem. A, 2015, 3, 7727–7731 CAS.
  6. J. Wu, Z. R. Yang, Q. J. Sun, X. W. Li, P. Strasser and R. Z. Yang, Electrochim. Acta, 2014, 127, 53–60 CrossRef CAS.
  7. F. Jaouen, E. Proietti, M. Lefèvre, R. Chenitz, J. P. Dodelet, G. Wu, H. T. Chung, C. M. Johnston and P. Zelenay, Energy Environ. Sci., 2011, 4, 114–130 CAS.
  8. Z. J. Luo, B. Zhao, Y. M. Liu, H. J. Zhang, Z. H. Tang and J. H. Yang, Electrochim. Acta, 2015, 161, 72–79 CrossRef CAS.
  9. G. Wu and P. Zelenay, Acc. Chem. Res., 2013, 46, 1878–1889 CrossRef CAS PubMed.
  10. G. Wu, K. L. More, C. M. Johnston and P. Zelenay, Science, 2011, 332, 443–447 CrossRef CAS PubMed.
  11. H. J. Zhang, H. L. Li, X. T. Li, H. X. Qiu, X. X. Yuan, B. Zhao, Z. F. Ma and J. H. Yang, Int. J. Hydrogen Energy, 2014, 39, 267–276 CrossRef CAS.
  12. L. Osmieri, A. H. Alessandro, M. Videla and S. Specchia, J. Power Sources, 2015, 278, 296–307 CrossRef CAS.
  13. Z. Yang, X. M. Zhou, Z. P. Jin, Z. Liu, H. G. Nie, X. Chen and S. M. Huang, Adv. Mater., 2014, 26, 3156–3161 CrossRef CAS PubMed.
  14. Z. Y. Mo, S. J. Liao, Y. Y. Zheng and Z. Y. Fu, Carbon, 2012, 50, 2620–2627 CrossRef CAS.
  15. K. P. Gong, F. Du, Z. H. Xia, M. Durstoc and L. M. Dai, Science, 2009, 323, 760–764 CrossRef CAS PubMed.
  16. J. L. Zhu, S. P. Jiang, R. H. Wang, K. Y. Shi and P. K. Shen, J. Mater. Chem. A, 2014, 2, 15448–15453 CAS.
  17. Q. Q. Shi, F. Peng, S. X. Liao, H. J. Wang, H. Yu, Z. W. Liu, B. S. Zhang and D. S. Su, J. Mater. Chem. A, 2013, 1, 14853–14857 CAS.
  18. D. S. Yu, Y. H. Xue and L. M. Dai, J. Phys. Chem. Lett., 2012, 3, 2863–2870 CrossRef CAS PubMed.
  19. K. S. Lee, B. C. Lee, S. J. Lee, D. Kim, W. Kim and D. M. Kim, Int. J. Hydrogen Energy, 2012, 37, 6268–6271 CrossRef CAS.
  20. D. C. Higgins, F. M. Hassan, M. H. Seo, J. Y. Choi, M. A. Hoque, D. U. Lee and Z. Chen, J. Mater. Chem. A, 2015, 3, 6340–6350 CAS.
  21. M. Ohta, S. Hirai, H. Kato, V. V. Sokolov and V. V. Bakovets, Mater. Trans., 2009, 50, 1885–1889 CrossRef CAS.
  22. S. B. Yang, L. J. Zhi, K. Tang, X. L. Feng, J. Maier and K. Mullen, Adv. Funct. Mater., 2012, 22, 3634–3640 CrossRef CAS.
  23. R. L. Liu, D. Q. Wu, X. L. Feng and K. Mullen, Angew. Chem., Int. Ed., 2010, 49, 2565–2569 CrossRef CAS PubMed.
  24. J. B. Chung, Z. D. Ziang and J. S. Chung, Environ. Sci. Technol., 2002, 36, 3025–3029 CrossRef CAS PubMed.
  25. S. J. Chao, Z. Y. Bai, Q. Cui, H. Y. Yan, K. Wang and L. Yang, Carbon, 2015, 82, 77–86 CrossRef CAS.
  26. S. Jiang, Y. J. Sun, H. C. Dai, J. T. Hu, P. J. Ni, Y. L. Wang and Z. Li, Electrochim. Acta, 2015, 174, 826–836 CrossRef CAS.
  27. X. C. Qiao, C. H. You, T. Shu, Z. Y. Fu, R. P. Zheng and X. Y. Zeng, et al., Electrochem. Commun., 2014, 47, 49–53 CrossRef CAS.
  28. L. Lai, J. R. Potts, D. Zhan, L. Wang, C. K. Poh, C. Tang, H. Gong, Z. Shen, J. Lin and R. S. Ruoff, Environ. Sci. Technol., 2012, 5, 7936–7942 CAS.
  29. J. M. You, M. S. Ahmed, H. S. Han, J. E. Choe, Z. Ustundag and S. Jeon, J. Power Sources, 2015, 275, 73–79 CrossRef CAS.
  30. D. Higgins, M. A. Hoque, M. H. Seo, R. Wang, F. Hassan, J. Y. Choi, M. Pritzker, A. Yu, J. Zhang and Z. W. Chen, Adv. Funct. Mater., 2014, 24, 4325–4336 CrossRef CAS.
  31. Y. G. Li, W. Zhou, H. L. Wang, L. M. Xie, Y. Y. Liang, F. Wei, J. Idrobo, S. J. Pennycook and H. J. Dai, Nat. Nanotechnol., 2012, 7, 394–400 CrossRef CAS PubMed.
  32. P. Ganesan, M. Prabu, J. Sanetuntikul and S. Shanmugam, ACS Catal., 2015, 5, 3625–3637 CrossRef CAS.
  33. Y. Y. Liang, Y. G. Li, H. L. Wang, J. G. Zhou, J. Wang, T. Regier and H. J. Dai, Nat. Mater., 2011, 10, 780–786 CrossRef CAS PubMed.
  34. D. S. Geng, Y. Chen, Y. G. Chen, Y. L. Li, R. Y. Li, X. L. Sun, S. Y. Ye and S. Knights, Energy Environ. Sci., 2011, 4, 760–764 CAS.
  35. L. F. Lai, J. R. Potts, D. Zhan, L. Wang, C. K. Poh, C. H. Tang, H. Gong, Z. X. Shen, J. Y. Lin and R. S. Ruoff, Energy Environ. Sci., 2012, 5, 7936–7942 CAS.
  36. H. Wang, X. J. Bo, Y. F. Zhang and L. P. Guo, Electrochim. Acta, 2013, 108, 404–411 CrossRef CAS.
  37. J. Liang, Y. Jiao, M. Jaroniec and S. Z. Qiao, Angew. Chem., Int. Ed., 2012, 51, 11496–11500 CrossRef CAS PubMed.
  38. K. Wiesener, Electrochim. Acta, 1986, 31, 1073–1078 CrossRef CAS.
  39. Y. Z. Su, Y. Zhang, X. D. Zhuang, S. Li, D. Q. Wu, F. Zhang and X. L. Feng, Carbon, 2013, 62, 296–301 CrossRef CAS.
  40. Q. M. Yu, J. X. Xu, C. Y. Wan, C. X. Wu and L. H. Guan, J. Mater. Chem. A, 2015, 3, 16419–16423 CAS.
  41. J. J. Shi, X. J. Zhou, P. Xu, J. L. Qiao, Z. W. Chen and Y. Y. Liu, Electrochim. Acta, 2014, 145, 259–269 CrossRef CAS.

Footnote

Electronic supplementary information (ESI) available. See DOI: 10.1039/c6ra00752j

This journal is © The Royal Society of Chemistry 2016
Click here to see how this site uses Cookies. View our privacy policy here.