Solution combustion synthesis and physico-chemical properties of ultrafine CeO2 nanoparticles and their photocatalytic activity

R. Bakkiyarajab, G. Bharathc, K. Hasini Ramsaitc, Ahmed Abdel-Wahab*d, Edreese H. Alsharaehe, Shen-Ming Chen*f and M. Balakrishnan*g
aResearch and Development Centre, Bharathiar University, Coimbatore – 641 046, India
bDepartment of Physics, Government College of Engineering, Bargur-635 104, Tamil Nadu, India
cDepartment of Nanoscience and Technology, Bharathiar University, Coimbatore-641 046, Tamil Nadu, India
dChemical Engineering Program, Texas A&M University at Qatar, P. O. Box 23874, Doha, Qatar. E-mail: ahmed.abdel-wahab@qatar.tamu.edu
eDepartment of Chemistry, Alfaisal University, P. O. Box 50927, Riyadh 11533, Saudi Arabia
fDepartment of Chemical Engineering and Biotechnology, National Taipei University of Technology, Taipei 10608, Taiwan. E-mail: smchen78@ms15.hinet.net
gDepartment of Physics, Government Arts College, Tiruvannamalai – 606 603, TamilNadu, India. E-mail: mbelectronlife@gmail.com

Received 6th January 2016 , Accepted 12th May 2016

First published on 19th May 2016


Abstract

Ultrafine cerium oxide (CeO2) nanoparticles have been confirmed to be capable photocatalysts for environmental remediation because of their strong redox ability, long-term stability, nontoxicity, and cost effectiveness. CeO2 nanoparticles were successfully synthesized by a solution combustion method using cerium nitrate and urea. The physical, chemical, thermal and optical properties of the as-prepared samples were characterized using various analytical techniques. X-ray diffraction data confirm that the synthesized nanocrystalline CeO2 samples have cubic structure with an average grain size of 10, 8 and 19 nm corresponding to as-prepared, 300 and 600 °C annealed samples, respectively. The HRTEM results confirmed that the synthesized nanoparticles exhibit good polycrystalline nature with spherical ultrafine nanoparticles having size in the range of ∼9 nm. The UV/vis spectrum shows a maximum absorption at 294 nm and the band gap of CeO2 was tuned by adjusting the annealing temperature. In the PL spectra, a strong and broad emission band was observed at 425 nm due to the presence of a blue shift in the visible region. The photocatalytic activities of annealed CeO2 nanoparticles were investigated by photodegradation of methylene blue (MB) under UV light irradiation. It was found that the ultra-fine CeO2 nanoparticles exhibited better photocatalytic activity than that of already available commercial photocatalysts. Based on the investigation, these ultra-fine CeO2 nanoparticles possess adaptable potential applications for wastewater purification.

1. Introduction

Recently, various types of nanomaterials with crystal sizes less than 10 nm have been reported to exhibit electrical, optical, thermal, catalytic and mechanical properties that widely differ from those observed for their microcrystalline counterparts. In recent years, nanocrystalline cerium(IV) oxide (CeO2, also known as ceria), a rare earth oxide, has received much consideration because of its unique characteristics, such as high stability at high temperature, great UV absorption ability, and high stiffness and reactivity.1–5 Also, this material has attracted much attention in various applications such as catalysts, fuel cells, sensors, ultraviolet blockers, oxygen storage, microelectronics, optoelectronics, electrochemical devices,6–18 biological applications,19–21 and solar cells.22 Due to its wide band gap (∼3.37 eV) and large excitation binding energy (60 meV), CeO2 has been broadly applied as a photocatalyst in environmental applications.32–35 It is known that the small sized CeO2 particles exhibit large surface area and induce a high UV light absorption capacity that promotes their photocatalytic activity. Different methods for the synthesis of nano-cerium oxide powders have been reported in the literature, including gas condensation,23,24 sol–gel method,25 homogeneous precipitation,26 hydrothermal,27 and solution combustion techniques.28 Among these methods, solution combustion for the production of ultrafine nanoparticles is the most promising technique because of its low cost, quick and simple synthesis process, and it offers a large control over their properties. Using the solution combustion technique, it is possible to make uniform nanosized ceria particles in a relatively low temperature environment.

The photocatalytic activity of nanostructured semiconductor metal oxides (e.g., ZnO, TiO2, WO3, ZrO2 (ref. 29–31) and CeO2) are usually evaluated based on their performance for the photodegradation of organic dyes such as methyl blue,33 methyl violet (MV), methyl orange,32 rhodamine B (RhB), and others. In this study, we used methylene blue (MB) as a model environmental pollutant to evaluate the photocatalytic activity of the synthesized CeO2 nanoparticles.

2. Experimental

2.1 Reagents

Cerium(III) nitrate hexa hydrate (Ce(NO3)3·6H2O), urea (NH2CONH2) and methylene blue were purchased from Sigma-Aldrich. All the reagents and chemicals were used without further purification.

2.2 Preparation of CeO2 nanoparticles

In the typical process, 5 g of hydrated Ce(NO3)3·6H2O was dissolved in 230 mL of distilled water (0.1 normal solution). Then, 1.25 g of urea was dissolved in 50 mL of distilled water (0.025 normal solution) and was added drop wise to the above solution under stirring conditions. The final solution was transferred into a borosil beaker and the water was removed by slow evaporation at 150 °C for 5 hours. When dried completely, a gel is formed and the temperature was quickly increased up to 350 °C in order for an auto ignited reaction to occur, leaving a solid with a pale-yellowish color. After cooling down slowly to room temperature, fractions of the solid were annealed in air atmosphere at 300 and 600 °C separately.

2.3 Characterization

The X-ray diffraction (XRD) studies were carried out using an X′PERT-PRO diffractometer with Cu Kα radiation (λ = 1.5406 Å). Fourier transform infrared (FT-IR model: SHIMATZU – IR AFFINITY-1) spectra were recorded on spectrometer in the wave number range from 400 to 4000 cm−1. The UV-visible absorption/transmission spectra were measured using a JASCO V-500/V-600 series spectrometer. The excitation and emission spectra were recorded using spectrofluorometer (model: Horiba Jobin-Flouromax-4) equipped with a 150 W xenon lamp as the excitation source. The field emission scanning electron microscopy and energy dispersive X-ray analysis were performed using (model: FEI – QUANTA – FEG 250) operated at acceleration voltage range of 200 V to 30 kV, and attached with X-ray detector. The morphology and particle size of the annealed samples were observed on a high resolution transmission electron microscopy (Model: JEOL – JEM2100) operated at an acceleration voltage of 200 kV. Simultaneously TGA/DTA measurements were carried out in SEIKO – model: TG/DTA 6200, in the temperature range from room temperature to 1000 °C and the calibration materials Ni and Ag were used as standards.

2.4 Photocatalytic investigation

The photocatalytic activity of annealed CeO2 nanoparticles was estimated by their ability to decolourize the methylene blue (MB) under UV light irradiation (Philips TUV 25W/G25T8, wavelength ∼365 nm) at room temperature. Nearly, 10 mg of CeO2 nanoparticles was dispersed in 100 mL of ∼50 ppm MB aqueous solution and systematically mixed on a magnetic stirrer for 10 min. Then the UV light was turned on and small portion of the solution was withdrawn at fixed time intervals of 30 min. The photocatalyst nanoparticles were removed from the solution by centrifugation at 3000 rpm for 5 min. The remaining dye concentration in the supernatant solution was analysed by measuring the light absorption intensity of MB using UV-visible absorption spectroscopy at a wave length of 665 nm. Another set of experiments was conducted with different concentrations of dye (10, 20 and 30 ppm) while the catalyst concentration was maintained constant.

3. Results and discussion

Fig. 1 shows the XRD patterns of the ultrafine CeO2 nanoparticles over a 2θ of 10–80° for the as-prepared and after annealing at temperatures of 300 and 600 °C, respectively. The structure confirmation was carried out with the help of standard JCPDS data base (File#. 89-8436). The XRD pattern of the as-prepared CeO2 shows a mixture of amorphous and crystalline nature with the majority being crystalline solids. The XRD pattern of annealed CeO2 at 300 °C for 2 h identified eight major diffraction intensity peaks from the planes (1 1 1) [2θ = 28.52°, d = 3.12 Å], (2 0 0) [2θ = 33.06°, d = 2.70 Å], (2 2 0) [2θ = 47.47°, d = 1.91 Å], (3 1 1) [2θ = 56.33°, d = 1.63 Å], (2 2 2) [2θ = 59.08°, d = 1.56 Å], (4 0 0) [2θ = 69.4°, d = 1.35 Å] and (3 3 1) [2θ = 76.70°, d = 1.24 Å], which could be indexed to cubic structure (fcc) with lattice parameter a = b = c = 5.41 Å, α = β = γ = 90°. The average crystalline size of the prepared nanoparticles was estimated using the Scherrer eqn (1).
 
image file: c6ra00382f-t1.tif(1)
where D is an average particle size in nm, β is the full width at half maximum (FWHM) of X-ray reflection expressed in radians and θ is the position of the diffraction peaks in the diffractogram. The average crystalline sizes of the as-prepared, annealed at 300 and 600 °C CeO2 exhibits 10, 8 and 19 nm, respectively. Therefore, the 300 °C annealed CeO2 sample shows well crystalline nature and smaller grain size.

image file: c6ra00382f-f1.tif
Fig. 1 X-ray diffraction patterns of as-prepared, annealed at 300 and 600 °C CeO2 nanoparticles.

Fig. 2 shows the FT-IR spectra of the three types of synthesized particles. Analysis of the FTIR spectra was performed based on the information reported in the literature.4–6 The strong intense peaks around 3441 and 3757 cm−1 were attributed to OH stretching of water or Ce–OH. The bands at 2924 and 2854 cm−1 are due to the C–H bonds of the organic compounds. The small intense bands at 2376 and 1458 cm−1 may arise from the absorption of atmospheric CO2 on the metallic cations. The peak at 1627–1635 cm−1 is due to water mode of H2O bending. The broad intense peak at 500 and 879 cm−1 stretching band confirms the formation of Ce–O, indicating the formation of CeO2.


image file: c6ra00382f-f2.tif
Fig. 2 FTIR spectra of as-prepared, annealed at 300 and 600 °C CeO2 nanoparticles.

Fig. 3 shows the UV-visible absorption spectra of the CeO2 (a) as-prepared and (b) annealed at 300 °C for 2 h. The spectra reveal that a strong absorption occurs below 400 nm with predominant absorbance peak at around 294 nm for the as-prepared sample. A slight shift in the peak absorption wavelength was observed for the annealed sample which could be due to the high crystalline nature of CeO2. The band gap (Eg) can be calculated by fitting the UV-vis absorption data to the direct transition equation by extra polating of the linear portions of the curves to absorption equal to zero using the following equation

 
αhν = ED(Eg)1/2 (2)


image file: c6ra00382f-f3.tif
Fig. 3 UV-visible absorbance spectra of the nanocrystalline CeO2 sample (a) as-prepared (b) annealed at 300 °C for 2 h.

Where, is the photon energy, α is the optical absorption coefficient, Eg is the direct band gap, and ED is a constant. Fig. 4(a) and (b) shows the UV-visible reflectance spectra of as-prepared CeO2 and CeO2 annealed at 300 °C for 2 h. For the as-prepared CeO2 sample, the band gap energy was observed as Eg = 3.42 eV (particle size 10 nm) and for the CeO2 sample annealed at 300 °C for 2 h, it was observed that Eg = 3.6 eV (particle size 8 nm). These results confirm the hypothesis that, when the particle size is reduced, the band gap energy increases. This phenomenon has been well explained for diameters of the CeO2 down to less than a few nanometers by the change in the electronic band structure, due to quantum-confinement effect. Fig. 5 shows the room temperature photoluminescence (PL) spectrum of nanocrystalline CeO2 (a) as-prepared, (b) annealed at 300 °C for 2 h and (c) annealed at 600 °C for 2 h samples.


image file: c6ra00382f-f4.tif
Fig. 4 UV-visible reflectance spectra of the nanocrystalline CeO2 sample (a) annealed at 300 °C for 2 h and (b) as-prepared CeO2.

image file: c6ra00382f-f5.tif
Fig. 5 Room temperature PL spectra exited by 300 nm of the nanocrystalline CeO2 sample (a) as-prepared (b) annealed at 300 °C for 2 h and (c) annealed at 600 °C for 2 h.

The as-prepared sample shows very weak bands, indicating that the as-prepared sample exhibits partially amorphous and partially crystalline solids. This confirms the XRD pattern of as-prepared sample shown in Fig. 1. A weak blue-green emission was observed at 466 nm, which arises from the defects oxygen vacancies as well as surface defects.29 The bands observed from 400–500 nm are attributed to the different levels of Ce 4f and O 2p.30 The weak emission at 466 nm is related to the abundant defects like dislocation, which are related to fast oxygen transportation. The defect energy levels between Ce 4f and O 2p were found to be affected by the temperature and density of defects in the crystals. The annealed sample at 600 °C shows the strong and sharp emission bands at 425 nm (ref. 31) in the blue-visible region that is due to the well-defined crystalline nature of the sample.

To investigate morphology and crystallinity of the nanostructured CeO2 (annealed at 300 °C), the samples were analysed by using FESEM, HRTEM and selected area electron diffraction pattern (SAED) analysis as shown in Fig. 6(a)–(f). Fig. 6(a)–(c) shows the FESEM studies carried out to examine the sample of nanocrystalline CeO2 (annealed at 300 °C) with different magnification. It is clearly observed that the CeO2 nanoparticles has an average particle size of ∼9 nm, which is very close to the average particle size calculated from the corresponding XRD pattern using the Scherrer formula.


image file: c6ra00382f-f6.tif
Fig. 6 FESEM image of the nanocrystalline CeO2 micrograph (a–c) are annealed at 300 °C for 2 h with different magnifications, HRTEM images of 300 °C annealed CeO2 sample (d and e) and (f) EDS spectrum of the CeO2 nanoparticles.

Fig. 6(d) and (e) shows the high resolution transmission electron microscopy (HRTEM) images of the CeO2 sample and clearly exhibit the nanosphere like morphology with well crystalline nature. Fig. 6(f) shows the FESEM-EDS analysis and confirms that both Ce and O atoms were uniformly distributed in the nanocrystalline CeO2 sample, which means that there was no compositional variation present in the CeO2 sample. From the EDS spectrum of the ceria sample, the particles are found to be pure Ce and O. From the XRD and EDS spectrum, it is confirmed that only the Ce and O elements are present in the as synthesized nanocrystalline CeO2 and no other impurity were detected.

Fig. 7 shows the DTA and TGA curve of the nanocrystalline CeO2 sample (a) as-prepared (b) annealed at 300 °C for 2 h. From the TGA curve of the as-prepared CeO2 sample, a major and drastic weight loss (17.4%) was observed in the temperature range between 50 and 280 °C. This result shows that the decomposition of the absorbed water with redox reactions between nitrate and organic matter. The DTA curve exhibits a major endothermic peak at 278.8 °C, which is attributed to the evaporation of absorbed water and dehydration of the dried organic matter. Fig. 7(b) shows the DTA-TGA trace of nanocrystalline CeO2 sample annealed at 300 °C for 2 h. The data in Fig. 7 shows that, in the temperature range 50–800 °C, 6.3% weight loss was observed from the TGA trace that is due to evaporation of absorbed moisture. Total disappearance of endothermic peak was obtained from the DTA trace that is due to annealing effect.


image file: c6ra00382f-f7.tif
Fig. 7 TG-DTA of the nanocrystalline CeO2 sample (a) as-prepared (b) annealed at 300 °C for 2 h sample.

3.1 Photocatalytic activity

]The photocatalytic activity of the CeO2 nanocrystals annealed at 300 °C has been evaluated in terms of photodegradation of cationic (Methylene Blue, MB) dye. A dose of 10 mg L−1 of CeO2 nanocrystals was used as the photocatalyst in batch reactor experiments. The initial pH of the dye solution was measured and it was around pH 6. The irradiation time and absorbance of MB degradation CeO2 nanocrystals annealed at 300 °C under UV light radiation has been correlated and it is shown in Fig. 8. The strong absorption bands of MB located at λ = 664 nm decrease gradually with respect to increasing irradiation time and the absorbance of MB was nearly zero after 240 min of UV light irradiation using the CeO2 nanoparticles. The MB solution color turned to nearly translucent during the dye degradation process. Further, the photocatalytic behaviour of the 300 °C annealed CeO2 catalyst was evaluated by performing a comparison with the performance of presence of light without photocatalyst and absence of light with photocatalyst, as shown in Fig. 9. The amount of MB degradation was calculated using C/C0, where C and C0 are the dye concentration based on the absorbance intensity of the sample at a various time interval and the initial concentration, respectively. The degradation of MB in the absence of catalyst (blank) under UV light has not been observed. Meanwhile, the observable degradation of MB was obtained with the presence of catalyst under absence of UV light irradiation. This minimum MB removal suggests that the cationic MB was adsorbed on the surfaces of CeO2 nanoparticles. Based on these results, it can be concluded that the 300 °C annealed CeO2 sample acts as a good photocatalyst towards the degradation of MB and also MB have a greater affinity toward the catalyst, resulting in a much higher removal capacity.
image file: c6ra00382f-f8.tif
Fig. 8 UV-vis absorption spectra of MB in the presence of CeO2 nanoparticles with different time intervals of UV irradiation (λ 365 nm).

image file: c6ra00382f-f9.tif
Fig. 9 Degradation performance of methylene blue, presence of UV irradiation without photocatalyst (a), absence of light with photocatalyst (b) and presence of UV irradiation with CeO2 (c).

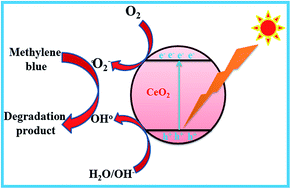
Based on these results, it can be concluded that the 300 °C annealed CeO2 sample acts as a good photocatalyst towards the degradation of MB and also MB have a greater affinity toward the catalyst. The MB photodegradation mechanism could be explained by the electron–hole (e–h+) separation between conduction and the valance band of CeO2 (Fig. 10). During the UV light irradiation, the valance band electrons are excited to conduction band resulting in the separation of electron–hole pairs on the surface of the CeO2 nanoparticles. The holes are trapped by the H2O to form active hydroxyl radicals (˙OH) and superoxides (O2˙, HO2˙). These ˙OH and superoxide (O2˙, HO2˙) are strong oxidant species. Usually the photocatalytic degradation of various organic dyes under UV light irradiation is attributed to their oxidation by these radicals. The photodegradation of MB using CeO2 under UV light could be explained by following reactions:

 
CeO2 + → CeO2(e − h+) (3)
 
h+ + H2O → ˙OH + H+ (4)
 
e + O2 → O2˙ (5)
 
O2 + MB → MB+˙ − O2 (6)
 
˙OH + MB+˙ → CO2 + H2O (7)
 
˙OH + MB+˙ → degradation[thin space (1/6-em)]products (8)


image file: c6ra00382f-f10.tif
Fig. 10 Schematic diagram for oxidative decomposition mechanism of methylene blue by using CeO2 nanoparticles.

The effect of initial MB concentration on its photocatalytic degradation was evaluated at constant dose of CeO2 nanoparticles under UV light. Three initial concentrations (10, 20, and 30 ppm) were evaluated and the results are shown in Fig. 11(a)–(d). MB was fully degraded within 90, 150, and 180 min corresponds to 10, 20, and 30 ppm of MB concentrations, respectively. In this case the dye degradation rate is higher for 10 ppm of dye concentration because the adsorption capacity is higher at lower dye concentration due to more active site is available for dye molecules to be adsorbed on the surfaces of CeO2 nanoparticles. At higher dye concentration which the more dye molecules adsorbed on surfaces of CeO2 nanoparticles would hinder the hydroxyl radicals generation causes the decrease rate of photodegradation efficiency. Therefore, much longer time is required to reach the complete degradation of higher concentrations of MB compared to 10 ppm of MB. The unique sphere like nanostructures of CeO2 leads to large high surface area (SSA), providing more chemically active sites and improving the degradation of the dye molecules than available photocatalysts such as, ZnO-reduced graphene oxide (RGO)–carbon nanotube (CNT) composites,36 hierarchical structured nanofibrous anatase–titania–cellulose composite,37 Cu/ZnO core/shell nanocomposites,38 ZnO/SnO2 hetero-nanofibers,39 MnOx/WO3,40 and TiO2/graphene nanocomposites.41 Therefore, ultrafine CeO2 catalysts possessed synergic effects which may be valuable to the degradation of the various recalcitrant organics.


image file: c6ra00382f-f11.tif
Fig. 11 Photocatalytic activity of CeO2 sphere like nanoparticles (a) 10, (b) 20 and (c) 30 ppm of MB concentrations and (d) degradation rate curves.

4. Conclusion

Nanocrystalline CeO2 was successfully synthesized by solution combustion method. The structural, physical and chemical properties were studied by using various analytical techniques. X-ray diffraction analysis of CeO2 confirmed acubic (fcc) and the average grain size was found to be 10, 8 and 19 nm corresponds to as-prepared, annealed at 300 and at 600 °C, respectively. The UV-visible absorption spectra of the CeO2 samples give a strong absorbance peak at 294 nm for the as-prepared and at 292 nm for the annealed samples. The slight shift in the peak absorption wavelength was due to the high crystalline nature of nano CeO2. The results of UV-visible reflectance spectra of the and 300 °C annealed samples revealed that the band gap energy (Eg) was found to be 3.42 eV for the as-prepared sample and 3.6 eV for the sample annealed at 300 °C. The bandgap increased as the particle size of CeO2 decreases, meaning that smaller nanoparticles exhibit better UV absorption. The PL spectra showed the presence of blue-emission in the visible region. Morphological studies and elemental analysis were performed using FESEM-EDS and HETEM. The thermal analysis measurements using DTA and TGA trace indicated endothermic reaction and weight loss was obtained. The higher band gap of 300 °C annealed samples exhibited high photocatalytic activity towards the degradation of MB under UV light irradiation. The CeO2 particles annealed at 300 °C could be attractive for several applications such as materials for photocatalyst, UV filters and photoelectric devices.

Acknowledgements

We acknowledge Prof. K. Subathra, Principal (i/c), Government College of Engineering, Bargur, Tamil Nadu, India for encouraging and continuous support for completing this project. We thank TEQIP-II under Govt. of India, funded by World Bank for supporting this project. Financial supports of this work by the Ministry of Science and Technology, Taiwan (NSC101-2113-M-027-001-MY3 to SMC) is gratefully acknowledged.

References

  1. X. Yu, F. Li, X. Ye, X. Xin and Z. Xue, J. Am. Ceram. Soc., 2000, 83, 964–966 CrossRef CAS.
  2. E. Aneggi, M. Boaro, C. D. Leitenburg, G. Dolcetti and A. Trovarelli, J. Alloys Compd., 2006, 408, 1096–1102 CrossRef.
  3. E. N. Ndifor, T. Garcia, B. Solsona and S. H. Taylor, Appl. Catal., B, 2007, 76, 248–256 CrossRef CAS.
  4. Z. Qiao, Z. Wu and S. Dai, ChemSusChem, 2013, 6, 1821–1833 CrossRef CAS PubMed.
  5. S. Agarwal, L. Lefferts and B. L. Mojet, et al., ChemSusChem, 2013, 6, 1898–1906 CrossRef CAS PubMed.
  6. Tanaa, M. Zhang, J. Li, H. Li, Y. Li and W. Shen, Catal. Today, 2009, 148, 179–183 CrossRef.
  7. T. Pirmohamed, J. M. Dowding and S. Singh, et al., Chem. Commun., 2010, 46, 2736–2738 RSC.
  8. N. M. Zholobak, V. K. Ivanov and A. B. Shcherbakov, et al., J. Photochem. Photobiol., B, 2011, 102, 32–38 CrossRef CAS PubMed.
  9. S. Yabe and T. Sato, Cerium oxide for sunscreen cosmetics, J. Solid State Chem., 2003, 171, 7–11 CrossRef CAS.
  10. G. M. Christie and F. P. F. Van Berkel, Solid State Ionics, 1996, 83, 17–27 CrossRef CAS.
  11. P. Jasinski, T. Suzuki and H. U. Anderson, Sens. Actuators, B, 2003, 95, 73–77 CrossRef CAS.
  12. R. E. Kiork and D. F. Othmer, Encycl. Chem. Technol., 1979, 5, 315–337 Search PubMed.
  13. D. O. Raemy, L. K. Limbach and B. Rothen-Rutishauser, et al., Eur. J. Pharm. Biopharm., 2011, 77, 368–375 CrossRef CAS PubMed.
  14. P. Muhamed Ashraf and S. M. A. Shibli, J. Alloys Compd., 2009, 477–482 CrossRef.
  15. P. C. C. Faria, D. C. M. Monteiro and J. J. M. Orfao, et al., Chemosphere, 2009, 74, 818–824 CrossRef CAS PubMed.
  16. C. Wang, A. Zhang and H. Reza Karimi, Math. Probl. Eng., 2014, 2014, 1 Search PubMed.
  17. X. Q. Fu, C. Wang, H. C. Yu, Y. G. Wang and T. H. Wang, Nanotechnology, 2007, 18, 145503 CrossRef.
  18. D. Barreca, A. Gasparotto, C. Maccato, C. Maragno, E. Tondello, E. Comini and G. Sberveglieri, Nanotechnology, 2007, 8, 5502 Search PubMed.
  19. C. Xu, X. Qu and Nature publishing group, NPG Asia Mater., 2014, 6, e90 CrossRef CAS.
  20. P. Eun-Jung, P. Young-Kwon and P. Kwangsik, Toxicol. Res., 2009, 25, 79 CrossRef.
  21. S. Mittal and A. K. Pandey, BioMed Res. Int., 2014, 14 Search PubMed.
  22. A. Corma, P. Atienzar, H. García and J. Y. Chane-Ching, Nat. Mater., 2004, 3, 394–397 CrossRef CAS PubMed.
  23. J. Hong, J. R. Peralta-Videa and C. Rico, et al., Environ. Sci. Technol., 2014, 48, 4376–4385 CrossRef CAS PubMed.
  24. H. Hahn, Nanostruct. Mater., 1997, 9, 3–12 CrossRef CAS.
  25. M. Kumar Rath, S. Kumar Acharya and B. H. Kim, et al., Mater. Lett., 2011, 65, 955–958 CrossRef.
  26. N. Uekawa, M. Ueta and Y. J. Wu, et al., J. Mater. Res., 2004, 19, 1087–1092 CrossRef CAS.
  27. F. Meng, C. Zhang and Q. Bo, et al., Mater. Lett., 2013, 99, 5–7 CrossRef CAS.
  28. M. Victor, G. Delacruz, F. Ternero, R. Pereniguez, A. Caballero and J. P. Holgado, Appl. Catal., A, 2010, 384, 1–9 CrossRef.
  29. S. Phoka, P. Laokul, E. Swatsitang, V. Promarak, S. Seraphin and S. Maensiri, Mater. Chem. Phys., 2009, 115, 423–428 CrossRef CAS.
  30. C. W. Sun, H. Li, H. R. Zhang, Z. X. Wang and L. Q. Chen, Nanotechnology, 2005, 16, 1454–1463 CrossRef CAS.
  31. S. H. Yu, H. Colfen and A. Fischer, Colloids Surf., A, 2004, 243, 49–52 CrossRef CAS.
  32. D. Channei, B. Inceesungvorn, N. Wetchakun, S. Ukritnukun, A. Nattestad and J. Chen, Sci. Rep., 2014, 4, 5757 CrossRef CAS PubMed.
  33. H. R. Pouretedal and A. Kadkhodaie, Chin. J. Catal., 2010, 31, 1328–1334 CrossRef CAS.
  34. S. K. Muduli, S. Wang, S. Chen, C. Fan Ng, C. H. Alfred Huan, T. C. Sum and H. S. Soo, Beilstein J. Nanotechnol., 2014, 5, 517–524 CrossRef CAS PubMed.
  35. V. Štengl, S. Bakardjieva and N. Murafa, Mater. Chem. Phys., 2009, 114, 217–226 CrossRef.
  36. T. Lv, L. Pan, X. Liu and Z. Sun, Catal. Sci. Technol., 2012, 2, 2297–2301 CAS.
  37. Y. Luo, J. Xu and J. Huang, CrystEngComm, 2014, 16, 464–471 RSC.
  38. S. H. Chang, P. Y. Yang, C. M. Lai, S. C. Lu, G. A. Li, W. C. Chang and H. Y. Tuan, CrystEngComm, 2016, 18, 616–621 RSC.
  39. X. Chen, F. Zhang, Q. Wang, X. Han, X. Li, J. Liu, H. Lin and F. Qu, Dalton Trans., 2015, 44, 3034–3042 RSC.
  40. M. Amini, B. Pourbadiei, T. P. A. Ruberub and L. Keith Woob, New J. Chem., 2014, 38, 1250–1255 RSC.
  41. P. Shao, J. Tian, W. Shi, S. Gao and F. Cui, J. Mater. Chem. A, 2015, 3, 19913–19919 CAS.

This journal is © The Royal Society of Chemistry 2016
Click here to see how this site uses Cookies. View our privacy policy here.