
Improving the dissolution of fenofibrate with yeast cell-derived hollow core/shell carbon microparticles†
Xiaoxi Huanga,
Tao Zhangb,
Xiaoxin Zouc,
Zhimin Tao*a and
Tewodros Asefa*abd
aDepartment of Chemistry and Chemical Biology, Rutgers, The State University of New Jersey, Piscataway, New Jersey 08854, USA. E-mail: tasefa@rci.rutgers.edu
bDepartment of Chemical and Biochemical Engineering, Rutgers, The State University of New Jersey, Piscataway, New Jersey 08854, USA
cState Key Laboratory of Inorganic Synthesis and Preparative Chemistry, International Joint Research Laboratory of Nano-Micro Architecture Chemistry, College of Chemistry, Jilin University, Changchun 130012, China
dInstitute for Advanced Materials, Devices and Nanotechnology (IAMDN), Rutgers, The State University of New Jersey, Piscataway, New Jersey 08854, USA
First published on 16th March 2016
Abstract
Hollow core/shell carbon microparticles, denoted HCSC600, are synthesized from yeast cells by coating the cells with silica shells, and then pyrolyzing the silica-protected yeast cells at 600 °C, and finally etching the silica shells off of the carbonized products. The microparticles possess a yolk/shell structure with very large interior hollow spaces and interconnected porous structures—structural features that are generally useful for adsorption and release of drug molecules. The microparticles are characterized by various methods, including scanning electron microscopy, transmission electron microscopy, nitrogen gas adsorption/desorption and X-ray photoelectron spectroscopy. Their adsorption properties are evaluated by using rhodamine B (RhB) as a model drug and the poorly soluble drug fenofibrate (FFB), a prodrug of fenofibric acid, which is widely used to treat hypertriglyceridemia. Compared with the control material prepared from yeast cells without silica coating (named YCC600), the HCSC microparticles showed much higher adsorption capacity for both compounds, suggesting that the silica coating is important not only for controlling the morphology of the particles but also for giving them high surface area. Furthermore, it is found that the HCSC600 material loaded with FFB allows the drug molecules to be released faster and better than they are from the bulk drug. The results indicate that HCSC microparticles have great potential to serve as drug delivery vehicles, especially for poorly bioavailable drugs such as FFB, for biomedical applications.
1. Introduction
The development of carbon nanomaterials with large specific surface area and unique morphology is still an active research area, due to the potential applications of such materials for drug delivery,1–5 sensing,6,7 adsorption,8 and catalysis.9–11 The structure and morphology with which these materials can be synthesized includes nanotubes, 2-dimensional/graphitic flakes, nanodots, and mesoporous monoliths. This, as well as the properties of these materials, depends on how they are synthesized. For example, mesoporous carbons, which can be synthesized from different types of precursors by pyrolyzing the precursors at high temperatures in the presence of hard/soft templates,12 can have different surface areas and pore sizes depending on the precursors and/or the templates employed to make the materials. Their surface areas and structural features, in turn, can dictate whether or not the materials would be suitable for some specific applications, e.g., as host materials for a large payload of bioactive guest molecules with specific sizes for a given biomedical application. Besides their pore size and structure, the morphology of such nanostructured materials can drastically dictate their biological properties and possible medical applications. In some cases, rod-shaped nanomaterials can penetrate cell membranes better than their spherical counterparts, and thereby deliver drugs to mammalian cells more effectively.13 In some other cases though, the opposite can be true; i.e., spherical nanomaterials can impart better or more desired biological effects.13 The different physical features, which carbon and other nanomaterials can be synthesized with, can also determine their circulation times in bloodstream, potential accumulation in tissues, elimination from different organs in the body, endocytosis/exocytosis, etc.14–16 Thus, synthetic routes that can lead to porous carbon-based materials with different morphology, and investigation of the material's physicochemical characteristics and possible useful properties for biological applications, are worth exploring.By using inherently shaped biomass-derived materials as precursors (e.g., cellulose nanowhiskers) and taking advantage of their shapes, it should be technically possible to make various kinds of shaped, porous carbon nanomaterials. The shaped biomaterial precursors can include tobacco mosaic virus (TMV) (which has a rod-like shape with 300 nm in length and 18 nm in diameter),17 Escherichia coli (E. coli) bacterium (which also has a rod-like shape with a few micrometer in length and generally less than one micrometer in diameter),18 sunflower pollen (which has a diameter of about 30 μm with spine-like morphology),19 etc. Although these species are suitable as precursors and self-templates to lead to shaped carbon materials via pyrolysis, they can not do so if they are pyrolyzed directly. In other words, these precursors can easily undergo sintering and lead to bulk carbon products without maintaining the original morphology if they are pyrolyzed directly.
Recently, surface modification of cells has attracted a great attention for cell labeling, cell targeting and other biological applications.20 This type of synthetic method involving silica coating around cells and other biomass derived precursors has recently been taken advantage by our group to allow morphology-controlled synthesis of carbon nanomaterials.10,21 The method involves the deposition of silica shells around biomass-derived, shaped particles, followed by carbonization of the silica-coated biomass particles, and finally dissolution of the silica shells from the carbonized products. This results in shaped carbon particles whose morphology is akin to those of the original precursors, thanks to the silica protection placed around the biomass particles to prevent the carbon products from undergoing aggregation during pyrolysis of the precursors.10,21 In principle, this synthetic strategy should be applicable to many types of natural and synthetic, shaped precursors (e.g., E. coli, TMV) for making inherently shaped carbon nano- and micro-materials for a variety of applications.
By adopting this method on yeast cells, common unicellular fungal species with uniform micron-sized morphology, we here report the synthesis of mesoporous hollow core/shell carbon microparticles (labeled as HCSC600) that can serve as effective drug delivery vehicles for difficult-to-deliver drugs. To make the carbon microparticles, yeast cells were first wrapped with silica shells, the silica-coated yeast cells were then carbonized at 600 °C, and the silica shells were finally etched with dilute aqueous basic solution. For comparison, or as control material for our studies, a carbon material, denoted YCC600, was synthesized from yeast cells without protecting them with silica shells, but under otherwise similar pyrolysis conditions. The adsorption properties of the two materials were then examined, first by using a model dye, rhodamine B (RhB), and then the poorly soluble drug fenofibrate (FFB), a prodrug of fenofibric acid, which is widely used to treat hypertriglyceridemia. Compared with YCC600, HCSC600 was found to have a better adsorption capacity for RhB and a better ability to entrap and release the poorly soluble drug FFB. Moreover, HCSC600 was found to promote the dissolution and the delivery of the otherwise poorly soluble drug FFB faster in aqueous solution than the bare drug did. The results show the great potential of HCSC600 microparticles as drug delivery vehicles, especially for poorly water-soluble drugs such as FFB.
2. Experimental section
2.1 Materials and reagents
Tetraethyl orthosilicate (TEOS), iron(III) chloride (FeCl3), fenofibrate (FFB), sodium dodecyl sulfate (SDS), and ammonia solution (30%) were purchased from Sigma-Aldrich. Sodium hydroxide (NaOH) and absolute ethanol were obtained from Fisher Scientific. Phosphate buffered saline (PBS, Gibco®, pH 7.4) was acquired from Life Technologies. All reagents were analytical grade, and they were all used as received without further purification.2.2 Synthesis of hollow core/shell carbon microparticles (HCSC600) from yeast cells
To synthesize the HCSC600 microparticles, yeast cells (4 g) were first dispersed in 180 mL ethanolic solution (67% v/v). Into the dispersion, a small amount of FeCl3 (0.1 mmol) was added. After stirring the dispersion for 30 min, ammonia solution (4.2 mL, 30%) was added into it. The dispersion was then stirred further for another 30 min. This was followed by addition of TEOS (5 mL). The solution was sonicated for 1 h, and then stirred for 18 h, to allow the deposition of silica shells around the yeast cells. The solid product was recovered from the dispersion by centrifugation, and washed with ethanol (25 mL) three times (via sonication, followed by centrifugation, and finally decantation). Then, 400 mg of the resulting material was placed in a boat-shaped alumina crucible and heated in N2 atmosphere from room temperature to 200 °C at a rate of 1 °C min−1 in a tube furnace. After the sample was kept at 200 °C for 2 h, the temperature was increased to 300 °C at 1 °C min−1 and kept at this temperature for 2 h. Finally, the furnace temperature was raised to 600 °C at a ramp of 10 °C min−1 and kept at 600 °C for 2 h. The sample was then allowed to cool down to room temperature at a ramp of 10 °C min−1. The silica shells in the resulting silica-coated carbon particles were etched by keeping the particles in 16 mL NaOH (1.25 M) solution within an autoclave for 18 h at 100 °C. The mixture was centrifuged, and the solid product was washed repeatedly with water until the supernatant had a neutral pH and then let to dry. After this step, a black powdered product, named hollow core/shell carbon microparticles (HCSC600) was obtained.2.3 Synthesis of nonporous yeast cell carbon microparticles (YCC600) from yeast cells
To synthesize the control material YCC600, yeast cells without silica shells around them were used as precursor. The cells were subjected to the same pyrolysis procedure as the one used to make the HCSC600 above, finally giving YCC600.2.4 Comparison of the adsorption properties of HCSC600 versus YCC600 toward RhB
Several dispersions of HCSC600 or YCC600 in water with various concentrations, namely 500, 375, 250, 125, and 62.5 μg mL−1, and each with 10 μg mL−1 RhB, were prepared. The dispersions were stirred at room temperature for 24 h to let RhB adsorb onto the microparticles and let the adsorption process reach to equilibrium. After this step, the dispersions were centrifuged, and the supernatants were scanned with UV-Vis spectrometer. The concentration of RhB in the supernatants was then calculated from the absorbance value at 544 nm (i.e., the λmax corresponding to RhB) in the absorption spectra, with the help of the calibration curve obtained beforehand using a set of known concentrations of RhB.2.5 Determination of the solubility of FFB
In order to test the solubility of FFB, an excess amount of FFB was placed in 10 mL of 0.3% SDS in PBS solution. The resulting mixture was stirred at 37 °C for 3 days. At different time intervals, the solution was centrifuged, and the absorbance of the supernatant was measured with UV-Vis spectrometer to determine the amount of FFB dissolved in the solution. The experiment was performed in triplicate for statistical purposes, and the results were recorded as mean ± standard deviation.2.6 Investigation of the dissolution and release of FFB from FFB-loaded HCSC600
FFB-loaded HCSC600 was synthesized with incipient wetness method, by stirring HCSC600 with a solution of FFB in acetone at 40 °C for about 30 min, and then letting the solvent evaporate completely under stirring. The mass ratio of FFB to HCSC600 was set as 1![[thin space (1/6-em)]](https://www.rsc.org/images/entities/char_2009.gif) :1. The dissolution or the release of FFB from the FFB-loaded HCSC600, which contained a total of 3 mg of drug, was studied by stirring the material in 100 mL of 0.3% SDS in PBS. While stirring the solution at 37 °C, 0.5 mL of sample was withdrawn at different intervals of time (5, 10, 15, 20, 30, 45, and 60 min) and centrifuged. The absorbance of the supernatant was then measured with UV-Vis spectroscopy.
:1. The dissolution or the release of FFB from the FFB-loaded HCSC600, which contained a total of 3 mg of drug, was studied by stirring the material in 100 mL of 0.3% SDS in PBS. While stirring the solution at 37 °C, 0.5 mL of sample was withdrawn at different intervals of time (5, 10, 15, 20, 30, 45, and 60 min) and centrifuged. The absorbance of the supernatant was then measured with UV-Vis spectroscopy.
As a control experiment, the dissolution or release profile of a commercially available bare FFB was evaluated by following the same procedure. The concentration of FFB released into the solution was determined by comparing the absorbance values at 288 nm (i.e., the λmax corresponding to FFB) of the supernatants with those in the calibration curve plotted beforehand by using several solutions of known concentrations of FFB. The tests were done in triplicate, and the results were compiled as mean ± standard deviation.
2.7 Material characterization
The porosity of the materials was investigated by physical adsorption using nitrogen at the liquid-nitrogen temperature (−196 °C) with a Micromeritics TriStar-3000 instrument (Micromeritics, USA). The Brunauer–Emmett–Teller (BET) surface area and Barrett–Joyner–Halenda (BJH) pore size distribution of the materials were determined from their corresponding adsorption/desorption data. Thermogravimetric analyses (TGA) of the materials were performed with PerkinElmer TGA7 by heating the samples at a rate of 10 °C min−1 under a constant flow of air at a rate of 20 mL min−1. Surface elemental composition of the materials was probed with X-ray photoelectron spectroscopy (XPS) using an ESCALAB 250 X-ray photoelectron spectrometer equipped with Al Kα radiation source (hν = 1486.6 eV). Scanning electron microscopic (SEM) images were acquired with a Zeiss Sigma Field Emission SEM. Transmission electron microscopy (TEM) images were obtained with a Topcon 002B TEM microscope operating at 200 kV. UV-Vis spectra of the solutions were recorded with a Lambda 850 spectrophotometer (PerkinElmer).3. Results and discussion
A four-step synthetic procedure, as shown in Fig. 1, was used to synthesize the mesoporous HCSC600 microparticles.21a First, a solution containing [Fe(NH3)6]3+ was incubated with yeast cells to produce positively charged surfaces over the cells, and to help the cells adsorb silicate species and form silica shells around the yeast cells in the subsequent step.21a The Fe(III) ions were placed around the yeast cells also to help the yeast cells undergo carbonization/graphitization during the pyrolysis step (see below).22 The Fe(NH3)6]3+-coated yeast cells (yeast cell@[Fe(NH3)6]3+) were then mixed with TEOS, and after stirring the two together for several hours, the [Fe(NH3)6]3+-coated yeast cells were coated with silica shells forming yeast cell@[Fe(NH3)6]3+@SiO2 microparticles. The particles were then carbonized at 600 °C in a tube furnace under N2 atmosphere. After etching the silica shells on the particles using an aqueous NaOH solution, and then washing the solid product with water and drying it (see Experimental section for details), the HSCS600 microparticles were obtained. | ||
| Fig. 1 Schematic illustration of the procedures used to synthesize HCSC600 from yeast cells: (a) surface functionalization of a yeast cell with [Fe(NH3)6]3+ ions, (b) deposition of a silica shell around the [Fe(NH3)6]3+-coated cell forming yeast cell@[Fe(NH3)6]3+@SiO2, (c) high temperature treatment in inert atmosphere of the yeast cell@[Fe(NH3)6]3+@SiO2, and (d) removal of the SiO2 shell from the carbonized product, followed by washing the product with water and letting it dry under ambient conditions, finally giving the hollow core–shell carbon (HCSC) microparticle. | ||
The thermogravimetric analysis (TGA) curve of pure yeast cells in air showed that there was only 5.5% of weight left at the temperature of 630 °C, whereas the TGA curve of the yeast cell@[Fe(NH3)6]3+@SiO2 microparticles in air (Fig. 2) revealed that there was 31.5% weight left in the material at 630 °C. So, most of the weight in the latter case should be due to the silica shells. On the other hand, the TGA curve of the carbonized yeast cell@SiO2 microparticles (whose silica shells were still present) showed a much higher (70.1%) residual weight (or only 29.9% weight loss) at 630 °C (cf. the uncarbonized yeast cell@[Fe(NH3)6]3+@SiO2 microparticles gave 31.5% residual weight or 68.5% weight loss at 630 °C). This clearly indicates that the carbonization of the yeast cell@[Fe(NH3)6]3+@SiO2 precursor causes degradation and removal of a substantial amount of volatile species from the yeast cells when forming the desired hollow core/shell carbon (HCSC600) microparticle.
 | ||
| Fig. 2 Thermogravimetric analysis (TGA) curves in air of (A) yeast cells, (B) yeast cell@[Fe(NH3)6]3+@SiO2, (C) carbonized yeast cell@SiO2 and (D) HCSC600. It should be noted that both carbonized yeast cell@SiO2 and HCSC600 materials contain a tiny amount of iron species as well. | ||
The presence of silica in the yeast cell@[Fe(NH3)6]3+@SiO2 microspheres was further corroborated by X-ray photoelectron spectroscopy (XPS). As shown in Fig. 3, an XPS peak at ca. 103 eV that can be attributed to the Si2p signal of SiO2 was observed in the XPS spectrum of this particular sample; however, no similar XPS signal, in the same range, was seen in the XPS spectrum of yeast cells.
 | ||
| Fig. 3 High-resolution XPS spectra of Si2p for yeast cell, yeast cell@[Fe(NH3)6]3+@SiO2 and yeast@SiO2-600 materials. | ||
The field emission scanning electron microscopy (FESEM) image of the carbonized yeast cell@SiO2 showed that most of the particles in this composite material have similar morphology as those of the yeast cells (Fig. 4a and b). Even after removal of the silica shells by etching the composite material with aqueous NaOH solution, the original morphology of the yeast cells was still preserved in the resulting carbon material (i.e., HCSC600) (Fig. 4c). On the other hand, when the yeast cells without silica shells were carbonized under similar pyrolysis conditions, large, non-uniform, or collapsed carbon microparticles were obtained (Fig. 4d). So, these results suggest that the silica shells serve as a robust protective layer around the yeast cells during pyrolysis, obviating the aggregation of the ensuing products/particles. The results also indicate the importance of placing silica shells around the yeast shells to imprint the morphology of the yeast cells into the carbon products, or to preserve their shape and size.
 | ||
| Fig. 4 SEM images of yeast cells (a), yeast@SiO2-600 (b), HCSC600 (c) and YCC600 (d). TEM images of HCSC600 (e and f). | ||
The structure of HCSC600 particles was investigated using transmission electron microscopy (TEM). In the TEM images, not only elliptical shapes resembling those of the yeast cells were seen, but also unique hollow core/shell structures, whose shells seem to have been derived from the cell walls and whose cores seem to have been originated from the nuclei of the cells, were observed (Fig. 4e). This is possible because the yeast cells served as the source of the actual final products, besides functioning as self-templates (cf., the few notable synthetic methods reported previously, where yeast cells were used to serve merely as sacrificial templates23,24). Furthermore, a close observation of the structures of HCSC600 particles by TEM revealed the presence of nanoporous structures in the shells of the microparticles (Fig. 4f), besides the large void spaces between the shells and the cores.
Nitrogen adsorption/desorption measurements were performed to determine the porosity and the surface area of HCSC600 and YCC600 (Fig. 5). In low relative pressure ranges, the control material YYC600 adsorbed only a very small amount of nitrogen (ca. 0.1 cm3 g−1), and its BET surface was found to be 0.002 m2 g−1. So, it is evident that this material, which was prepared from yeast cells in the absence of silica shells, is non-porous. This can be accounted by the fact that without the silica shells, the yeast cells do not have: (1) something to protect them from sintering/aggregating during pyrolysis/carbonization and (2) something to serve as templates to yield porous structures in them after etching. In contrast, the nitrogen adsorption/desorption isotherm of HCSC600 showed the adsorption of a substantial amount of nitrogen in the material with Type-IV like isotherm with a hysteresis loop (Fig. 5a), suggesting the existence of mesoporosity in this material. The corresponding BJH pore size distribution curve also displayed a peak centered at ca. 15 nm, further confirming the presence of mesoporous structure in the material. In addition, significant adsorption in higher relative pressure associated with macroporous structure was observed. This porosity is most likely due to the hollow space within each particle as well as some interparticle void spaces, which were observed in the TEM images above. The BET surface area and the pore volume of HCSC600 were found to be 184 m2 g−1 and 1.1 cm3 g−1, respectively.
 | ||
| Fig. 5 Nitrogen adsorption/desorption isotherms of HCSC600 and YCC600 (a) and the BJH pore size distribution curve of HCSC600 (b). | ||
Since HCSC600 was found to comprise micron-sized core–shell particles with hollow space, nanoporous shells, and reasonably high surface area, we had expected that the material could be potentially useful for drug delivery applications. With this in mind, we evaluated the adsorption capacity of HCSC600 as well as the control material YCC600 using RhB as the model drug using UV-Vis spectroscopy. Beforehand, the UV-Vis spectra of pure RhB in aqueous solution were acquired. The spectra (Fig. S1†) showed a major peak at 554 nm, which corresponds to RhB and whose intensity increased as the concentration of RhB in solution was increased.
In the actual adsorption experiments, a solution of 10 μg mL−1 RhB and different concentrations of HCSC600 or YCC600 were mixed and stirred together to let RhB adsorb on HCSC600 and YCC600 materials. The amount of RhB adsorbed in the two carbon materials, calculated as the ratio of the mass of RhB with respect to that of the microparticles, was then determined (see Fig. 6a). The amount of RhB adsorbed by HCSC600 in a solution containing 62.5 μg mL−1 of HCSC600 was found to be 44.8 μg mg−1. But the amount adsorbed by YCC600 in a solution containing the same concentration of YCC600 was only 16.4 μg mg−1. This result clearly indicates that the adsorption capacity of HCSC600 for RhB is much higher (2.7-fold higher) than that of YCC600. The weight percentage of RhB adsorbed on both carbon materials from the initial solution was then determined (Fig. 6b), and the amount was found to be much higher again for HCSC600 compared with that of YCC600. Notably also, when the concentration of HCSC600 in the solution was increased, the amount of RhB taken up by the material continued to rise; however, when the concentration of YYC600 in the solution was increased, the mass of RhB taken up by this material barely changed. It is worth noting that when the concentration of HCSC600 was increased to 500 μg mL−1, the material took up 98.9% of the RhB from the solution, whereas when the concentration of YYC600 was increased to the same value, the material entrapped only 8.3% of the RhB from the solution. So, on the basis of these results, HCSC600 can be said to have much higher adsorption capacity for RhB (and possibly many other similar drugs) than YYC600. This is likely due to HCSC600's favorable structure, mesoporosity, and relatively high surface area, which allow it to host drug molecules better. These results also indirectly show the importance of using silica shells in the synthesis of these yeast cell-derived carbon materials, allowing the materials to have highly desirable properties (i.e., high surface area and large pore volume) to host drug molecules.
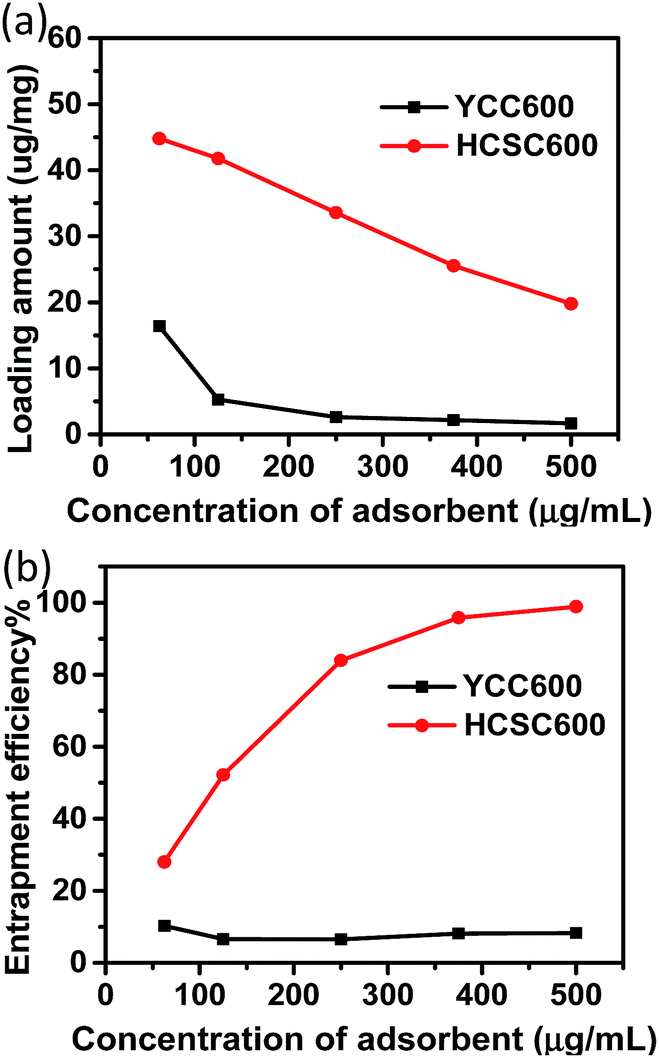 | ||
| Fig. 6 Comparison of the loading amount (a) and entrapment efficiency (%) (i.e., drug loading/actual drug amount × 100) (b) of RhB in HCSC600 and YYC600. | ||
To further investigate the potential biomedical application of the mesoporous carbon material HCSC600, the adsorption capacity of the material for the poorly water-soluble drug FFB and the release profile of the adsorbed FFB from the FFB-loaded material were evaluated. FFB is a prodrug of fenofibric acid (also known as Trilipix®), which is commonly used to treat hypertriglyceridemia, owing to its ability to reduce low-density lipoprotein (LDL) and very low-density lipoprotein (VLDL) while increasing the level of high-density lipoprotein (HDL).25 However, because its molecular structure comprises mainly hydrophobic groups, it belongs to so-called BSC II drugs, which are hard to deliver due to their very poor solubility in aqueous solutions (Fig. S2†). So, to help enhance the bioavailability of this otherwise more effective drug, mesoporous silicas,26–28 mesoporous carbons,25 and polymers29 have been previously studied as delivery vehicles for the drug. However, many of these materials do not have a well-defined morphology, the morphological feature that is often required of nano- and micro-materials to find biological applications.14–16 Thanks to the silica protection placed around the yeast cells, we have been able to obtain carbon microparticles that have both the structural features to carry FFB and the morphological features to serve as good drug delivery vehicles, as mentioned above.14–16
Hence, we here have attempted to evaluate HCSC600's ability to improve the dissolution and delivery of FFB, by preparing FFB-loaded HCSC600 sample (denoted as HCSC600/FFB) and then investigating the material's drug release profiles. To load the FFB into the mesoporous HCSC600, we employed an incipient wetness technique by using acetone as a solvent to dissolve the FFB. The solution containing FFB in acetone was then mixed with HCSC600 (with a mass ratio set as 1:1). After stirring the two together for several minutes, the acetone was let to evaporate at 37 °C, producing the FFB-loaded HCSC600 (HCSC600/FFB).
Before the dissolution experiments, the UV-Vis spectra of FFB with different concentrations were acquired, and the absorbance of the absorption maximum (λmax) at ca. 288 nm was measured. The experiment showed that the intensity of the peaks increased as the drug concentration in the solution was increased (Fig. S3†). The solubility of FFB in 0.3% SDS solution (which was stirred for as long as 3 days at 37 °C) was found to be 60.17 ± 0.42 μg mL−1.
The dissolution profiles of FFB from HCSC600/FFB as well as from bulk FFB were measured in PBS containing 0.3% SDS, and the results were compared with one another. As depicted in the graphs in Fig. 7a, more FFB could be seen released into the solution from the FFB/HCSC600 than from the bare FFB. For example, in 30 min time period, the drug released from HCSC600/FFB was 39.2 ± 7.5%, which is much higher (2.3-fold higher) than that from bare FFB (17.1 ± 2.0%). The difference was even more significant in the first 15 min, as can be seen in the slopes representing their dissolution rates in Fig. 7b. While HCSC600/FFB showed a dissolution rate of 1.8% min−1, the bulk FFB showed a dissolution rate of only 0.46% min−1. This means that the former gives 3.9 times greater dissolution rate than the bulk FFB does. This result indicates that the extremely hydrophobic drug can be released into an aqueous environment much faster with the aid of mesoporous carbon microparticles such as HCSC600.
 | ||
| Fig. 7 (a) Dissolution profile of FFB molecules from bulk FFB and HCSC600/FFB. (b) Enlarged dissolution graphs of the blue dashed section in (a), along with the slopes of the graphs in the first 15 min. | ||
It is well known that the size of active pharmaceutical ingredients (APIs) or bulk drug particles in formulations can influence their dissolution into solutions, where generally the smaller the size of the particles, the faster they dissolve.30 So, by confining the FFB as smaller sized particles within the pores of the host mesoporous material HCSC600 via incipient wetness method, as we did, the FFB was made to undergo faster dissolution and be released as molecular species in aqueous media better. It is also worth noting that the core–shell and hollow morphology of the materials remained intact even after the release experiments, as can be seen in the TEM image of such sample in Fig. S4.†
To get some more insights into how the FFB interacted with the carbon material, allowing FFB's dispersion within the material and improving its dissolution, the structure of HCSC600 was studied by X-ray photoelectron spectroscopy (XPS). The XPS survey spectra revealed that HCSC600 was composed of C, O and N atoms (Fig. S5†). High resolution XPS analysis showed that residual amount of P (0.25%) and Fe (0.13%) also existed in the sample (Fig. 8). The high resolution XPS of C1s could be deconvoluted into three peaks at 284.5, 285.0, 286.3 eV that correspond to the sp2 C, sp3 C and C–O/C–N moieties, respectively.31 This result suggested that the carbon species in HCSC600 was composed of graphite carbons (sp2 C) as well as non-graphite ones (sp3 C), doped with some O and N atoms. The N atoms existed in three different major forms: pyridinic, pyrrolic/pyridone and quaternary, as confirmed by the peaks observed at binding energy at 398.6, 400.1, and 401.1 eV, respectively. The XPS spectra of P2p showed only a peak at 132.8 eV, associated with the P![[double bond, length as m-dash]](https://www.rsc.org/images/entities/char_e001.gif) O/P–O groups. Additionally, a small peak corresponding to a small amount of iron (0.13 at%), was also observed in the spectra, possibly due to the incomplete removal of iron species during the material preparation.
O/P–O groups. Additionally, a small peak corresponding to a small amount of iron (0.13 at%), was also observed in the spectra, possibly due to the incomplete removal of iron species during the material preparation.
 | ||
| Fig. 8 High-resolution XPS spectra of C1s (a), N1s (b), P2p (c), Fe2p (d) for HCSC600. | ||
Putting these results together, FFB's favorable adsorption on HCSC600 can occur via two possible types of interactions: (1) hydrogen bonding interaction, where the FFB's oxygen atoms offer lone pair electrons or serve as hydrogen bond acceptors, while the HCSC600 microparticles act as the hydrogen bond donor by using the hydrogen atoms of their pyrrolic, pyridine, pyridinium, or hydroxide moieties and (2) π–π interactions between the aromatic groups of FFB molecules with the sp2 carbon structure of HCSC600 formed during carbonization/graphitization of the yeast cells aided by iron species.32,33 So, these two possible weak interactions between FFB and the mesoporous carbon material (HCSC600), combined with the mesoporous carbon structure in which the hydrophobic drug molecules can be well dispersed, are thus what may have made FFB to be adsorbed well on HCSC600 and then be released into an aqueous environment more quickly.
4. Conclusions
In summary, we have synthesized hollow core/shell mesoporous carbon microparticles from yeast cells by treating the cells at 600 °C after coating them with silica and then removing the silica after carbonization. The resulting carbon material, which is labeled as HCSC600, has been found to possess not only high surface area and mesoporous and core/shell structure, but also unique morphology inherited from the yeast cells. The HCSC600 microparticles have been found to have good adsorption capacity for a model drug rhodamine B (RhB). Moreover, the HCSC600 microparticles have been found to carry a large payload of the highly hydrophobic drug fenofibrate (FFB), a prodrug of fenofibric acid and a drug commonly used to treat hypertriglyceridemia. The HCSC600 microparticles also made the payload of FFB molecules to be quickly released into aqueous solutions, or become more bioavailable, which is because the pores of the HCSC600 microparticles allowed the hydrophobic drug to be well distributed via weak interactions. Besides these interesting findings, the work can inspire researchers to explore other possible morphologically- and structurally-controlled carbon nanomaterials using various naturally available materials as precursors for potential applications in nanomedicine.Acknowledgements
T. A. acknowledges the financial support of NSF (NSF DMR-0968937 and NSF NanoEHS-1134289).Notes and references
- G. Xu, S. Liu, H. Niu, W. Lv and R. Wu, RSC Adv., 2014, 4, 33986–33997 RSC.
- D. Saha, E. A. Payzant, A. S. Kumbhar and A. K. Naskar, ACS Appl. Mater. Interfaces, 2013, 5, 5868–5874 CAS.
- Y. Li, K. Liao and S. Lee, RSC Adv., 2014, 4, 56992–56997 RSC.
- S. Goenka, V. Sant and S. Sant, J. Controlled Release, 2014, 173, 75–88 CrossRef CAS PubMed.
- R. G. Mendes, A. Bachmatiuk, B. Büchner, G. Cuniberti and M. H. Rümmeli, J. Mater. Chem. B, 2013, 1, 401–428 RSC.
- J. Wang, Electroanalysis, 2005, 17, 7–14 CrossRef CAS.
- T. Kuila, S. Bose, P. Khanra, A. K. Mishra, N. H. Kim and J. H. Lee, Biosens. Bioelectron., 2011, 26, 4637–4648 CrossRef CAS PubMed.
- W. Xin and Y. Song, RSC Adv., 2015, 5, 83239–83285 RSC.
- J. L. Fiqueiredo, J. Mater. Chem. A, 2013, 1, 9351–9364 Search PubMed.
- R. Silva, J. Al-Sharab and T. Asefa, Angew. Chem., Int. Ed., 2012, 51, 7171–7175 CrossRef CAS PubMed.
- Y. Meng, D. Voiry, A. Goswami, X. Zou, X. Huang, M. Chhowalla, Z. Liu and T. Asefa, J. Am. Chem. Soc., 2014, 136, 13554–13557 CrossRef CAS PubMed.
- J. Lee, J. Kim and T. Hyeon, Adv. Mater., 2006, 18, 2073–2094 CrossRef CAS.
- (a) A. K. Shalek, J. T. Robinson, E. S. Karp, J. S. Lee, D.-R. Ahn, M.-H. Yoon, A. Sutton, M. Jorgolli, R. S. Gertner, T. S. Gujral, G. MacBeath, E. G. Yang and H. Parka, Proc. Natl. Acad. Sci. U. S. A., 2010, 107, 1870–1875 CrossRef CAS PubMed; (b) M. F. Serag, N. Kaji, S. Habuchi, A. Bianco and Y. Baba, RSC Adv., 2013, 3, 4856–4862 RSC; (c) K. B. Vinayakumar, G. M. Hegde, S. G. Ramachandra, M. M. Nayak, N. S. Dinesh and K. Rajanna, Biointerphases, 2015, 10, 021008 CrossRef PubMed; (d) J. A. Champion, Y. K. Katare and S. Mitragotri, J. Controlled Release, 2007, 121, 3–9 CrossRef CAS PubMed; (e) S. Y. Madani, N. Naderi, O. Dissanayake, A. Tan and A. M. Seifalian, Int. J. Nanomed., 2011, 6, 2963–2979 CAS; (f) D. Cai, J. M. Mataraza, Z. H. Qin, Z. Huang, J. Huang, T. C. Chiles, D. Carnahan, K. Kempa and Z. Ren, Nat. Methods, 2005, 2, 449–454 CrossRef CAS PubMed; (g) M. Bartneck, H. A. Keu, S. Singh, K. Czaja, J. Bornemann, M. Bockstaller, M. Moeller, G. Zwadlo-Klarwasse and J. Groll, ACS Nano, 2010, 4, 3073–3086 CrossRef CAS PubMed; (h) Y. Qiu, Y. Lu, L. Wang, L. Xu, R. Bai, Y. Ji, X. Wu, Y. Zhao, Y. Li and C. Chen, Biomaterials, 2010, 31, 7606–7619 CrossRef CAS PubMed; (i) N. Oh and J.-H. Park, Int. J. Nanomed., 2014, 9, 51–63 Search PubMed.
- (a) S. Venkataraman, J. L. Hedrick, Z. Y. Ong, C. Yang, P. L. Ee, P. T. Hammond and Y. Y. Yang, Adv. Drug Delivery Rev., 2011, 63, 1228–1246 CrossRef CAS PubMed; (b) F. Alexis, E. Pridgen, L. K. Molnar and O. C. Farokhzad, Mol. Pharm., 2008, 5, 505–515 CrossRef CAS PubMed; (c) S. Mitragotri, Pharm. Res., 2009, 26, 232–234 CrossRef CAS PubMed.
- (a) M. Gaumet, A. Vargas, R. Gurny and F. Delie, Eur. J. Pharm. Biopharm., 2008, 69, 1–9 CrossRef CAS PubMed; (b) N. P. Truong, M. R. Whittaker, C. W. Mak and T. P. Davis, Expert Opin. Drug Delivery, 2015, 12, 129–142 CrossRef CAS PubMed.
- T. Asefa and Z. Tao, Chem. Res. Toxicol., 2012, 25, 2265–2284 CrossRef CAS PubMed.
- M. Knez, M. P. Sumser, A. M. Bittner, C. Wege, H. Jeske, D. M. P. Hoffmann, K. Kuhnke and K. Kern, Langmuir, 2004, 20, 441–447 CrossRef CAS PubMed.
- R. S. Chouhan, J. H. Niazi and A. Qureshi, J. Mater. Chem. B, 2013, 1, 2724–2730 RSC.
- A. Diego-Taboada, S. T. Beckett, S. L. Atkin and G. Mackenzie, Pharmaceutics, 2014, 6, 80–96 CrossRef PubMed.
- (a) J. H. Park, I. S. Choi and S. H. Yang, Chem. Commun., 2015, 51, 5523–5525 RSC; (b) S. A. Konnova, A. A. Danilushkina, G. I. Fakhrullina, F. S. Akhatova, A. R. Badrutdinov and R. F. Fakhrullin, RSC Adv., 2015, 5, 13530–13537 RSC; (c) E. A. Naumenko, M. R. Dzamukova, G. I. Fakhrullina, F. S. Akhatova and R. F. Fakhrullin, Curr. Opin. Pharmacol., 2014, 18, 84–90 CrossRef CAS PubMed.
- (a) X. Huang, X. Zou, Y. Meng, E. Mikmeková, H. Chen, D. Voiry, A. Goswami, M. Chhowalla and T. Asefa, ACS Appl. Mater. Interfaces, 2015, 7, 1978–1986 CrossRef CAS PubMed; (b) A. C. Martins, X. Huang, A. Goswami, K. Koh, Y. Meng, V. C. Almeida and T. Asefa, Carbon, 2016, 102, 97–105 CrossRef CAS.
- F. J. Maldonado-Hódar, C. Moreno-Castilla, J. Rivera-Utrilla, Y. Hanzawa and Y. Yamada, Langmuir, 2000, 16, 4367–4373 CrossRef.
- S. A. Konnova, I. R. Sharipova, T. A. Demina, Y. N. Osin, D. R. Yarullina, O. N. Ilinskaya, Y. M. Lvov and R. F. Fakhrullin, Chem. Commun., 2013, 49, 4208–4210 RSC.
- D. Weinzierl, A. Lind and W. Kunz, Cryst. Growth Des., 2009, 9, 2318–2323 CAS.
- X. Niu, L. Wan, Z. Hou, T. Wang, C. Sun, J. Sun, P. Zhao, T. Jiang and S. Wang, Int. J. Pharm., 2013, 452, 382–389 CrossRef CAS PubMed.
- J. B. Dressman, E. Herbert, A. Wieber, G. Birk, C. Saal and D. Lubda, J. Pharm. Pharmacol., 2015 DOI:10.1111/jphp.12465.
- G. P. Sanganwar and R. B. Gupta, Int. J. Pharm., 2008, 360, 213–218 CrossRef CAS PubMed.
- L. M. Dwyer, V. K. Michaelis, M. O'Mahony, R. G. Griffin and A. S. Myerson, CrystEngComm, 2015, 17, 7922–7929 RSC.
- O. I. Parisi, M. Fiorillo, L. Scrivano, M. S. Sinicropi, V. Dolce, D. Iacopetta, F. Puoci and A. R. Cappello, Biomacromolecules, 2015, 16, 3126–3133 CrossRef CAS PubMed.
- M. Vogt, K. Kunath and J. B. Dressman, Eur. J. Pharm. Biopharm., 2008, 68, 283–288 CrossRef CAS PubMed.
- F. Tristán-López, A. Morelos-Gomez, S. M. Vega-Díaz, M. L. Garcia-Betancourt, N. Perea-Lopez, A. L. Elias, H. Muramatsu, R. Cruz-Silva, S. Tsuruoka and Y. A. Kim, ACS Nano, 2013, 7, 10788–10798 CrossRef PubMed.
- X. T. Zheng and C. M. Li, Mol. Pharmaceutics, 2012, 9, 615–621 CrossRef CAS PubMed.
- N. G. Sahoo, H. Bao, Y. Pan, M. Pal, M. Kakran, H. K. F. Cheng, L. Li and L. P. Tan, Chem. Commun., 2011, 47, 5235–5237 RSC.
Footnote |
| † Electronic supplementary information (ESI) available. See DOI: 10.1039/c6ra00308g |
| This journal is © The Royal Society of Chemistry 2016 |