Siddhartha Dea,
Juan-Ramón Jiméneza,
Yanling Lia,
Lise-Marie Chamoreaua,
Alexandrine Flambarda,
Yves Journauxa,
Azzedine Bousseksoub and
Rodrigue Lescouëzec*a
aInstitut Parisien de Chimie Moléculaire – CNRS UMR 8232, UPMC-Paris 6, Sorbonne Universités, F-75252, Paris cedex 05, France. E-mail: rodrigue.lescouezec@upmc.fr; Fax: +33 1 4427 3841; Tel: +33 1 4427 3075
bLaboratoire de Chimie de Coordination (LCC), UPR CNRS 8241, 205 route de Narbonne, F-31077 Toulouse, France
First published on 4th February 2016
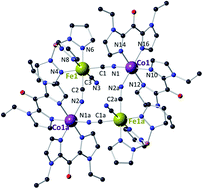
The reaction of [FeIII(Tp)(CN)3]− with [CoII(vbik)2(S)2]2+ leads selectively to the crystallization of cyanide-bridged diamagnetic {FeIILSCoIIILS}2 squares at 5 °C or paramagnetic {FeIIILSCoIIHS}2 ones at 35 °C. The diamagnetic crystal phase can be converted to a paramagnetic one upon heating and it shows photomagnetic effects at low temperature.
Compound 1 of formula {[Fe(Tp) (CN)3]2[Co(vbik)2]2}(BF4)2·2MeOH and compound 2 of formula {[Fe(Tp)(CN)3]2[Co(vbik)2]2}(BF4)2·10H2O·MeOH can be obtained selectively from the same methanolic solution containing the PPh4[FeIII(Tp)(CN)3] and [CoII(vbik)2(MeOH)2](BF4)2 complexes (Tp = tris(pyrazolyl)borate; vbik = bis(1-vinylimidazol-2-yl)ketone). When the methanolic solution is left at ca. 35 °C, 1 appears as red prismatic crystals in 2–3 days, while if the solution is left at 5 °C, green prismatic crystals of phase 2 appears in 6–7 days (ESI†). The striking colour difference between 1 and 2 can be ascribed to different oxidation state: 1 is paramagnetic and exhibits {FeIIILSCoIIHS} pairs whereas 2 exhibits {FeIILSCoIIILS} pairs at room temperature (vide supra).
Both compounds crystallize in the P space group and their structures are made of cyanide-bridged {Fe2Co2} square units (Fig. 1 and S1†), BF4− counterions and solvate molecules. 1 exhibits one crystallographically independent centrosymmetric {Fe2Co2} square unit whereas 2 exhibits two of these square units (further noted 2a and 2b). In all of them, two {Fe(Tp)(CN)3} motifs act as bis-monodentate ligand toward cis-coordinated {Co(vbik)2} units located at opposite corners of the squares. The third non coordinated cyanide of each {Fe(Tp)(CN)3} motif points in an opposite direction (trans), perpendicular to the {Fe2Co2} square plane. The Fe–Co square edges are slightly longer in 1 (ca. 5.1 Å) as compared to those observed in 2 (ca. 4.9 Å), reflecting the larger Co–N distances (ca. 2.1 Å in 1 and 1.9 Å in 2; see details in Table S2, ESI†). Indeed the Co–N distances observed in 1 are close to those observed in similar {FeIII2CoII2} square complexes and are typical for high spin Co(II) complexes.7a–c In contrast those measured in 2 are typical of low-spin Co(III) complexes.4b–c,7d–f The differences in the Fe-ligand distances are much lower but they are coherent with those previously observed in related {FeII/III(Tp)(CN)3}-based complexes. Typically Fe–C distances below 1.90 Å are observed in the {FeIII(Tp)(CN)3} moiety whereas they are above 1.90 Å for Fe(II).5,8 The distortion of the cobalt coordination spheres also account for the redox states observed in 1 and 2. The octahedral high-spin Co(II) surrounding in 1 is significantly more distorted as compared to the low-spin Co(III) one in 2 (Table S2, ESI†). Another noticeable difference between the square units in 1 and 2 arises from the bending of the cyanide–metal linkage on the N side which amount to ca. 162° in 1 and 173° in 2. The comparison of the geometry of the bidentate vbik ligands in the paramagnetic (1) and diamagnetic (2) phases allows to point out a remarkable flexibility which accompanied the change in the electronic states: whereas the ligand is quite planar in 1, it is significantly bent in 2 (Table S2 ESI†). This is reflected for example by (i) the dihedral angles between the imidazole rings, which is significantly smaller in 1 (ca. 9.75° and 11.10°) than in 2 (in the range 23.9–28.41°), (ii) the Co–C–O angle which is almost linear in 1 (ca. 177°) as the carbonyl lies almost in the same plane as the imidazole rings but which reaches 160° in 2 as the carbonyl is out of the plane of the imidazole rings (Table S2 ESI†). Finally significant structural differences are observed in the supramolecular organization of the squares in the two crystal lattices. In the paramagnetic sample (1) the square units are connected via H-bond to a methanol molecule, with N⋯O = 2.84 Å (Fig. S2 ESI†). No other weak intermolecular interaction (such as π–π or CH–π interactions) is found and the square units appear thus isolated from each other. In contrast in 2, all the squares (2a and 2b) are connected via the non-bridging cyanide to channels of H-bonded water molecules running along the a axis (Fig. S3 ESI†).
![]() | ||
Fig. 1 View of the cyanide-bridged {FeIII2CoII2} square unit in 1a. The hydrogen atoms are omitted for clarity. C-black, N-blue, O-red, Fe-olive, Co-orange. Symmetry code: 1 − x, 1 − y, 2 − z. |
The spectroscopic studies also support the redox state assignments deduced from the structural analysis. The cyanide stretching vibrations observed in FT-IR spectroscopy provide information on the bridging mode of the cyanide ligand and the redox states of the metal ions it links. Here typical cyanide stretching vibrations are observed at 2135 (FeIII–CN moieties involved in H-bond) and 2155 cm−1 (bridging FeIII–CN–CoII link) in 1 whereas characteristic bands at 2058 (non bridging FeII–CN), 2109 and 2126 cm−1 (FeII–CN–CoIII bridges) are observed in 2 (Fig. 2a).4b,c,6a A remarkable difference between the two IR spectra also occurs for the carbonyl vibration, which is shifted toward lower wavenumbers in 2 as the ligand planarity is lost and the aromaticity reduced (Fig. 3).
![]() | ||
Fig. 3 Graph of the χMT versus T plot of 1 (green) and 2 (red) measured at 2 K min−1 under H = 1 T, first upon heating (a, 2–400 K) then cooling (b, 400–2 K) and heating again (c, 2–400 K). |
The solid-state UV-vis absorption spectra of 1 and 2 exhibit intense intraligand transition in the UV region. More interestingly 2 exhibits a typical broad absorption band located around 750 nm, that can be ascribed to a FeII–CoIII intervalence charge transfer transition (IVCT, Fig. S4 ESI†).4e,5,9 In contrast 1 exhibits a shoulder at ca. 450 nm that could be due to a CoII–FeIII IVCT, as previously observed in similar systems (Fig. S4 ESI†).4e,6b The solution UV-vis spectra obtained at variable temperature on redissolved crystals of 1 and 2 or directly on the mother solution are all the same, indicating that in solution the same square complex is present. The spectra recorded at different temperatures in the accessible temperature range (−10 °C to 50 °C), show a significant increase of the broad absorption centred at 742 nm (IVCT band) and a decrease of the absorption between 400 and 500 nm as the temperature is decreased (Fig. 2b). An isobestic point is also observed at 532 nm. These features suggest the occurrence of a charge transfer equilibrium in solution between the diamagnetic and paramagnetic squares, as previously observed in another {Fe2Co2} square.4e,f The analysis of the temperature dependence of the intensity maximum at λ = 742 nm allows to estimate the spin-transition temperature in methanol solution, T1/2 ≈ 270 K, and the fraction of paramagnetic species at each temperature (Fig. S5 ESI†). From the fit of these data, the thermodynamic values associated with the charge-transfer equilibrium can be deduced: ΔH = 73 kJ mol−1 and ΔS = 273 J K−1 mol−1 (ESI†). These values compare well with those previously found in related FeCo squares.4e,f,10 The compound is completely paramagnetic in solution at 35 °C and the phase 1 thus slowly crystallizes in these conditions. Although the diamagnetic squares do not represent the major species in solution at 5 °C, a lower solubility of 2 likely accounts for the preferred crystallization of this crystal phase at 5 °C.
The magnetic properties of 1 and 2 were investigated in the 2.0–400 K range by measuring the thermal dependence of the χMT product (χM is the molar magnetic susceptibility per {Fe2Co2} unit). 1 is paramagnetic in the explored temperature range. The χMT value measured at 400 K, 7.8 cm3 mol−1 K, is in agreement with that previously measured in related {Fe2Co2} paramagnetic compounds and it lies in the expected range for four isolated ions: two LS Fe(III) and two HS Co(II) ions.11 The magnetic behavior of 1 was analyzed following the same approach as previously reported for similar cyanide-bridged {FeIII2CoII2} squares7c and reveal weak ferromagnetic interactions (ca. 5 to 7 cm−1) which do not compensate the effect of the spin–orbit coupling that induce the small decrease of the χMT product upon cooling (see Fig. S6 ESI†). In contrast with 1, compound 2 remains diamagnetic up to ca. 320 K, (χMT ≈ 0 cm3 mol−1 K) and it shows a strong increase of χMT between ca. 320 and 350 K, which is typical of an ETCST phenomenon. The χMT value measured at 400 K, ca. 6.1 cm3 mol−1 K, is somewhat lower than that observed in 1 and or other related cyanide-bridged {FeIII2CoII2} paramagnetic squares. It likely accounts for a quantitative but incomplete conversion of the diamagnetic pairs (FeIILS–CN–CoIIILS) into paramagnetic (FeIIILS–CN–CoIIHS) ones. This is also confirmed by the FT-IR spectrum of the heated sample which shows both cyanide vibration typical of Fe(II)–CN and Fe(III) moieties (Fig. S7 ESI†). Once heated in the SQUID magnetometer at 400 K, the compound remains in a paramagnetic state. The Mössbauer spectrum of a previously dried sample of 2 reveals that ca. 72% of the {FeCo} pairs undergo an ETCST (Fig. S8 ESI†). The irreversibility of the thermally-induced ETCST is likely associated with the loss of solvent molecules. Actually, magnetic measurements carried out on previously dehydrated samples lead to a similar χMT curve with a significant paramagnetic contribution (Fig. S9–S11 ESI†).
Finally, the photomagnetic properties of 2 were probed at 20 K in the visible and near-IR ranges using different laser-diodes (Fig. S12 ESI†). All the probed laser diodes lead to a noticeable increase of the magnetization, the most efficient one being observed at 808 nm. This behavior is reminiscent of that observed in a related square complex (containing similar ligands) in which a full electron transfer was confirmed by XRD structural analysis,5 However the measured photo-induced magnetization is significantly lower in the present case (with ca. χMT = 0.5 cm3 mol−1 K near 20 K) and would correspond to ca. 6% of conversion. The photo-induced metastable state is however stable up to ca. 60 K (Fig. S13 ESI†).
In this new cyanide-bridged {Fe2Co2} square molecule, the occurrence of a charge transfer equilibrium in solution near room temperature allowed to selectively drive the crystallization of the complex toward either a paramagnetic {FeIIILSCoIIHS} (1) phase (above room temperature) or a diamagnetic {FeIILSCoIIILS} (2) one (below room temperature). In contrast with the solution behaviour, the reversible electron transfer phenomenon is lost in the solid-state in the phase 1, which is stabilized in its paramagnetic state. On the contrary 2 remains diamagnetic up to 320 K. It can nevertheless be converted in a paramagnetic phase but the transition is irreversible in the solid state as crystallization solvent molecules are lost upon heating. Overall these results show how critical is the role of the intermolecular interactions on the occurrence of the ETCST phenomenon, and thus how difficult could be the prediction of the electronic state of these {FeCo} charge transfer molecules in the solid state. However these switchable FeCo squares complexes still represent interesting model compounds and we are currently investigating a broader family through joint theoretical–experimental investigation in order to investigate more deeply the role of solid-state interactions on the ETCST process.
Footnote |
† Electronic supplementary information (ESI) available. CCDC 1433794 and 1433795. For ESI and crystallographic data in CIF or other electronic format see DOI: 10.1039/c6ra00191b |
This journal is © The Royal Society of Chemistry 2016 |