Alkaline etching treatment of PVDF membrane for water filtration

Nurul Alwani Samsurea, N. Awanis Hashim*a, Nik Meriam Nik Sulaimana and Ching Yern Cheeb
aDepartment of Chemical Engineering, Faculty of Engineering, University Malaya, 50603 Kuala Lumpur, Malaysia. E-mail: awanis@um.edu.my; Fax: +60-03-79675319; Tel: +60-03-79676892
bDepartment of Mechanical Engineering, Faculty of Engineering, University Malaya, 50603 Kuala Lumpur, Malaysia

Received 4th January 2016 , Accepted 12th February 2016

First published on 12th February 2016


Abstract

The exposure of poly(vinylidene fluoride) (PVDF) membranes to alkaline solutions is known to have a deterioration effect on the mechanical and thermal stability of the membranes. On the positive side, this leads to extensive pore formation via the etching process. Previous studies conducted on the etching process involved the use of high chemical concentrations and temperatures which could degrade the membrane, as well as the use of hazardous chemicals. Therefore, in this work a mild potassium hydroxide (KOH) solution was used as a mild chemical agent. A PVDF membrane incorporating silicon dioxide (SiO2) was prepared by an immersion precipitation method. The etching treatment was conducted using mild KOH solution. Upon exposing the silicon dioxide filled membrane to both 0.01 M and 0.2 M concentrations of KOH, membrane pores were introduced without any sign of dehydrofluorination observed on the membrane. The 0.01 M and 0.2 M KOH treatments resulted in PVDF membranes with increased water permeability up to 291.20 L m−2 h−1 and 387.39 L m−2 h−1, respectively. EDX analysis indicates that the SiO2 particles were dissolved more efficiently under treatment with 0.2 M KOH for 30 min compared to the treatment with 0.01 M KOH. The results also showed that the surface roughness decreased, whereas the pure water flux and Bovine Serum Albumin (BSA) rejection increased after the etching treatment with mild KOH. The mechanical properties of the treated membrane remained unchanged throughout the experimental procedure.

Introduction

By 2050, the global water demand for manufacturing processes is forecast to increase by a staggering amount, up to 406%.1 This high increase is attributed to the lack of resource availability which is a serious concern with regards to global water stress. Based on the fact that depending on the industry, water is used as either the raw material and/or the final product has further aggravated the current situation. Membrane technology is already a proven technology used in many industrial processes which has seen rapid progress from research topic to established industrial technology. It may be that the seamless integration of membrane technology along with conventional operations is largely due to its flexibility, simplicity, and ease of operation with minimal cost. Due to these advantages, the application of membrane technology spans several industrial applications, including food and beverages, wastewater treatment, biotechnology and pharmaceuticals. At the heart of membrane-based water treatment processes is the membrane itself, as it determines the efficiency and economic aspects. One of the most popular materials for membrane fabrication is poly(vinylidene fluoride) (PVDF). PVDF is a naturally hydrophobic polymer material that has been widely used to produce ideal membranes for various industrial applications. Most research and development projects prefers to work with a PVDF membrane due to its superior mechanical strength, thermal stability, and chemical resistance towards acids, alkalis, halogens and oxidants.2

The alkali-resistant nature of PVDF as a membrane material is certainly an attractive feature for the treatment of alkaline wastewater which is originally sourced from textiles, dairy and oily wastewater. Recent research has shown an increased interest in the effects of alkaline solutions on PVDF membranes. It has been reported that alkaline conditions could have effects in terms of a decline in the mechanical and thermal stability of the PVDF membrane, the pore size distribution and membrane hydrophilicity as well as causing membrane surface degradation and structural modifications. However, it is also believed that exposing the PVDF membrane to alkaline media would lead to pore formation. Previously, several chemical etching studies have been done using sodium hydroxide (NaOH),3,4 hydrofluoric acid (HF),4 UV light-induced oxidation5 and permanganate solution.6 Interestingly, most of the previous chemical etching process studies suggest that the involvement of high concentrations and temperatures would cause further membrane degradation. In addition, the use of chemicals such as hydrofluoric acid is hazardous due to its physical, chemical and toxicological properties. Furthermore, exposing the membrane to alkaline media could also induce porosity in the membrane without affecting the membrane performance.

In this work, we report the effect of potassium hydroxide (KOH) as a chemical for the etching process to form a porous membrane. In this work, KOH will be employed as a substitute for HF in the etching process to induce porosity and improve the performance of PVDF membranes. KOH has been widely used to etch silicon wafers in the semiconductor industry.7 A special focus has been placed on the effect of potassium hydroxide (KOH) solution in inducing membrane pores in the lowest concentration possible without affecting the stability and performance of the PVDF membrane.8 An investigation on the effect of chemical etching towards additive and membrane degradation is also presented in this paper. Finally, the effect of etching using KOH on membrane permeability, surface roughness, morphology and mechanical properties were investigated in detail. We believe that this is the first work that shows the effect of chemical etching of the membrane on dye rejection.

Experimental

Materials

PVDF (Kynar 761A) was obtained from Arkema Singapore. Dimethylsulfoxide (DMSO, ≥99.6%, reagent grade), bovine serum albumine (BSA, A7906) (Mw = 60[thin space (1/6-em)]000) and silicon dioxide particles (SiO2, 10–20 nm particle size (BET)) were purchased from Sigma Aldrich, France. Potassium hydroxide (KOH) was purchased from R&M Chemicals. Ultra-pure water from a water purification system (Milli-Q, Millipore Corporation, USA) was used in all of our experiments for polymer precipitation and pure water flux measurements. Reactive Red 194 (Mw = 984.21) and Reactive Blue (Mw = 1282.96) were obtained from TMS Art Company (KL, Malaysia).

Preparation of the membrane

Silicon dioxide, SiO2 (5 wt%) was added to DMSO and an ultrasonicator were used to further disperse it for 1 hour. PVDF (15 wt%) was added, and the solution was kept well stirred for 24 hours at 70 °C to ensure complete dissolution of the polymer. Then, the mixture was left in a vacuum oven at 70 °C to remove any bubbles that were formed during the dissolution process. After being cooled to room temperature, the polymer dope was then cast onto a 300 μm thick glass plate. After a 30 second exposure to air, the cast film was then immersed into a coagulation bath containing ultrapure water (Milli-Q) for 24 hours. The membranes were rinsed to remove all of the residual solvent and preserved in 40% v/v glycerol prior to characterization.

Membrane etching treatment

The etching treatment was applied to the prepared membranes using 0.01 M and 0.2 M concentrations of KOH at 25 °C with 30, 60 and 90 min treatment times. The concentrations of KOH were chosen based on the lowest concentration that has been studied for real applications of the etching process.7

Characterisation and instruments

The microstructure of the silicon dioxide particles for both the top surface and cross-section of the prepared membranes was observed using Field Emission Scanning Electron Microscopy (FE-SEM, Auriga, Zeiss Microscopy, North America). The dry membranes were freeze fractured to obtain the cross section membrane samples. All the dried membrane specimens were sputter-coated with a layer of gold under vacuum for 30 seconds. The images were then photographed at a range of magnifications. Capillary flow porometry (Porolux 1000, Belgium) was used to measure the pore size distribution for the membrane. The membrane was cut to 2 cm diameter and submerged in porefil (surface tension of 16 dynes cm−1) for about 4 min. Nitrogen gas was applied under pressure with a maximum flow rate of 200 mL min−1 to start the sample analysis. This step is crucial as it measures the pressure needed to blow inert gas through the liquid-filled membrane using the Young–Laplace equation.9 Surface roughness analysis of the treated membranes was carried out using Atomic Force Microscopy (Bioscope Catalyst Atomic Force Microscopy, Bruker Corporation, USA). Tapping mode was utilized in this study by using a silicon nitride cantilever. Approximately 1 cm2 of the prepared membranes was sliced and placed on the sample holder for the analysis (10 μm × 10 μm). A dead-end stirred cell filtration system (effective area of 15.91 cm2) with a N2 gas cylinder was used to examine the membrane permeation flux. The membrane was compressed at 1 bar for the first 30 min to acquire a steady flux. Then, a minimum of 5 readings were taken at 5 min intervals to obtain an average value. The process was then repeated with a 0.1 g L−1 BSA solution in PBS (pH = 7.4), 50 mg L−1 Reactive Red and 50 mg L−1 Reactive Blue. All the filtration processes were conducted at 25 °C ± 0.5 °C. The concentrations of BSA in the feed and permeation solution were quantified by a UV-spectrophotometer (Perkin Elmer, USA). The following equations were used to define the permeation flux and rejection:
 
image file: c6ra00124f-t1.tif(1)
 
image file: c6ra00124f-t2.tif(2)
where J is the permeation flux of the membrane for pure water (L m−2 h−1), Q is the volume of permeate pure water (L), A is the effective area of the membrane (m2), T is the permeation time (h), R is the rejection of BSA (%), and CF and CP are the concentrations of BSA in the feed and permeation solution, respectively. DataPhysics OCA-15 plus (DataPhysics, U.S.A.) was used to measure the static contact angle of the membrane. The samples were dried at room temperature for 6 hours before measurements were made. Five different spots were measured to obtain a final contact angle value with a standard deviation of less than 5%. The mechanical strength of the membrane, such as tensile stress and elongation at break were measured using an Instron 4466 tensile testing machine (Instron, U.S.A). The tests were carried out according to ASTM D882 standards. Both membrane (1 cm × 10 cm) ends were fastened and pulled at a strain rate of 50 mm min−1 at room temperature (25 °C ± 2). Five sets of measurements were conducted with a standard deviation of less than 5%. A spectral range of 550 to 4000 cm−1 was used to measure the changes in chemical composition of the membranes. The changes were observed by Fourier Transform Infrared Attenuated Total Reflectance (FTIR-ATR) (Nicolet iS10 Thermo Scientific, USA).

Results and discussion

The top and cross-sectional FESEM images of the prepared and treated membranes were examined thoroughly in this part. Fig. 1(a)–(c), shows the FESEM images of the initial and resultant membrane after surface etching treatment with 0.01 M and 0.2 M KOH solution. As observed from Fig. 1(a), the surface is finely porous which indicates that the SiO2 particles were well dispersed with no aggregation found. However, upon etching treatment with 0.01 M and 0.2 M KOH, significant pores were found on the membrane surface as presented in Fig. 1(b) and (c) which led to uneven membrane surfaces. Fig. 1(d) shows that the membrane exhibits an asymmetric structure which is composed of a uniformly distributed finger-like structure at the inner layer with an approximate size of 18.9 μm. It is interesting to note that the overall structure remains unchanged even after the etching treatment. The significant change in porosity was proven by the pore-size distribution analysis provided in Fig. 1e. Here it can be observed that the pores are smaller than before the treatment.
image file: c6ra00124f-f1.tif
Fig. 1 Morphologies of the top surface (a) original membrane, (b) 0.01 M KOH treatment, (c) 0.2 M KOH treatment and (d) cross-section of the original membrane. (e) Pore size distribution of the silica filled PVDF membrane before and after 0.2 M KOH etching treatment.

The percentage of flux multiplication for the membrane with different treatment times is shown in Fig. 2. Only a small discrepancy in flux increments was detected for both KOH concentrations. By extending the duration of the membrane treatment to 90 min under ambient conditions, the flux percentage increments were moderately increased. For the 0.01 M KOH treatment, the membrane exhibits an increase in flux by 52.2%, 57.21% and 61.25% for treatment times of 30, 60 and 90 min, respectively. Similarly, an increase in flux was also found for the membrane treated with 0.2 M KOH. This finding could be a highly significant one, as it shows that there is a possibility that the silicon dioxide could start to leach out even at considerably low KOH concentration. Further investigation of this phenomenon in later part of this article was conducted using EDX analysis to trace the elemental components of the membrane. During the phase inversion process, the interconnecting porous structure of the membrane is formed after the crystal growth is suppressed. After the completion of membrane formation, the removal of the additives could result in the development of an interconnecting porous membrane structure with improved pure water flux.


image file: c6ra00124f-f2.tif
Fig. 2 Effect of mild KOH treatment time on the flux increment.

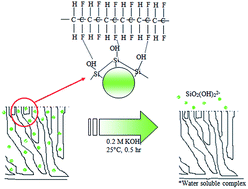
Fig. 3 shows a graphical representation of silica treatment with mild KOH solution. During the etching treatment using mild KOH, SiO2 particles were attacked by hydroxide ions which then will dissolve the oxide to form a silicic acid that is soluble in water.10 The simplified reaction is shown as follows:

 
SiO2 + 2OH → [SiO2(OH)2]2− (3)


image file: c6ra00124f-f3.tif
Fig. 3 Graphical representation of silica removal upon treatment with mild KOH solution.

It was observed that the membrane colour started to change upon exposure to mild KOH solution. Fig. 4 shows the physical observation of the membrane colour changes after etching treatment with 0.2 M KOH solution. This is important in order to identify the lowest concentration of mild KOH treatment which could instigate a degree of dehydrofluorination of the PVDF membrane. It was observed that the membrane colour slightly changed to light orange at 30 min of 0.2 M KOH etching treatment. Longer etching treatment times could definitely increase the membrane flux (as previously depicted in Fig. 2). However, the observed colour changes could be due to dehydrofluorination of the PVDF membrane.


image file: c6ra00124f-f4.tif
Fig. 4 Membrane colour changes upon exposure to 0.2 M KOH at (a) 0 minute, (b) 30 minutes, (c) 60 minutes and (d) 90 minutes.

Additionally, FTIR analysis was carried out to examine the chemical composition of the membrane surface. A crucial emergence of FTIR peaks attributed to different crystalline forms of PVDF and its functional groups were observed at 875, 1070, and 1427 cm−1 which refers to an α phase of PVDF, whilst the other peaks found at 840, 1171, 1273, and 1400 cm−1 are attributed by the β phase of PVDF.11,12 Fig. 5(c) shows the intensity of the characteristic asymmetric Si–O–Si stretching bands at 1080 cm−1 (ref. 13) decreasing for the membranes treated with 0.01 M KOH. This particular band completely disappeared after etching treatment with 0.2 M KOH solution as depicted in Fig. 5(d), and finally displayed an identical spectrum to the pure PVDF membrane in Fig. 5(e). The treatment of both membranes was conducted for 30 min.


image file: c6ra00124f-f5.tif
Fig. 5 FTIR spectra of (a) SiO2 powder; (b) PVDF membrane containing SiO2 particles; (c) 0.01 M KOH treated membrane; (d) 0.2 M KOH treated membrane and (e) pure PVDF membrane.

Additionally, it is important to identify whether the mild alkaline etching treatment would have an effect on the chemical composition, particularly for PVDF membranes in which it may lead to dehydrofluorination. Many studies have been conducted to observe the effect of chemical exposure on PVDF membranes, including membrane cleaning, aging and stability aspects.8,14,15 From previous studies, the significant appearance of dehydrofluorination of the PVDF membrane was demonstrated by the existence of peaks in the ranges of 1590 to 1650 cm−1, 1700 to 1800 cm−1 and 2100 cm−1 which refer to carbon–carbon double bonds, carbonyl bonds and carbon–carbon triple bonds, respectively.12 The FTIR spectra between 1400 and 2100 cm−1 of the membranes treated with 0.01 M KOH and 0.2 M KOH solutions are presented in Fig. 5. An identical spectrum can be observed for the virgin membrane and the membranes treated with 0.01 M and 0.2 M KOH solution. This shows that during the etching treatment with 0.2 M KOH concentration, the SiO2 particles were removed from the membranes without affecting the chemical nature of the PVDF membrane. Dehydrofluorination might occur in the inner layer of the membrane since FTIR is less sensitive where the analysis was run on the surface layer of the membrane.

EDX mapping analysis was conducted to further scrutinize the leaching phenomenon of the SiO2 particles after the etching treatment. Fig. 6(a)–(c) shows the (Si and O) elemental mapping of the virgin membrane, 0.01 M KOH treated membrane and 0.2 M KOH treated membrane, respectively. It was shown that the presence of Si (green dots) starts to decrease at 0.01 M KOH concentration (see Fig. 6(b)). It might be suggested that the SiO2 particles have been extracted by the KOH and partially washed out from the membrane. It is also worth mentioning that this significant finding revealed that the SiO2 particles were leached out at relatively low KOH concentration. More significantly, with the etching treatment at 0.2 M KOH concentration, the SiO2 particles have been observed to be completely washed out from the membrane surface as depicted in Fig. 6(c). Therefore, it is believed that the hydroxide ions have efficiently attacked the SiO2 on the membrane surface and hence contributed to the porous structure of the membrane. Thus, it might be suggested that the EDS mapping outcomes (as in Fig. 6(c)) are in good agreement with the FTIR result in Fig. 6(d) which suggests that 0.2 M KOH solution could remove the SiO2 particles from the membrane.


image file: c6ra00124f-f6.tif
Fig. 6 Silicon dioxide distributions on the membrane surface before (a) and after etching treatment with (b) 0.01 M KOH and (c) 0.2 M KOH. The green and red colour particles refer to the Si and O elements, respectively.

The effect of etching treatments was observed by the changes in pure water flux, protein rejection and membrane surface area. According to Table 1, it was observed that after the membranes were treated for 30 min, a small variation of escalating flux was found. The soaring flux percentage slightly increased upon 0.2 M KOH etching treatment at room temperature. More significantly, the membranes immersed in 0.01 M KOH and 0.2 M KOH solutions displayed flux values which were increased by 52.20% and 76.47%, respectively. The results clearly show that hydroxide ions attack and dissolve the oxides which form a doubly protonated form of silicic acid. A possible explanation for the relatively high pure water flux after the mild KOH etching treatment might be the porous structures of the membranes resulting from the removal of SiO2 particles. The increase in membrane surface area indicates the induction of membrane porosity resulting from the KOH treatment.

Table 1 Pure water flux, membrane surface area, static contact angle, protein rejection, roughness and percentage SiO2 removal during mild KOH etching treatment with a 30 min treatment time
Alkaline etching treatment Pure water flux, L m−2 h−1 Membrane surface area, m2 g−1 Static contact angle (°) SiO2 removal, % Protein rejection, % Surface roughness (nm)
Virgin membrane 191.24 ± 1.9 5.628 71.69 ± 2.1 30.88 165
0.01 M 291.20 ± 1.3 9.513 67.85 ± 1.8 66.67 36.83 53.1
0.2 M 387.39 ± 1.5 11.769 55.80 ± 1.7 100.00 46.23 37.8


The membrane’s protein rejection value was also found to be increased when compared to the virgin membrane with values of 36.83% and 46.23% after treatment with 0.01 M KOH and 0.2 M KOH solution, respectively. The significant changes observed in the protein rejection value after SiO2 removal suggests that there is no pore enlargement from the 0.2 M KOH etching treatment. Levitsky suggested that the increase in separation of protein and water permeability is governed by membrane hydrophilicity.16 However, based on our current research, it might be suggested that the changes in protein separation which induced fouling are actually dominated by the protein adsorption itself rather than size exclusion. Analysis of the static contact angle was conducted to further prove the Levitsky statement. The reduction in static contact angle value shows an improvement in membrane surface hydrophilicity due to the induction of top membrane porosity.17–19

Fig. 7 shows the AFM images of the surface properties of the treated membrane. These images show the effect of the etching treatment on the membrane surface roughness. The mean roughness parameter Ra obtained from the AFM images showed 165 nm, 53.1 nm and 37.8 nm for the original membrane, and the membrane exposed to 0.01 M and 0.2 M KOH solution, respectively. It can be observed that the mean roughness of the treated membranes tends to decrease upon exposure to KOH solution. This finding is in good agreement with the observation in Fig. 6, whereby the SiO2 particles were removed upon exposure to KOH solution. These findings are in line with previous work by Hashim et al. where the absence of an inorganic additive at the top of the membrane will promote a lower degree surface of roughness.20


image file: c6ra00124f-f7.tif
Fig. 7 AFM images of the membranes upon removal from the etching treatment at 30 minute: (a) virgin membrane, (b) 0.01 M KOH etching treatment, and (c) 0.2 M KOH etching treatment.

Fig. 8 shows a diagram of the continuous filtration of dyes and BSA solutions for the three membranes. Referring to Fig. 8, the water flux alleviation of the original membrane was found to be the most intense which indicated that it was easily fouled. The rougher nature of the original membrane surface is more favourable for the attachment of foulants to the membrane surface (see data in Table 1). The fouling speeds improved considerably after treatment with 0.01 M KOH and 0.2 M KOH compared to the original membrane. The flux of the 0.2 M KOH treated membrane was found to result in a slightly higher water flux recovery than the original membrane. This finding is significant for the production process because all the modified membranes had a substantial water production rate.


image file: c6ra00124f-f8.tif
Fig. 8 Flux of the modified membrane using Reactive Red dye, Reactive Blue dye and BSA solutions.

The mechanical stability of the PVDF membranes was evaluated by tensile stress and elongation at break to further monitor the alteration in mechanical properties upon exposure to mild alkaline solution. A descending trend for tensile stress in the order of untreated, 0.01 M KOH and 0.2 M KOH treated membranes was observed from Fig. 9. This might be due to the removal of the additive, resulting in a more porous membrane. In addition, the elongation of the treated membrane escalated from approximately 41.65% to 63.1% after being subjected to 0.01 M KOH and 0.2 M KOH solutions, respectively. It can be said that these finding are in-line with previous work done by Hashim et al., in 2011. The mechanical properties of the membrane from which the additive has been removed were found to include an increased value of elongation.12 Thus, this study gives a clear insight into how better ductile membrane behaviour could be obtained in a single PVDF polymeric phase membrane compared to a rigid composite phase membrane.


image file: c6ra00124f-f9.tif
Fig. 9 Effect of mild KOH etching treatment towards the mechanical strength of the membrane at 30 min.

Conclusion

In this study, PVDF membranes were prepared via an immersion precipitation process using SiO2 particles as an additive. Etching treatments were successfully conducted using KOH solutions with concentrations of 0.01 M and 0.2 M. The SiO2 particles were completely removed from the PVDF membrane during etching treatment with 0.2 M KOH at room temperature for a treatment time of 30 min. No sign of dehydrofluorination was found on the membranes treated with 0.01 M and 0.2 M KOH. The surface roughness of the membrane decreased after the mild alkaline etching treatment. Furthermore, the mild alkaline etching treatment has resulted in increased values of water permeability for both the 0.01 M and 0.2 M KOH treated membranes of 291.20 L m−2 h−1 and 387.39 L m−2 h−1, respectively, and an increase in BSA rejection from 30.88% to 46.23%. The mechanical properties of the treated membrane remained unaffected and showed better ductility than the virgin membrane. The results suggested that KOH can be a good substitute for HF in the etching process to produce PVDF membranes with higher porosity and better performance.

Acknowledgements

The authors gratefully acknowledge the research funding provided by Fundamental Research Grant Scheme (Grant No.: FP050-2013B), University of Malaya Program Rakan Penyelidikan (Grant No.: CG004-2013) and University Malaya postgraduate research grant (Grant No.: PG061-2013A).

Notes and references

  1. A. Gurria, OECD Environmental Outlook to 2050, OECD Publishing, 2012 Search PubMed.
  2. F. Liu, N. A. Hashim, Y. Liu, M. R. M. Abed and K. Li, J. Membr. Sci., 2011, 375, 1–27 CrossRef CAS.
  3. Y. Komaki, N. Ishikawa, N. Morishita and S. Takamura, Radiat. Meas., 1996, 26, 123–129 CrossRef CAS.
  4. N. A. Hashim, Y. T. Liu and K. Li, Ind. Eng. Chem. Res., 2011, 50, 3035–3040 CrossRef CAS.
  5. S. P. Koenig, L. D. Wang, J. Pellegrino and J. S. Bunch, Nat. Nanotechnol., 2012, 7, 728–732 CrossRef CAS PubMed.
  6. A. Grasselli and N. Betz, Nucl. Instrum. Methods Phys. Res., Sect. B, 2005, 236, 501–507 CrossRef.
  7. U. Gösele and Q.-Y. Tong, in SemiConductor Wafer Bonding: Science and Technology, John Wiley, New York, 1998, p. 320 Search PubMed.
  8. M. F. Rabuni, N. M. Nik Sulaiman, M. K. Aroua and N. A. Hashim, Ind. Eng. Chem. Res., 2013, 52, 15874–15882 CrossRef CAS.
  9. S. Kaur, Z. Ma, R. Gopal, G. Singh, S. Ramakrishna and T. Matsuura, Langmuir, 2007, 23, 13085–13092 CrossRef CAS PubMed.
  10. M. J. Sailor, in Porous Silicon in Practice, Wiley-VCH Verlag GmbH & Co. KGaA, 2011, pp. 1–42,  DOI:10.1002/9783527641901.ch1.
  11. R. Gregorio, J. Appl. Polym. Sci., 2006, 100, 3272–3279 CrossRef CAS.
  12. N. A. Hashim, Y. Liu and K. Li, Ind. Eng. Chem. Res., 2011, 50, 3035–3040 CrossRef CAS.
  13. L. Y. Yu, Z. L. Xu, H. M. Shen and H. Yang, J. Membr. Sci., 2009, 337, 257–265 CrossRef CAS.
  14. N. Awanis Hashim, Y. Liu and K. Li, Chem. Eng. Sci., 2011, 66, 1565–1575 CrossRef CAS.
  15. V. Puspitasari, A. Granville, P. Le-Clech and V. Chen, Sep. Purif. Technol., 2010, 72, 301–308 CrossRef CAS.
  16. I. Levitsky, A. Duek, E. Arkhangelsky, D. Pinchev, T. Kadoshian, H. Shetrit, R. Naim and V. Gitis, J. Membr. Sci., 2011, 377, 206–213 CrossRef CAS.
  17. S. Kaur, D. Rana, T. Matsuura, S. Sundarrajan and S. Ramakrishna, J. Membr. Sci., 2012, 390–391, 235–242 CrossRef CAS.
  18. S. Kaur, S. Sundarrajan, D. Rana, T. Matsuura and S. Ramakrishna, J. Membr. Sci., 2012, 392–393, 101–111 CrossRef CAS.
  19. S. A. A. N. Nasreen, S. Sundarrajan, S. A. Syed Nizar, R. Balamurugan and S. Ramakrishna, Polym. J., 2014, 46, 167–174 CrossRef CAS.
  20. N. A. Hashim, F. Liu and K. Li, J. Membr. Sci., 2009, 345, 134–141 CrossRef CAS.

This journal is © The Royal Society of Chemistry 2016
Click here to see how this site uses Cookies. View our privacy policy here.