Experimental (FT-IR and FT-Raman) and spectroscopic investigations, electronic properties and conformational analysis by PES scan on 2-methoxy-5-nitrophenol and 2-methoxy-4-methylphenol†
R. Meenakshi*
Department of Physics, Cauvery College for Women, Tiruchirappalli – 620 018, TN, India. E-mail: lr.santhameena@gmail.com
First published on 9th February 2016
Abstract
A complete vibrational and molecular structure analysis is performed based on the quantum mechanical approach by HF and DFT calculations. On the basis of the calculated and experimental results the assignments of the fundamental frequencies are examined. The available experimental results are compared with the theoretical data. A low value of HOMO LUMO energy gap suggests the possibility of intramolecular charge transfer in the molecule. This plays an important role in the significant increase of the β value, which is a property to exhibit nonlinear optical (NLO) activity. The NBO result reflects the charge transfer mainly due to lone pairs. Theoretical 1H and 13C chemical shift values (with respect to TMS) are reported and compared with experimental data which shows the agreement for both 1H and 13C. Predicted electronic absorption spectra from TD-DFT calculations are analysed and they are mainly derived from the contribution of the π → π* band. The predicted NLO properties are much greater than those of urea.
1. Introduction
Phenol derivatives are motivating molecules for theoretical studies due to their relatively small size and similarity to biological species. Unlike normal alcohols, phenols are acidic because of the influence of the aromatic ring. The free phenol is liberated by adding sulphuric acid. It is used as anti-bacterial and anti-septic and also for the treatment of surgical instruments and bandaging materials.1 Various spectroscopic studies of chloro and methyl phenols have been reported in the literature.2–4 Sing et al. have studied the infrared and the electronic absorption spectra of 4-chloro-2-methyl, 4-chloro-3-methyl and 6-chloro-3-methyl phenols. The vibrational spectra of p-cresol and its deuterated derivatives have been studied by Jakobsen,5 who gave detailed interpretations of the vibrational bands. The assignment of the vibrational frequencies for substituted phenols is complicated because of the superposition of several vibrations due to fundamentals and substituents. However, a comparison of the spectra with that of the parent compound gives some definite clues about the nature of the molecular vibrations. The Raman spectra of this compound and its three deuterated derivatives in the liquid state and the infrared spectra in the liquid, vapour and solid state have been reported partially by Jakobsen,5 the vibrational spectra of p-nitrophenol in the region 300–1600 cm−1 were studied by Jakobsen and Brewer.6 Kishore et al.7 recorded the infrared absorption spectra of o-, m- and p-nitrophenols in the region 200–4000 cm−1 using the KBr pellet technique.In conjunction with the development of technology, among the computational methods for calculating the structure of molecular systems, DFT has been a favourite due to its great accuracy in reproducing the experimental values of molecular geometry, vibrational frequencies, atomic charges, dipole moment, etc.
By considering the above mentioned points this study deals the molecular geometry, optimized parameters and vibrational frequencies of 2-methoxy-5-nitrophenol (MNP) and 2-methoxy-4-methylphenol (MMP) and the performance of the computational methods (HF and B3LYP) at the 6-31G (d,p) basis set.
2. Experimental details
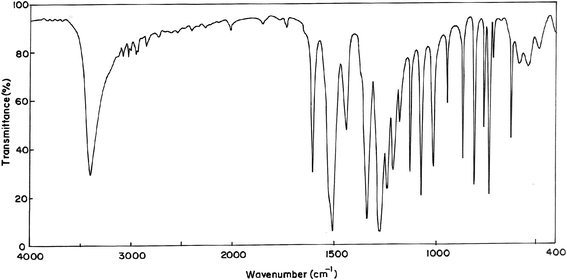
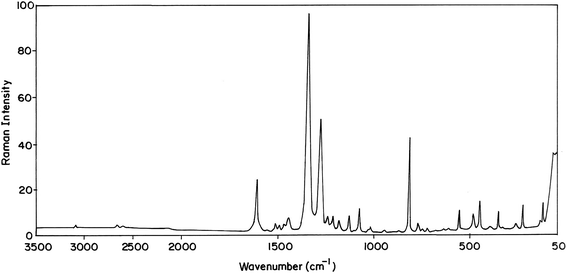
The compounds under investigation namely 2-methoxy-5-nitrophenol (MNP) and 2-methoxy-4-methylphenol (MMP) are purchased from Sigma-Aldrich chemicals, USA which is of spectroscopic grade and hence used for recording the spectra as such without any further purification. The FT-IR spectrum is recorded using a Bruker IFS 66V spectrometer in the range of 4000–400 cm−1. The spectral resolution is ±2 cm−1. The FT-Raman spectrum was also recorded with the same instrument with a FRA 106 Raman module equipped with a Nd:YAG laser source operating at 1064 nm excitation wavelengths, line widths with 200 mW power in the range of 3500–50 cm−1 with scanning speed of 30 cm−1 min−1 of spectral width 2 cm−1. The frequencies of all sharp bands are accurate to ±1 cm−1.3. Theoretical methods
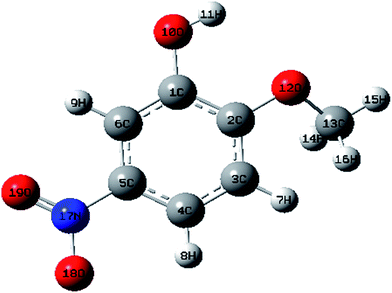
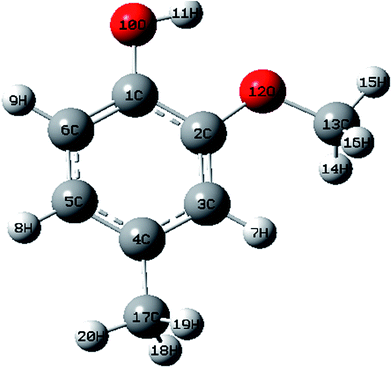
The optimized structures of MNP and MMP in the ground state (Fig. 1 and 2) are computed by performing both ab initio/HF and DFT/B3LYP with the 6-31G (d,p) basis set with the Gaussian 09W software package8 and Gauss view visualization program.9 The optimized structural parameters are used in the vibrational frequency calculations in HF and DFT methods. The total energy distribution (TED) corresponding to each of the observed frequencies is calculated using the MOLVIB program10 and it shows the reliability and accuracy of the spectral analysis. The isotropic chemical shifts are frequently used as an aid for the identification of organic compounds. The GIAO method is one of the most common approaches for calculating nuclear magnetic shielding tensors. The 13C and 1H NMR isotropic shielding were calculated with the GIAO method using the optimized parameters obtained from B3LYP/6-31G(d,p) method. UV-vis spectra, electronic transitions, vertical excitation energies, absorbance and oscillator strengths were computed with the time-dependent DFT method. The electronic properties such as HOMO and LUMO energies were determined by time-dependent DFT approach.The natural bonding orbital (NBO) calculations were performed in order to understand various second order interactions between the filled and vacant orbitals of the system, which is a measure of the intermolecular and intramolecular delocalization or hyper conjugation. Next, first hyperpolarizabilities of the title compounds were obtained based on theoretical calculations.
4. Results and discussion
4.1. Structural analysis and potential energy surface scan
The optimized structural parameters such as bond lengths and bond angles of the title compounds are determined at the above mentioned level of theory. The optimized parameters are collected in Tables S1 and S2† in accordance with the atom numbering scheme shown in Fig. 1 and 2.According to the calculated values, the order of the optimized bond lengths of the six C–C bonds of the ring as C5–C6 < C3–C4 < C1–C6 < C4–C5 < C2–C3 < C1–C2 in MNP and as C2–C3 < C4–C5 < C1–C6 < C5–C6 < C3–C4 < C1–C2 in MMP. From the order of the bond lengths, it is clear that the phenyl ring appears a little distorted from the perfect hexagonal structure. It is due to the substitutions of the OH, NO2, O–CH3 and CH3 groups in the place of H atoms. It is also evident that the bond lengths of C5–C6, C1–C2 and C3–C4 (1.3893, 1.4152 and 1.3955 Å cal by B3LYP) are more extended than the bond lengths C1–C6, C4–C5 and C2–C3 (1.3822, 1.3877 and 1.3889 Å). A similar effect is also observed as mentioned above in calculated bond lengths by the HF method. The bond length O10–H11 (0.9987 Å) calculated by B3LYP/6-31G(d,p) is just 0.0317 Å higher than the reported experimental value of 0.969 Å (ref. 11) in both the compounds. The experimental value of the C–H bond of methyl group is 1.090 Å (ref. 12) differed by 0.0071 and 0.0042 Å (calculated by B3LYP/6-31G(d,p)) in MMP.
In order to describe the conformational flexibility of the title compounds, the potential energy profile was achieved for the rotations of hydroxy, methoxy and methyl groups with the B3LYP/6-31G(d,p) method (Fig. S1 and S2†). The conformational energy profiles of MNP (Fig. S1†) show that there are three local minima observed at 0°, 90° and 360° (−623.017214198 for 0°, −623.00807271 hartree for 90°, −623.017214195 hartree for 360°) for T (C2–C1–O10–H11); for C1–O12–C13–H14, there are also three minima obtained at 60° (−623.017211684 hartree), 180° (−623.017214196 hartree) and 300° (−623.017211683 hartree); therefore, the most stable conformer is obtained for a 0° torsion angle of the OH group in MNP.
Furthermore, the conformational energy profiles of MMP (Fig. S2†) show that there are three local minima observed at 0°, 90° and 360° (−458.777154441 hartree for 0°, −458.766129262 hartree for 90°, −458.77715444 hartree for 360°) for T (C2–C1–O10–H11); for T (C1–012–C13–H14), there are also three minima obtained at 60° (−458.777152104 hartree), 180° (−458.777154046 hartree) and 300° (−458.777152234 hartree); for T (C3–C4–C17–H19), three minimum energies are also obtained at 60° (−458.777154422 hartree), 180° (−458.777154385 hartree) and 300° (−458.777154433 hartree). Therefore, the most stable conformer is obtained for a 0° torsion angle of the OH group in MMP also.
4.2. Vibrational assignments
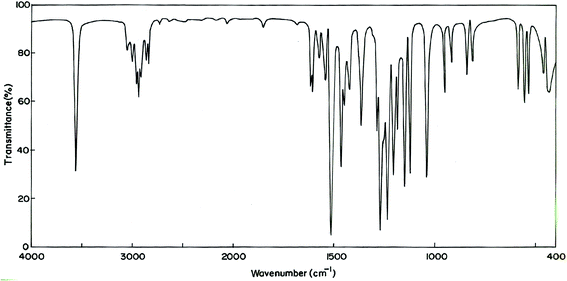
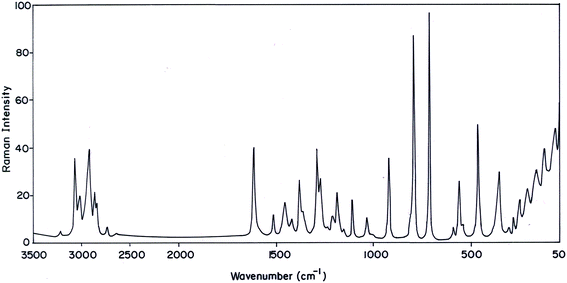
The MNP and MMP consist of 19 and 20 atoms, respectively, hence the number of normal modes of vibrations are 51 and 54 for MMP and MNP, respectively. Experimental FT-IR and FT-Raman spectra of the title compounds are presented in Fig. 3–6. Observed and calculated frequencies are quoted in Tables 1 and 2.| S. No | Experimental frequency (cm−1) | Calculated frequency (cm−1) | Assignments with TED (%) | ||||
|---|---|---|---|---|---|---|---|
| FT-IR | FT-Raman | HF/6-31G(d,p) | B3LYP/6-31G(d,p) | ||||
| Unscaled | Scaled | Unscaled | Scaled | ||||
| a Abbreviations: ν – stretching; b – bending; symd – symmetric deformation; asymd – asymmetric deformation; trigd – trigonal deformation; δ-out-of plane bending; t – torsion; twist – twisting; ss – symmetric stretching; ass – asymmetric stretching; ips – in-plane stretching; ops-out-of plane stretching; sb – symmetric bending; ipb – in plane bending; opb – out of plane bending; ipr – in plane rocking; opr – out of plane rocking; scis – scissoring; rock – rocking; wag – wagging. | |||||||
| 1 | 3407 | — | 3477 | 3425 | 3448 | 3419 | νOH (99) |
| 2 | — | 3100 | 3305 | 3108 | 3300 | 3105 | νCH (97) |
| 3 | 3087 | — | 3294 | 3100 | 3272 | 3099 | νCH (96) |
| 4 | 3036 | — | 3257 | 3053 | 3235 | 3042 | νCH (97) |
| 5 | 3013 | — | 3173 | 3029 | 3168 | 3021 | CH3ips (98) |
| 6 | 2968 | — | 3118 | 2982 | 3104 | 2972 | CH3ss (98) |
| 7 | 2946 | — | 3049 | 2963 | 3043 | 2951 | CH3ops (98) |
| 8 | 1607 | 1610 | 1766 | 1621 | 1652 | 1614 | νC![[double bond, length as m-dash]](https://www.rsc.org/images/entities/char_e001.gif) C (84), Rsymd (13) C (84), Rsymd (13) |
| 9 | 1528 | — | 1750 | 1553 | 1628 | 1542 | νC![[double bond, length as m-dash]](https://www.rsc.org/images/entities/char_e001.gif) C (73), Rasymd (29) C (73), Rasymd (29) |
| 10 | 1513 | — | 1665 | 1534 | 1569 | 1521 | NO2ass (80) |
| 11 | 1459 | — | 1656 | 1472 | 1553 | 1464 | νC–O (79), bCH (17) |
| 12 | 1449 | — | 1655 | 1472 | 1544 | 1461 | νC–O (79), bCO (19) |
| 13 | 1444 | — | 1637 | 1463 | 1509 | 1459 | νC![[double bond, length as m-dash]](https://www.rsc.org/images/entities/char_e001.gif) C (79), bCH (17) C (79), bCH (17) |
| 14 | — | 1402 | 1613 | 1419 | 1498 | 1413 | νC–C (83), Rsymd (11) |
| 15 | — | 1388 | 1538 | 1399 | 1416 | 1392 | νC–C (87), Rsymd (11) |
| 16 | 1345 | 1347 | 1419 | 1351 | 1347 | 1347 | νC–C (84), Rasymd (11) |
| 17 | — | 1330 | 1380 | 1351 | 1333 | 1344 | NO2ss (80), bCN (12) |
| 18 | 1280 | — | 1341 | 1299 | 1295 | 1294 | bCH (78), Rtrigd (15) |
| 19 | — | 1268 | 1301 | 1280 | 1254 | 1277 | bCH (79), Rasymd (12) |
| 20 | 1242 | — | 1297 | 1251 | 1243 | 1249 | bCH (75), Rsymd (14) |
| 21 | 1214 | 1211 | 1279 | 1221 | 1193 | 1219 | bOH (69), Rasymd (21) |
| 22 | 1182 | — | 1260 | 1196 | 1189 | 1190 | CH3ipb (98) |
| 23 | 1130 | — | 1230 | 1147 | 1163 | 1141 | CH3sb (97) |
| 24 | 1116 | — | 1165 | 1128 | 1162 | 1121 | CH3opb (98) |
| 25 | — | 1080 | 1151 | 1101 | 1088 | 1094 | νCN (77), bCH (12) |
| 26 | 1077 | — | 1144 | 1088 | 1044 | 1081 | Rtrigd (71), bCC (19) |
| 27 | — | 1020 | 1072 | 1032 | 1029 | 1029 | νO–CH3 (81) |
| 28 | 1017 | — | 1057 | 1021 | 1001 | 1009 | Rsymd (72), bCH (18) |
| 29 | 949 | — | 994 | 959 | 936 | 953 | Rasymd (74), bCN (15) |
| 30 | 870 | — | 976 | 881 | 892 | 879 | CH3ipr (78) |
| 31 | 816 | 819 | 930 | 821 | 799 | 802 | NO2scis (75) |
| 32 | 769 | — | 811 | 777 | 771 | 771 | CH3opr (76) |
| 33 | 744 | — | 789 | 751 | 748 | 748 | δCH (65), δCN (20) |
| 34 | 723 | — | 778 | 733 | 704 | 711 | δCH (64), tRasymd (21) |
| 35 | 634 | — | 759 | 649 | 644 | 644 | δCH (64), δCO (16) |
| 36 | 607 | — | 679 | 613 | 602 | 602 | NO2rock (68) |
| 37 | 593 | — | 642 | 599 | 595 | 595 | bC–N (69), Rasymd (21) |
| 38 | — | 560 | 625 | 571 | 558 | 559 | NO2wag (64), δCN (20) |
| 39 | 543 | — | 586 | 552 | 546 | 546 | δOH (59), δCC (17) |
| 40 | 486 | — | 522 | 491 | 489 | 489 | bC–O (67), bO–H (15) |
| 41 | — | 450 | 508 | 461 | 467 | 459 | bC–O (69), Rasymd (22) |
| 42 | — | 390 | 439 | 399 | 378 | 387 | bO–CH3 (66) |
| 43 | — | 360 | 423 | 369 | 377 | 363 | δCN (67), tRtrigd (20) |
| 44 | — | 330 | 401 | 334 | 323 | 327 | tRtrigd (63), δCN (18) |
| 45 | — | 250 | 353 | 252 | 240 | 248 | tRsymd (64), δCH (21) |
| 46 | — | 225 | 295 | 231 | 235 | 229 | tRasymd (65), δCH(22) |
| 47 | — | 210 | 261 | 217 | 206 | 206 | t(O–CH3) (59) |
| 48 | — | 165 | 228 | 171 | 176 | 169 | δC–O (67) |
| 49 | — | 125 | 224 | 137 | 137 | 129 | δC–O (63) |
| 50 | — | 68 | 210 | 88 | 85 | 71 | tCH3 (55) |
| 51 | — | 29 | 126 | 42 | 67 | 32 | NO2twist (58) |
| S. No | Experimental frequency (cm−1) | Calculated frequency (cm−1) | Assignments with TED (%) | ||||
|---|---|---|---|---|---|---|---|
| FT-IR | FT-Raman | HF/6-31G(d,p) | B3LYP/6-31G(d,p) | ||||
| Unscaled | Scaled | Unscaled | Scaled | ||||
| a Abbreviations: ν – stretching; b – bending; symd – symmetric deformation; asymd – asymmetric deformation; trigd – trigonal deformation; δ-out-of-plane bending; t – torsion; twist – twisting; ss – symmetric stretching; ass – asymmetric stretching; ips – in plane stretching; ops – out-of-plane stretching; sb – symmetric bending; ipb – in plane bending; opb – out of plane bending; ipr – in plane rocking; opr – out of plane rocking; scis – scissoring; rock – rocking; wag – wagging. | |||||||
| 1 | 3662 | — | 3404 | 3582 | 3445 | 3599 | νOH (99) |
| 2 | — | 3067 | 3300 | 3079 | 3232 | 3072 | νCH (99) |
| 3 | 3005 | — | 3275 | 3020 | 3210 | 3012 | νCH (98) |
| 4 | 2961 | — | 3262 | 2981 | 3197 | 2973 | νCH (98) |
| 5 | 2939 | — | 3208 | 2952 | 3155 | 2947 | CH3ips (98) |
| 6 | — | 2921 | 3160 | 2944 | 3120 | 2933 | CH3ips (98) |
| 7 | 2919 | — | 3146 | 2931 | 3089 | 2922 | CH3ss (98) |
| 8 | — | 2865 | 3127 | 2881 | 3086 | 2874 | CH3ss (98) |
| 9 | 2855 | — | 3081 | 2877 | 3041 | 2864 | CH3ops (98) |
| 10 | 2843 | — | 3078 | 2870 | 3031 | 2857 | CH3ops (98) |
| 11 | 1616 | — | 1795 | 1635 | 1653 | 1622 | νC![[double bond, length as m-dash]](https://www.rsc.org/images/entities/char_e001.gif) C (84), Rsymd (13) C (84), Rsymd (13) |
| 12 | 1610 | — | 1780 | 1622 | 1638 | 1619 | νC![[double bond, length as m-dash]](https://www.rsc.org/images/entities/char_e001.gif) C (73), Rasymd (29) C (73), Rasymd (29) |
| 13 | — | 1600 | 1682 | 1617 | 1576 | 1609 | νC–O (79), bCH (17) |
| 14 | 1565 | — | 1670 | 1579 | 1562 | 1571 | νC–O (79), bCO (19) |
| 15 | 1540 | — | 1667 | 1560 | 1557 | 1552 | νC![[double bond, length as m-dash]](https://www.rsc.org/images/entities/char_e001.gif) C (79), bCH (17) C (79), bCH (17) |
| 16 | — | 1532 | 1664 | 1557 | 1553 | 1547 | νC–C (83), Rsymd (11) |
| 17 | 1523 | — | 1653 | 1540 | 1549 | 1531 | νC–C (87), Rsymd (11) |
| 18 | 1515 | — | 1642 | 1533 | 1510 | 1524 | νC–C (84), Rasymd (11) |
| 19 | 1466 | 1466 | 1612 | 1481 | 1471 | 1477 | νC–Cme (59), bCH (17) |
| 20 | 1451 | — | 1596 | 1471 | 1463 | 1461 | CH3ipb (98) |
| 21 | 1425 | — | 1564 | 1439 | 1433 | 1431 | CH3ipb (98) |
| 22 | 1367 | — | 1438 | 1382 | 1355 | 1376 | CH3sb (97) |
| 23 | 1288 | 1290 | 1392 | 1301 | 1283 | 1293 | CH3sb (98) |
| 24 | 1272 | 1275 | 1361 | 1289 | 1266 | 1280 | CH3opb (98) |
| 25 | 1256 | — | 1329 | 1278 | 1251 | 1261 | CH3opb (98) |
| 26 | 1206 | — | 1297 | 1211 | 1195 | 1202 | bCH (78), Rtrigd (15) |
| 27 | 1188 | 1189 | 1284 | 1197 | 1174 | 1181 | bCH (79), Rasymd (12) |
| 28 | 1151 | — | 1244 | 1177 | 1166 | 1162 | bCH (75), Rsymd (14) |
| 29 | 1123 | — | 1242 | 1141 | 1165 | 1132 | bOH (69), Rasymd (21) |
| 30 | — | 1110 | 1227 | 1122 | 1101 | 1119 | Rtrigd (71), bCC (19) |
| 31 | 1045 | — | 1144 | 1073 | 1056 | 1051 | νOCH3 (81) |
| 32 | — | 1036 | 1138 | 1055 | 1044 | 1042 | Rsymd (72), bCH (18) |
| 33 | 954 | — | 1093 | 975 | 989 | 961 | Rasymd (74), bCH (15) |
| 34 | — | 922 | 1057 | 944 | 927 | 931 | bCCme (42), bCH (27) |
| 35 | 918 | — | 1000 | 934 | 926 | 926 | CH3ipr (78) |
| 36 | 845 | — | 975 | 867 | 855 | 855 | CH3ipr (78) |
| 37 | 810 | — | 928 | 819 | 801 | 801 | CH3opr (76) |
| 38 | — | 794 | 848 | 808 | 781 | 781 | CH3opr (76) |
| 39 | — | 715 | 825 | 723 | 719 | 719 | δCH (65), δCO (20) |
| 40 | 599 | — | 770 | 610 | 608 | 608 | δCH (64), tRasymd (21) |
| 41 | — | 562 | 688 | 588 | 562 | 562 | δCH (64), δCO (16) |
| 42 | 557 | — | 604 | 577 | 558 | 558 | bCO (69), Rasymd (21) |
| 43 | 530 | — | 598 | 550 | 549 | 543 | δOH (59), δCC (17) |
| 44 | 460 | — | 533 | 487 | 477 | 469 | bCO (67), bOH (15) |
| 45 | 435 | — | 509 | 451 | 475 | 442 | bCO (69), Rasymd (22) |
| 46 | — | 366 | 434 | 389 | 372 | 372 | bOCH3 (66) |
| 47 | — | 361 | 413 | 377 | 360 | 360 | tRtrigd (63), δCN (18) |
| 48 | — | 276 | 408 | 299 | 285 | 285 | tRsymd (64), δCH (21) |
| 49 | — | 249 | 350 | 266 | 253 | 253 | tRasymd (65), δCH (22) |
| 50 | — | 188 | 336 | 201 | 197 | 196 | δCCme (54), bCH (21) |
| 51 | — | 173 | 299 | 188 | 189 | 179 | t(OCH3) (59) |
| 52 | — | 135 | 237 | 149 | 152 | 141 | δCO (67) |
| 53 | — | 61 | 187 | 87 | 74 | 71 | δCO (63) |
| 54 | — | 43 | 169 | 76 | 55 | 49 | tCH3 (55) |
5. NBO analysis
NBO theory allows the assignment of the hybridization of atomic lone-pairs and of the atoms involved in bond orbitals. These are significant data in spectral interpretation since the frequency ordering is interrelated to the bond hybrid composition. The NBO analysis allows us to estimate the energy of the molecule with the same geometry but in the absence of electronic delocalization. Moreover, only the steric and electrostatic interactions through the ELewis are taken into account.The most important interactions between ‘filled’ (donors) Lewis-type NBO’s and ‘empty’ (acceptors) non-Lewis NBO’s of title compounds are reported in Tables S3 and S4.† The lone pair of n3 (O18) with π* (N17–O19) and n2 (O10) with π* (C1–C6) are identified as the strongest interaction (180.46 and 20.57 kcal mol−1) for MNP and MMP, respectively. The lone pair interactions such as n2 (O10) → π* (C1–C2) in MNP, n2 (O12) → π* (C2–C3) in MMP provide evidence for charge transfer interactions from the OH moiety to the ring. The energy contribution of these interactions are 34.06 and 20.37 kcal mol−1, respectively. The π-electron cloud movement from donor to acceptor can make the molecule highly polarized and this CT must be responsible for the NLO properties.
6. HOMO–LUMO analysis on the most stable structures
The analysis of the wave function indicates that the electron adsorption corresponds to the transition from the ground state to the first excited state and is mainly described by one-electron excitation from the highest occupied molecular orbital (HOMO) to the lowest unoccupied molecular orbital (LUMO). The HOMO and LUMO orbitals for the most stable conformers of MNP and MMP are shown in Fig. 7. The HOMO–LUMO energy gaps are calculated at the B3LYP/6-31G(d,p) level (see Fig. 7) and these energy gaps reflect the chemical activity of the molecule. The LUMO as an electron acceptor represents the ability to obtain an electron, and HOMO refers to the ability to donate an electron. The energy gaps of HOMO–LUMO (Fig. 7) explain the eventual charge transfer interactions within the conformers. Consequently, the lowering of the HOMO–LUMO band gap is basically a consequence of the large stabilization of the LUMO. This is due to the strong electron-acceptor ability of the electron-acceptor group. For these conformers, the HOMO and LUMO have π and π* characters, respectively. The HOMO of MNP conformer shows antibonding character at O–CH3, O–H and NO2 moieties and bonding character on the ring. There is no electronic projection over the C–H group. The LUMO of MNP has a larger electronic projection over NO2. Similarly, the HOMO of MMP conformer shows antibonding character at O–CH3, O–H and CH3 moieties and bonding character on ring. In LUMO of both the compounds there is no charge localization towards the C–H group of the O–CH3 moiety.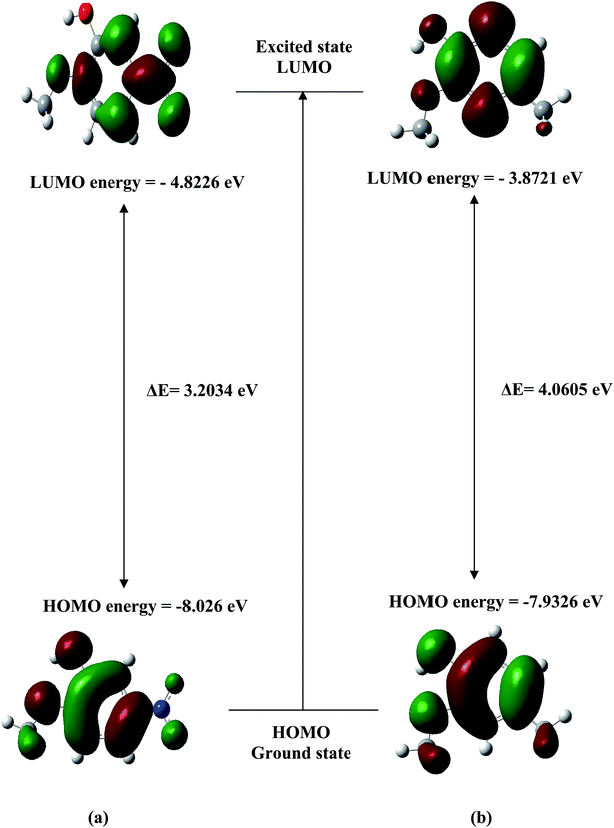 | ||
| Fig. 7 HOMO–LUMO surface pictorial of (a) most stable conformer of MNP (b) most stable conformer of MMP. | ||
7. NMR spectra
It is well recognized that accurate predictions of molecular geometries are essential for reliable calculations of magnetic properties. Therefore, full geometry optimization of both the compounds are performed using the B3LYP method with the 6-31G(d,p) basis set. The 13C chemical shifts for both the compounds are calculated by the GIAO (gauge-including atomic orbital) method in two different solvents such as DMSO, CDCl3. The relative chemical shifts are then estimated using TMS shielding as the reference. Calculated 13C and 1H isotropic chemical shielding for TMS are 182.4656 and 31.8821 ppm by B3LYP/6-311 + G(2d,p), respectively. The calculated 1H and 13C NMR chemical shifts of MNP and MMP are compared with the experimental data. All the calculated 1H and 13C chemical shifts of title the compounds are tabulated in Tables S5 and S6.†C2 of MNP and MMP in the phenyl ring appears at higher chemical shifts of 112.4858 and 117.4975 ppm due to a neighbouring electronegative oxygen atom, respectively. Hence C2 seems to be shielded due to delocalization of electrons from the nitrogen atom. A peak at 112.5195 ppm is due to the nitro group. The deviation of the chemical shift of carbon atoms between the given experimental25 and computed chemical shifts may be due to the presence of intermolecular hydrogen bonding.
Vacuum phase peaks at 5.0212, 6.5672, 6.4004 ppm and 4.7539, 5.335, 5.1463 ppm indicate the presence of aromatic hydrogen atoms in MNP and MMP, respectively. The average peak values at 3.044 and 2.8524 ppm indicate the O–CH3 protons. These values are compared with the experimental value of 2-methoxy phenol.26 In MMP, the average peak value at 1.1908 ppm belongs to the methyl group proton which is compared with the experimental value of 2-methylphenol.26 The chemical shifts obtained and calculated for the hydrogen atoms of methyl groups are quite low. All values are ≤3 ppm due to shielding effects. In line with the above literature data, in our present study the methyl protons at C17 appear at 1.2772 ppm in DMSO showing good agreement with the computed chemical shift values.
8. Electronic spectra
The electronic transition energies and oscillator strengths at the excitation or emission processes are calculated by the TDDFT method in combination with PCM. In the excitation energy calculations, the PBE0 hybrid functional (PBE1PBE keyword in Gaussian) is selected. Generally the solvent plays an important role in absorption or emission spectrum of the title compounds. In this paper, the polarisable continuum model (PCM) including the solvent effect is preferred in excitation energy calculations. The PCM/TDDFT calculations is used for the solute molecule in solvents of different polarity such as a weakly polar cyclohexane (CHX), medium polar tetrahydrofuran (THF) and strongly polar acetonitrile (ACN). The vertical excitation energy and oscillator strength along with the main excitation configuration are listed in Table S7.† Major electronic absorption bands are assigned to those excitations with significant oscillator strengths as π → π* in all solvents.9. First hyperpolarizability
The electronic and vibrational contributions to the first hyperpolarizabilities have been studied theoretically for many organic and inorganic systems. The values of the first hyperpolarizability were found to be quite large for the so-called push–pull molecules, i.e. p-conjugated molecules with the electron donating and the electron withdrawing substituents attached to a ring, compared to the monosubstituted systems. This type of functionalization of organic materials, with the purpose of maximizing NLO properties, is still a commonly followed route.The first hyperpolarizabilities of these molecular systems are calculated using the B3LYP/6-31G(d,p) method, based on the finite-field approach. In the presence of an applied electric field, the energy of a system is a function of the electric field. First order hyperpolarizability (β) is a third rank tensor that can be described by 3 × 3 × 3 matrices. The components of which are defined as the coefficients in the Taylor series expansion of the energy in the external electric field. When the external electric field is weak and homogeneous, this expansion becomes:
| βx = βxxx + βxyy + βxzz |
| βy = βyyy + βxxy + βyzz |
| βz = βzzz + βxxz + βyyz |
Since the value of hyperpolarizability (β) of the Gaussian 09W output is reported in atomic units (au.), the calculated values have been converted into electrostatic units (esu) (β: 1 au. = 8.639 × 10⁻³³ esu). The total molecular dipole moment and first hyperpolarizability of MNP and MMP are 7.5450 and 3.2974 debye and 2.3332 × 10⁻³⁰ and 1.678 × 10⁻³⁰ esu, respectively and are depicted in Table 3. Total dipole moment and first hyperpolarizability of the title compounds are greater than those of urea (μ and β of urea are 1.3732 debye and 0.3728 × 10⁻³⁰ esu obtained by the HF/6-311G(d,p) method).
| Parameters | Values (au.) | |
|---|---|---|
| 2-Methoxy-5-nitrophenol | 2-Methoxy-4-methylphenol | |
| βxxx | 194.7 | 176.2 |
| βxxy | 668![[thin space (1/6-em)]](https://www.rsc.org/images/entities/char_2009.gif) 933 933 |
8.5 |
| βyyy | −0.0030211 | 8.7 |
| βxxz | 14.3614282 | −84 |
| βxyz | 0.0149988 | −430 |
| βyyz | 16.305164 | −9.1 |
| βxzz | 61.8314414 | 5.7 |
| βyzz | 60.5510057 | 299.6 |
| βzzz | −0.0072881 | 202.7 |
| β | 2.3332 × 10⁻³⁰ esu | 1.678 × 10⁻³⁰ esu |
10. Conclusion
A complete vibrational and molecular structure analyses is performed based on the quantum mechanical approach by HF and DFT calculations. On the basis of the calculated and experimental results the assignment of the fundamental frequencies are examined. The available experimental results were compared with theoretical data. A low value of HOMO LUMO energy gap suggests the possibility of intramolecular charge transfer in the molecule. This plays an important role in the significant increase of the β value, which is an important property to exhibit nonlinear optical activity. NBO result reflects the charge transfer mainly due to lone pairs. Theoretical 1H and 13C chemical shift values (with respect to TMS) are reported and compared with experimental data, show agreement for both 1H and 13C. Predicted electronic absorption spectra from TD-DFT calculations are analysed and they are mainly derived from the contribution of the π → π* band. The predicted NLO properties are much greater than those of urea.References
- B. S. Bhal and A. Bhal, Advanced Organic Chemistry, S. Chand and Company, 4th edn, 1995 Search PubMed.
- J. H. S. Green and D. J. Harrison, Spectrochim. Acta, Part A, 1971, 27, 93 CrossRef.
- R. K. Rai, Proc. Indiana Acad. Sci., 1962, 55, 232 Search PubMed.
- R. B. Singh and D. K. Rai, Indian J. Pure Appl. Phys., 1980, 20, 330 Search PubMed.
- R. J. Jakobsen, Spectrochim. Acta, Part A, 1965, 21, 433 CrossRef CAS.
- R. J. Jakobsen and E. J. Brewer, Appl. Spectrosc., 1962, 17, 32 CrossRef.
- Y. Kishore, S. N. Sharma and C. P. D. Dwivedi, Indian J. Phys., 1974, 48, 412 CAS.
- Gaussian 09W Program, Gaussian Inc., Wallingford, 2004 Search PubMed.
- R. Dennington, I. I. T. Keith and J. Millam, Gauss View, Semichem, Inc., Shawnee Mission, KS, 2007 Search PubMed.
- MOLVIB (V.7.0), Calculation of Harmonic Force Fields and Vibrational Modes of Molecules, QCPE Program No. 807, 2002 Search PubMed.
- S. Kashino, M. Tomita and M. Haisa, Acta Crystallogr., Sect. C: Cryst. Struct. Commun., 1988, 44, 730 CrossRef.
- M. Bakiler, I. V. Maslov and S. Akyuz, J. Mol. Struct.: THEOCHEM, 1999, 475, 83–87 CrossRef CAS.
- G. Varsanyi, Assignments for Vibrational Spectra of Seven Hundred Benzene Derivatives, Acacemiai Kiado, Budapest, 1973, vol. 1 and 2 Search PubMed.
- A. J. Barnes, Spectrochim. Acta, Part A, 1985, 41, 629 CrossRef.
- I. F. Shishkov, N. I. Sadova, V. P. Novikov and L. V. Vilkov, Zh. Strukt. Khim., 1984, 25, 98–102 CAS.
- R. M. Silverstein, G. C. Bassler and T. C. Morrill, Spectrometric Identification of Organic Compounds, John Wiley & Sons, Inc., New York, 5th edn, 1981 Search PubMed.
- J. Coates, Interpretation of infrared spectra: a practical approach, in Encyclopedia of Analytical Chemistry, ed. R. A. Meyers, John Wiley & Sons Ltd, Chichester, 2000 Search PubMed.
- S. Ahmad, S. Mathew and P. K. Verma, Indian J. Pure Appl. Phys., 1992, 30, 764–770 CAS.
- D. Mahadevan, S. Periandy and S. Ramalingam, Spectrochim. Acta, Part A, 2011, 78, 575–581 CrossRef CAS PubMed.
- N. B. Colthup, L. H. Daly and S. E. Wiberley, Introduction to Infrared and Raman Spectroscopy, Academic Press, New York, 1990 Search PubMed.
- G. Varsanyi, Assignments of Vibrational Spectra of Seven Hundred Benzene Derivatives, Adam Hilger, 1974, vol. 1 and 2 Search PubMed.
- N. Sundaraganesan, S. Ilakiamani, H. Saleem, P. M. Wojieehowski and D. Michalska, Spectrochim. Acta, Part A, 2005, 61, 2995 CrossRef CAS PubMed.
- A. Kovács, G. Keresztury and V. Izvekov, Chem. Phys., 2000, 253, 193–204 CrossRef.
- D. N. Sathyanarayana, Vibrational Spectroscopy–Theory and Applications, Newage International (P) Limited Publishers, New Delhi, 2nd edn, 2004 Search PubMed.
- G. Crisponi, et al., Talanta, 2002, 56, 441–449 CrossRef CAS PubMed.
- R. J. Abraham and M. Mobli, Magn. Reson. Chem., 2007, 45, 865–877 CrossRef CAS PubMed.
Footnote |
| † Electronic supplementary information (ESI) available. See DOI: 10.1039/c6ra00092d |
| This journal is © The Royal Society of Chemistry 2016 |

