Correction function for biased results due to matrix effects in residue analysis of beta-agonists in porcine tissues and urine with LC-MS/MS

LiQi Wang ab, ZhenLing Zengb, Zhong Wanga and LiMin He*b
aCollege of Animal Science and Veterinary Medicine, Jiangxi Agricultural University, Nanchang, 330045, China
bNational Reference Laboratory of Veterinary Drug Residues (SCAU), College of Veterinary Medicine, South China Agricultural University, Guangzhou, 510642, China. E-mail: liminokhe@scau.edu.cn; Fax: +86-20-8528-4896; Tel: +86-20-8528-4896

Received 30th December 2015 , Accepted 1st March 2016

First published on 2nd March 2016


Abstract

In the residue analysis of nine β-agonists, namely salbutamol, terbutaline, cimaterol, fenoterol, clorprenaline, ractopamine, tulobuterol, clenbuterol and penbuterol in porcine liver, muscle and urine with liquid chromatography tandem mass spectrometry (LC-MS/MS), solvent calibration (SC) and matrix-matched calibration (MC) were compared using analysis of covariance to estimate the matrix effects (MEs) for all the analytes. Significant differences (P < 0.05) between the SC and MC were found for most analytes, indicating that the matrix induces systematic or proportional errors in the quantification of those analytes. In such cases, a correction function (CF) is proposed, with which the real concentration of analytes could be predicted using a SC. The results of the validation study showed that recoveries of the analytes calculated using the CF were comparable to those calculated using the MC, suggesting that the CF could be satisfactorily applied to the correction of MEs and the quantification of β-agonists in their residue analysis in porcine liver, muscle and urine by LC-MS/MS.

1. Introduction

β-Agonists, well known for their ability to repartition the carcass composition by decreasing fat deposition and increasing muscle mass, are illegally used as growth promoters in food producing animals. However, their adverse effects on human health such as food poisoning due to the consumption of contaminated liver or muscle with symptoms such as gross tremors of the extremities, tachycardia, nausea, headaches, dizziness, and even death have been reported.1,2 Although these compounds have been prohibited as growth-promoting agents in farm animals in European Communities3 and some countries in Asia, their illegal use may still exist.4 Since banned chemicals must not be found in the sample, the more sensitive the analytical method is, the safer the sample will be. Therefore, it’s necessary to develop sensitive analytical methods to guarantee consumers’ safety.

So far, various analytical methods have been proposed for monitoring the illegal use of β-agonists. Rapid immunochemical tests such as radioimmunoassay and enzyme immunoassay are generally used for screening purposes,5,6 yet they are not suitable for multiresidue analysis. Alternatively, GC-MS7–9 and LC-MS methods10–12 have been reported. The requirement of derivatization limits the application of GC-MS methods because derivatization is time consuming, tedious, and expensive. In contrast, with the advantages of sensitivity, selectivity, and specificity, LC-MS methods are suitable for polar and nonvolatile drug analysis without derivatization, making it a good choice for β-agonist residue analysis.4,10,13

However, matrix effects (MEs) resulting from co-eluting interferents have been a common problem in LC-MSn analyses. MEs may cause ionization suppression or enhancement of analytes, drastically affect the precision and accuracy of the method and, therefore, compromise the quality of the results, while their mechanism has not been fully understood.14 Both electrospray ionization (ESI) and atmospheric pressure chemical ionization (APCI) suffer from MEs, but the former has been proved to be more prone to it.15–17 Accordingly, much attention should be paid to evaluating this phenomenon in the development and validation of a LC-MS/MS method.18–20

Several approaches have been suggested to correct this phenomenon. Matrix-matched calibration (MC) is the most common and recommended way for ease of use and the effectiveness of the approach to avoid MEs,21–26 but it is time-consuming and laborious to prepare a matrix-matched calibration for each particular matrix.

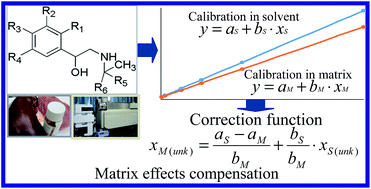
In the residue analysis of pesticides in vegetables, investigators have proposed a strategy to correct MEs.26–28 In the method, a calibration prepared in solvent (SC) and in a blank matrix extract (MC) are statistically compared to obtain a correction function (CF) using analysis of covariance (ANCOVA). With the CF, the real concentration of analytes could be predicted using the concentration obtained from the SC. In such a way, only a SC needs to be prepared for the quantification in different matrices, which is time-saving and cost-effective. In addition, without introducing matrix components into the instrument, the use of a CF could be more conducive to instrument protection. As far as we know, however, this method has not been applied in veterinary drug residue analysis.

The purpose of this study is to propose a correction function in the determination of β-agonists including salbutamol, terbutaline, cimaterol, fenoterol, clorprenaline, ractopamine, tulobuterol, clenbuterol and penbuterol (Fig. 1S) in porcine liver, muscle, and urine samples with LC-MS/MS, so that MEs could be conveniently and effectively compensated, and reliable results could be obtained using solvent calibration.

2. Materials and methods

2.1. Chemicals

Ethylene glycol dimethacrylate (EGDMA) was obtained from Sigma-Aldrich (St. Louis, MO). Methacrylic acid (MAA) and 2,2′-azobisisobutyronitrile (AIBN) were purchased from Kermel Chemical Reagents Development Center (Tianjin, China). Acetonitrile, methanol and formic acid purchased from Fisher Scientific Co. (Pittsburgh, PA) were of HPLC grade. Other reagents were of analytical grade.

2.2. Preparation of standards

Standards of salbutamol, terbutaline, cimaterol, fenoterol, clorprenaline, ractopamine, tulobuterol, clenbuterol and penbuterol were purchased from the China Institute of Veterinary Drug Control (Beijing, China). A stock solution of each β-agonist was prepared in methanol at a concentration of 1 mg mL−1 and stored at 20 °C. Working solutions were diluted from the stock solutions with 10% methanol in water containing 0.1% formic acid before use.

2.3. Preparation of polymer packing

The preparation of a new polymer as the packing material of a solid phase extraction (SPE) cartridge was based on the method described by Wang et al.13 Briefly, appropriate amounts of monomer (MAA), cross-linker (EGDMA), initiator (AIBN) and acetone were added to a polypropylene tube, sonicated for 10 min, and degassed with nitrogen for 5 min on an ice bath before being sealed. The tube was placed in a water bath at 60 °C for 24 h. The polymer monolith was crushed, sieved, and particles between 400 and 200 mesh (37.5–75 μm) size were collected. The particles were washed with methanol and dried under vacuum. A new type of SPE cartridge packed with 200 mg of the synthesized polymer particles was applied in the following experiments.

2.4. Sample collection

Five replicate samples for each matrix (15 samples in total) were collected from local markets in China. Muscle and liver samples were homogenated and stored at −20 °C with urine samples before analysis. The collected samples were prepared and analyzed according to the method that we previously developed13,21 and would be later described in detail in Section 2.5 and 2.10. The results showed that the samples were free of the nine β-agonists.

2.5. Sample extract and cleanup

The samples were pretreated, and analyzed by LC-MS/MS according to the method we previously developed.13,21 Briefly, for the porcine liver and muscle samples, 2 g of blank homogenised sample was extracted with 10 mL of acetonitrile and 1 mL of 10% sodium carbonate solution. After vortexing, the sample was ultrasonicated (30 min) and centrifuged (8000 × g, 10 min) at 4 °C, followed by transferring the supernatant into another tube. The sediment was extracted with 5 mL of acetonitrile once again. Then the supernatants were combined together and evaporated to dryness at 50 °C, and the residues were dissolved in 0.02 mol L−1 ammonium acetate (pH 5.2). For the urine samples, 1 mL of sample was 5-fold diluted with 0.02 mol L−1 ammonium acetate (pH 5.2) before cleanup.

The prepared SPE cartridge was conditioned with methanol, water and 0.02 mol L−1 ammonium acetate (pH 5.2), and then 5 mL of the tissue or urine sample was loaded onto the cartridge, followed by a washing step with water and methanol. Finally, the cartridge was eluted with 5 mL of methanol containing 4% ammonia water. The eluates were collected, and evaporated to dryness under a gentle nitrogen stream at 50 °C. The residues of muscle, liver and urine samples were reconstituted in 1.0, 1.0 and 0.5 mL of 10% methanol in water containing 0.1% formic acid, and centrifuged (15[thin space (1/6-em)]000 × g, 10 min) before the supernatant was injected for LC-MS/MS analysis.

2.6. Preparation of matrix-matched calibration and solvent calibration

According to the paper we published previously,21 calibration curves in blank porcine liver, muscle and urine extracts and in pure solvent were prepared as described in the following sections.

2.7. Matrix-matched calibration preparation

Working standard solutions of nine β-agonists at concentrations of 1, 5, 25, 50, 100 and 250 μg L−1 were obtained by appropriately diluting the stock solutions with 10% methanol in water containing 0.1% formic acid. Then an aliquot of 200, 200 and 100 μL of a suitable concentration of working standard solution was added to the eluates of the blank liver, muscle, and urine samples as pretreated above, respectively. These solutions were evaporated to dryness under a gentle nitrogen stream, and the residues of liver, muscle, and urine samples were successively reconstituted in 1.0, 1.0, and 0.5 mL of 10% methanol in water containing 0.1% formic acid. Finally a six-point calibration plot of each analyte in each matrix (0.1, 0.5, 2.5, 5, 10 and 25 μg kg(L)−1, corresponding to 0.2, 1, 5, 10, 20 and 50 μg L−1) was prepared in quintuplicate at each level.

2.8. Solvent calibration preparation

The working standard solution was diluted with 10% methanol in water containing 0.1% formic acid to prepare the six-point calibration plots in net solution (0.2, 1, 5, 10, 20 and 50 μg L−1) in quintuplicate at each level.

2.9. Recovery study

A recovery study was carried out by spiking a mixture of the nine β-agonists at a concentration of 10 μg kg(L)−1 in a blank sample. After vortexing, the spiked samples were allowed to stand for 20 min, and then were pretreated as described in Section 2.5.

2.10. LC-MS/MS conditions

An Agilent 1200 HPLC system (Palo Alto, CA) coupled to an Applied Biosystems API 4000 triple-quadrupole mass spectrometer (Foster City, CA) equipped with an ESI source was employed. Chromatographic separation was performed using a Luna C18 column (150 mm × 2 mm i.d., 5 mm) purchased from Phenomenex (Torrance, CA). Solvents A and B were 0.1% formic acid in water and acetonitrile, respectively. The flow rate was 0.25 mL min−1. The linear elution gradient profile consisted of 0–2.0 min: 0–45% B; 2.0–6.0 min: 45% B; 6.0–7.0 min: 45–0% B; 7.0–15 min: 0% B. The mass analyses were performed using an electrospray ion source in positive ionization mode. Multiple reaction monitoring (unit mass resolution) experiments were carried out. The operation conditions were as follows: ion spray voltage, 5.0 kV; source temperature, 650 °C; curtain gas, 20 psi; ion source gas 1 and gas 2 were at 60 and 55 psi, respectively. The dwell time was 150 ms for all nine β-agonists and Table 1 shows the optimized parameter values and the MRM transitions of the analytes (Fig. 1).
Table 1 Mass spectrometry parameters in MRM mode for the analysis of nine β-agonists
Analyte Parent ion [M + H]+, (m/z) Product ion (m/z) DPa (V) CEb (eV)
a DP, declustering potential.b CE, collision energy.c Quantification ions.
Salbutamol 240.0 222.0, 148.0c 60 10, 24
Terbutaline 226.1 169.8, 152.1c 54 15, 24
Cimaterol 220.0 143.2, 202.2c 55 10, 16
Fenoterol 304.2 134.8, 107.0c 54 30, 45
Clorprenaline 214.2 196.1, 154.1c 56 12, 28
Ractopamine 302.2 284.2, 164.1c 54 15, 23
Tulobuterol 228.1 171.8, 154.1c 54 12, 24
Clenbuterol 277.1 258.9, 203.0c 48 10, 23
Penbuterol 292.2 201.2, 236.2c 54 20, 25


image file: c5ra28050h-f1.tif
Fig. 1 Typical MRM chromatograms of 9 β-agonists in porcine liver samples spiked at 1 μg kg−1; a, b, c, d, e, f, g, h and i represent salbutamol, terbutaline, cimaterol, fenoterol, clorprenaline, ractopamine, tulobuterol, clenbuterol and penbuterol, respectively.

2.11. Statistical analyses

Analysis of covariance was performed as described in the previous paper published21 to investigate the differences among the calibration curves. Briefly, the calibration curve type (SC and MCs prepared in different matrices), analyte concentration, and analyte peak area were set as the fixed factor, covariate, and dependent variable, respectively. The significance level was set at 0.05. If the P-value is below 5% (P < 0.05) for the interaction term (calibration curve type × concentration) this indicates that there is a significant difference between the slopes of the calibration curves. In contrast, P > 0.05 indicates that the slopes of the calibration curves do not differ from each other significantly. In such a case, the difference between the intercepts of the calibration curves should be compared subsequently. A significant probability (P < 0.05) for the effect of calibration curve type suggests different intercepts of the calibration curves; similarly, P > 0.05 means no significant difference is found between them. In this way, the difference between two calibration curves can be statistically compared.29,30 Student’s t-test was carried out for the analytes with MEs to compare their recoveries obtained from the MC and those obtained from the CF. All the statistical analyses were performed using the SPSS Statistical Software Package, version 17.0 (SPSS Inc, Chicago, IL, USA).

2.12. Calculation of the correction function

According to Martínez-Galera et al.31 the correction function was calculated by making the regression line obtained from the SC (y = aS + bSxS) equal to that obtained from the MC (y = aM + bMxM) (eqn (1)), where aS and aM represent the intercepts of the calibration curves in the SC and MC, respectively; bS and bM represent the slopes of the calibration curves in the SC and MC, respectively, and xS and xM represent the concentration of analyte calculated by the SC and MC, respectively. According to eqn (1), the analyte concentration of an unknown real sample xM(unk) can be expressed as the function of xS(unk) (eqn (2)), which corresponds to a straight line.
 
aS + bSxS = aM + bMxM (1)
 
image file: c5ra28050h-t1.tif(2)

The correction coefficients A and B are defined as the intercept and slope of this straight line, respectively. The correction function can then be expressed as eqn (3).

 
xM(unk) = A + BxS(unk) (3)

In order to take the repeatability of the measurements into account, the MC and SC in different samples over the same concentration range were prepared monthly as described in Section 2.7 and 2.8. Using the values of the coefficients A and B obtained in different months, a mean correction function was calculated using eqn (4):

 
xM(unk) = Ā + [B with combining macron]xS(unk) (4)
which allows the transformation of the concentration (xS(unk)) into the corrected concentration (xM(unk)) taking into account the intermediate precision (Fig. 2).


image file: c5ra28050h-f2.tif
Fig. 2 Typical MRM chromatograms of 9 β-agonists in porcine muscle samples spiked at 1 μg kg−1; a, b, c, d, e, f, g, h and i represent salbutamol, terbutaline, cimaterol, fenoterol, clorprenaline, ractopamine, tulobuterol, clenbuterol and penbuterol, respectively.

3. Results and discussion

3.1. Validation of the analytical method for porcine liver, muscle and urine

The analytical method used in this study was established and validated for porcine muscle in the paper we previously published,13 and we have validated it for porcine liver and urine in another paper.32 The validation results proved that this analytical method could be successfully applied for residue analysis of the nine β-agonists in porcine liver, muscle and urine (Fig. 3).
image file: c5ra28050h-f3.tif
Fig. 3 Typical MRM chromatograms of 9 β-agonists in porcine urine samples spiked at 1 μg L−1; a, b, c, d, e, f, g, h and i represent salbutamol, terbutaline, cimaterol, fenoterol, clorprenaline, ractopamine, tulobuterol, clenbuterol and penbuterol, respectively.

3.2. Evaluation of the matrix effects by ANCOVA

The presence of matrix effects can affect the analyte signal, and therefore cause differences between the SC and MC. To assess the MEs, the SC and MC in porcine liver, muscle and urine were prepared by using the peak area of the analyte versus the corresponding concentration. The experimental results showed that in the concentration range of 0.1–25 μg kg(L)−1, the SC and MCs exhibited good linearity, with correlation coefficients (r2) higher than 0.99 for each β-agonist. The regression parameters established using the solvent-based and matrix-matched standards are listed in Table 2.
Table 2 Calibration curves of nine β-agonists prepared in solvent and blank matrix extracts of porcine liver, muscle and urinea
Analyte SC MCliver MCmuscle MCurine
a SC, MCliver, MCmuscle, and MCurine represents calibration curves in pure solvent, porcine liver, porcine muscle, and porcine urine, respectively.
Salbutamol y = 2.76 × 10⁴x + 3.67 × 10⁴ y = 2.25 × 10⁴x + 3.25 × 10⁴ y = 2.39 × 10⁴x + 3.37 × 10⁴ y = 2.39 × 10⁴x + 3.84 × 10⁴
Terbutaline y = 2.79 × 10⁴x + 4.04 × 10⁴ y = 2.14 × 10⁴x + 3.55 × 10⁴ y = 2.55 × 10⁴x + 3.43 × 10⁴ y = 2.49 × 10⁴x + 3.88 × 10⁴
Cimaterol y = 2.03 × 10⁴x + 2.14 × 10⁴ y = 1.44 × 10⁴x + 2.52 × 10⁴ y = 1.66 × 10⁴x + 2.40 × 10⁴ y = 1.81 × 10⁴x + 2.44 × 10⁴
Fenoterol y = 2.17 × 10⁴x + 2.01 × 10⁴ y = 1.24 × 10⁴x + 2.10 × 10⁴ y = 1.68 × 10⁴x + 2.20 × 10⁴ y = 2.69 × 10⁴x + 1.86 × 10⁴
Clorprenaline y = 2.88 × 10⁴x + 1.64 × 10⁴ y = 2.29 × 10⁴x + 1.67 × 10⁴ y = 2.76 × 10⁴x + 1.97 × 10⁴ y = 2.82 × 10⁴x + 1.54 × 10⁴
Fenoterol y = 1.08 × 10⁵x + 4.04 × 10⁴ y = 5.35 × 10⁴x + 2.35 × 10⁵ y = 1.07 × 10⁵x + 3.76 × 10⁴ y = 1.03 × 10⁵x + 2.46 × 10⁵
Clorprenaline y = 5.26 × 10⁴x + 3.40 × 10⁴ y = 4.40 × 10⁴x + 3.07 × 10⁴ y = 4.97 × 10⁴x + 2.37 × 10⁴ y = 4.78 × 10⁴x + 3.76 × 10⁴
Tulobuterol y = 3.35 × 10⁴x + 2.86 × 10⁴ y = 2.27 × 10⁴x + 2.60 × 10⁴ y = 3.01 × 10⁴x + 2.89 × 10⁴ y = 3.34 × 10⁴x + 2.48 × 10⁴
Penbuterol y = 1.08 × 10⁵x + 4.04 × 10⁴ y = 9.41 × 10⁴x + 3.48 × 10⁴ y = 9.62 × 10⁴x + 5.90 × 10⁴ y = 9.91 × 10⁴x + 4.39 × 10⁴


To check the differences among the calibration curves, a common way is to visually inspect their slopes on the same or separate graphs.33 However, only a subjective assessment can be made in this way. Since ANCOVA is recommended as the best option for comparing regression lines,34 it was applied in this study to compare the SC and MC and to figure out if MEs exist. The results listed in Table 3 show that a significant difference (P < 0.05) was observed between the SC and each MC for some β-agonists such as terbutaline, cimaterol, fenoterol, clorprenaline and tulobuterol in liver, terbutaline, ractopamine and penbuterol in muscle, and all analytes except for ractopamine in urine, which proved the presence of matrix effects for those analytes.

Table 3 Analysis of covariance between the calibration curves of nine β-agonists prepared in solvent and those prepared in porcine liver, muscle, and urine matrices
Analyte P-Valuea
SC vs. MCliver SC vs. MCmuscle SC vs. MCurine
Slope Intercept Slope Intercept Slope Intercept
a P-Value < 0.05 suggests that significant difference was found; P-value > 0.05 indicates that no significant difference was found; SC, MCliver, MCmuscle, and MCurine represents calibration curves in pure solvent, porcine liver, porcine muscle, and porcine urine, respectively.
Salbutamol 0.831 0.344 0.402 0.147 0.001 0.005
Terbutaline 0.029 0.068 0.233 0.032 0.000 0.000
Cimaterol 0.003 0.018 0.232 0.361 0.000 0.000
Fenoterol 0.008 0.073 0.193 0.118 0.000 0.001
Clorprenaline 0.001 0.009 0.260 0.441 0.000 0.004
Ractopamine 0.896 0.073 0.232 0.000 0.801 0.077
Tulobuterol 0.004 0.016 0.127 0.080 0.004 0.007
Clenbuterol 0.235 0.223 0.107 0.121 0.020 0.039
Penbuterol 0.071 0.066 0.013 0.051 0.046 0.131


3.3. Correction of matrix effects with the correction function

Since matrix effects might seriously impact the results of quantification, it has been suggested that an assessment of the matrix effects should be included in the LC-MS(/MS) method validation,35,36 and several strategies have been discussed to minimize it. Extensive cleanup of the samples is an efficient way to reduce matrix interferences in the final extract, yet the recovery of analytes might be compromised when rather complex matrices are treated.37–40 Modification of the chromatographic conditions to better separate the analytes and interfering species and switching of the ion source if it is sensitive enough can be alternatives to minimize MEs.15,41 As a matter of fact, however, it is unlikely to eliminate the MEs completely, and when they cannot be made negligible, proper calibration techniques like the addition of internal standards (IS), the eco-peak technique, matrix-matched external calibration, and the selection of a representative matrix for calibration can be used to compensate for them.42–44

Internal standard addition, especially stable isotopically labeled (SIL) internal standard addition might be the most efficient way to ensure reliable quantification results.44 However, it is not practical in multi-component analysis because each analyte requires an IS, and SIL ISs are not only expensive but also sometimes commercially unavailable. The eco-peak technique, which represents injections of a sample and reference standard with a short time interval, is less frequently used in veterinary drug residue analyses. The use of a matrix-matched calibration for each matrix, as mentioned above, is the most popular way to compensate for MEs. However, it is unpractical when an abundance of different animal derived food samples are involved each day in routine analysis. In this sense, a selection of representative matrices for calibration might effectively reduce the workload. This has been successfully applied in the residue analysis of pesticides in fruit and vegetable matrices using LC-MS(/MS) or gas chromatography-tandem mass spectrometry (GC-MS/MS)45–47 and the residue analysis of veterinary drugs in animal muscles with LC-MS/MS.21 Nevertheless, this method is not applicable to all matrices, especially to complex ones such as the liver and urine,21 and furthermore, even if a representative matrix is available, blank matrices still need to be prepared for calibration. An alternative to solve this problem is to build a CF using the SC and MC, which could save much time and money. In the analysis of the pesticide procymidone by HPLC for assessing dermal exposure, Cuadros-Rodriguez et al.27 proposed that a CF was satisfactorily applied to the quantification. Egea González et al.28 built a CF to compensate for MEs when analyzing eight pesticide residues in eight different vegetable and fruit commodities, and they pointed out that MEs could be avoided using a CF. Galera and co-workers26 compared two mathematical approaches, the correction function and correction term, to correct systematic errors due to MEs, and they found that the recoveries of pyrethroid insecticides obtained by both approaches were comparable to those obtained by MC. Thus it can be seen that the application of a CF is effective to compensate for MEs in pesticide residue analysis. It might be practicable in the residue analysis of veterinary drugs in animal-derived matrices, although to our knowledge, few relevant studies have been found in this field.

In this study, for those cases where the presence of matrix effects was proved, a CF was calculated to correct it. The results are shown in Table 4.

Table 4 Mean values of the coefficients and the correction function for the β-agonists with matrix effects in porcine liver, muscle and urine samples (n = 3)
Analyte Liver Muscle Urine
Aa Bb A B A B
a Mean value of the intercepts of the correction function obtained in three months.b Mean value of the slopes of the correction function obtained in three months.
Salbutamol −0.0694 1.1555
Terbutaline 0.2272 1.3032 0.2384 1.0944 0.0632 1.1208
Cimaterol −0.2633 1.4102 −0.1657 1.1189
Fenoterol −0.0718 1.7551 0.0570 0.8062
Clorprenaline −0.0153 1.2592 0.0347 1.0229
Ractopamine 0.0259 1.0100
Tulobuterol 0.0751 1.1962 −0.0760 1.1002
Clenbuterol 0.1151 1.0038
Penbuterol −0.1932 1.1223 −0.0350 1.0902


In order to validate the possibility of using a CF to substitute a MC for matrix effects correction in the quantification of β-agonists, the recoveries of analytes in each matrix were calculated using a SC, MC, and CF. As shown in Table 5, the analyte recoveries obtained from the CF and those obtained from the MC are very close. Thereafter, Student’s t-test was carried out to compare their statistical differences, and the results demonstrated that no significant differences were found between them (P > 0.05), indicating that the CF could be effectively used to compensate for MEs in the residue analysis of β-agonists in porcine liver, muscle and urine samples. In this way, only a SC needs to be prepared to obtain reliable analytical results, and much time and money could be saved because the preparation of a MC for each different matrix every time, which is time-consuming and laborious, could be avoided. A correction function might be a new and convenient strategy for compensating for MEs in the residue analyses of veterinary drugs in animal-derived matrices.

Table 5 Recoveries of β-agonists (10 μg kg(L)−1) with matrix effects in porcine liver, muscle and urine calculated using the solvent calibration curve, matrix-matched calibration curve and correction function
Analyte RECa, %
Liver Muscle Urine
SC MC CF SC MC CF SC MC CF
a Recovery, and each value represents the mean ± SD (n = 3); SC, MC and CF represent the solvent calibration curve, matrix-matched calibration curve and correction function, respectively.
Salbutamol 95.8 ± 2.1 107 ± 2.5 107 ± 2.5
Terbutaline 36.7 ± 2.3 58.5 ± 3.1 59.1 ± 3.1 61.0 ± 1.8 78.0 ± 2.0 78.6 ± 2.0 74.1 ± 2.0 85.8 ± 2.2 86.3 ± 2.3
Cimaterol 59.2 ± 5.6 68.8 ± 7.9 70.4 ± 8.0 111 ± 3.3 115 ± 3.6 116 ± 3.7
Fenoterol 34.6 ± 0.1 56.8 ± 0.1 57.2 ± 0.1 66.5 ± 5.2 56.3 ± 4.2 56.5 ± 4.2
Clorprenaline 50.6 ± 0.9 63.0 ± 1.1 62.9 ± 1.1 76.9 ± 2.1 80.3 ± 2.2 80.4 ± 2.2
Ractopamine 101 ± 2.0 103 ± 2.0 103 ± 2.0
Tulobuterol 62.5 ± 0.9 77.7 ± 1.1 78.5 ± 1.1 77.6 ± 1.1 81.5 ± 1.3 81.6 ± 1.3
Clenbuterol 99.0 ± 2.0 105 ± 2.0 105 ± 2.0
Penbuterol 80.3 ± 2.3 80.0 ± 1.9 80.5 ± 1.9 91.8 ± 7.0 98.1 ± 7.6 98.3 ± 7.7


4. Conclusions

In the determination of nine β-agonists in porcine liver, muscle and urine with LC-MS/MS, MEs were found for terbutaline, cimaterol, fenoterol, clorprenaline and tulobuterol in the liver, terbutaline, ractopamine and penbuterol in muscle, and all analytes except for ractopamine in urine, by comparing calibration curves in solvent and in blank matrix extracts using ANCOVA. A correction function was calculated using the SC and MC to correct for the MEs. A validation study showed that the recoveries of analytes calculated using the CF were comparable to those calculated using the MC, indicating that only an SC needs to be prepared for compensating for the matrix effects in the quantification of β-agonists, which is time- and cost-saving for the number of samples involved in routine analysis, compared with the preparation of matrix-matched calibration curves for each different matrix every time. Our findings suggested that the correction function is not limited to the residue analysis of pesticides in vegetables, but might also be applicable to the determination of veterinary drugs in animal-derived matrices.

Acknowledgements

This work was financially supported by the National Natural Science Foundation of China (31372476), Science and Technology Program Project of Guangzhou (2014J4100190) and Youth Foundation of Jiangxi Provincial Education Department (GJJ14309).

References

  1. J. Barbosa, C. Cruz, J. Martins, J. M. Silva, C. Neves, C. Alves, F. Ramos and S. M. Da, Food Addit. Contam., 2005, 22, 563–566 CrossRef CAS PubMed.
  2. J. F. Martinez-Navarro, Lancet, 1990, 336, 1311 CrossRef CAS.
  3. Council Directive 96/22/EC of 29 April 1996 concerning the prohibition on the use in stockfarming of certain substances having a hormonal or thyrostatic action and of β-agonists, and repealing Directives 81/602/EEC, 88/146/EEC and 88/299/EEC, Official Journal L, 1996, 125, 0003–0009 Search PubMed.
  4. F. Sai, M. Hong, Z. Yunfeng, C. Huijing and W. Yongning, J. Agric. Food Chem., 2012, 60, 1898–1905 CrossRef CAS PubMed.
  5. W. Haasnoot, A. Kemmers-Voncken and D. Samson, Analyst, 2002, 127, 87–92 RSC.
  6. P. Delahaut, M. Dubois, I. Pri-Bar, O. Buchman, G. Degand and F. Ectors, Food Addit. Contam., 1991, 8, 43–53 CrossRef CAS PubMed.
  7. P. Gallo, G. Brambilla, B. Neri, M. Fiori, C. Testa and L. Serpe, Anal. Chim. Acta, 2007, 587, 67–74 CrossRef CAS PubMed.
  8. P. Gonzalez, C. A. Fente, C. Franco, B. Vazquez, E. Quinto and A. Cepeda, J. Chromatogr. B: Biomed. Sci. Appl., 1997, 693, 321–326 CrossRef CAS.
  9. W. Liu, L. Zhang, Z. Wei, S. Chen and G. Chen, J. Chromatogr. A, 2009, 1216, 5340–5346 CrossRef CAS PubMed.
  10. C. Liu, W. Ling, W. Xu and Y. Chai, J. AOAC Int., 2011, 94, 420–427 CrossRef CAS PubMed.
  11. B. Shao, X. Jia, J. Zhang, Z. Jing, M. Juan, W. Yongning, D. Hejun and T. Xiaoming, Food Chem., 2009, 114, 1115–1121 CrossRef CAS.
  12. M. W. Nielen, J. J. Lasaroms, M. L. Essers, J. E. Oosterink, T. Meijer, M. B. Sanders, T. Zuidema and A. A. Stolker, Anal. Bioanal. Chem., 2008, 391, 199–210 CrossRef CAS PubMed.
  13. L. Q. Wang, Z. L. Zeng, X. F. Wang, J. W. Yang, Z. Chen and L. He, J. Sep. Sci., 2013, 36, 1843–1852 CrossRef CAS PubMed.
  14. C. Cote, A. Bergeron, J. N. Mess, M. Furtado and F. Garofolo, Bioanalysis, 2009, 1, 1243–1257 CrossRef CAS PubMed.
  15. S. Souverain, S. Rudaz and J. L. Veuthey, J. Chromatogr. A, 2004, 1058, 61–66 CrossRef CAS PubMed.
  16. R. Dams, M. A. Huestis, W. E. Lambert and C. M. Murphy, J. Am. Soc. Mass Spectrom., 2003, 14, 1290–1294 CrossRef CAS PubMed.
  17. B. K. Matuszewski, M. L. Constanzer and C. M. Chavez-Eng, Anal. Chem., 2003, 75, 3019–3030 CrossRef CAS PubMed.
  18. M. Lahaie, J. N. Mess, M. Furtado and F. Garofolo, Bioanalysis, 2010, 2, 1011–1021 CrossRef CAS PubMed.
  19. L. Q. Wang, Z. L. Zeng, Y. J. Su, G. K. Zhang, X. L. Zhong, Z. P. Liang and L. M. He, J. Agric. Food Chem., 2012, 60, 6359–6363 CrossRef CAS PubMed.
  20. N. van Hoof, D. Courtheyn, J. P. Antignac, M. van de Wiele, S. Poelmans, H. Noppe and H. De Brabander, Rapid Commun. Mass Spectrom., 2005, 19, 2801–2808 CrossRef CAS PubMed.
  21. L. Q. Wang, L. M. He, Z. Wang, X. F. Wang, J. H. Shu, J. W. Yang, G. K. Zhang and Z. L. Zeng, Analyst, 2013, 138, 4579–4584 RSC.
  22. Y. Tao, F. Zhu, D. Chen, H. Wei, Y. Pan, X. Wang, Z. Liu, L. Huang, Y. Wang and Z. Yuan, Food Chem., 2014, 150, 500–506 CrossRef CAS PubMed.
  23. K. Pietruk, M. Olejnik, P. Jedziniak and T. Szprengier-Juszkiewicz, J. Pharm. Biomed. Anal., 2015, 112, 50–59 CrossRef CAS PubMed.
  24. C. Guo, F. Shi, L. Gong, H. Tan, D. Hu and J. Zhang, J. Pharm. Biomed. Anal., 2015, 107, 526–534 CrossRef CAS PubMed.
  25. L. C. Huang, N. Zheng, B. Q. Zheng, F. Wen, J. B. Cheng, R. W. Han, X. M. Xu, S. L. Li and J. Q. Wang, Food Chem., 2014, 146, 242–249 CrossRef CAS PubMed.
  26. M. Martinez-Galera, T. Lopez-Lopez, M. D. Gil-Garcia, J. L. Martinez-Vidal, D. Picon-Zamora and L. Cuadros-Rodriguez, Anal. Bioanal. Chem., 2003, 375, 653–660 CAS.
  27. L. Cuadros-Rodriguez, A. M. Garcia-Campaña, E. Almansa-López, F. J. Egea-González, M. L. C. Cano, A. G. Frenich and J. L. Martinez-Vidal, Anal. Chim. Acta, 2003, 478, 281–301 CrossRef CAS.
  28. G. F. Egea, M. E. HernandezTorres, R. L. Cuadros, L. E. Almansa and V. J. Martinez, Analyst, 2002, 127, 1038–1044 RSC.
  29. J. A. Edmundson and A. Mazumder, Freshwater Biol., 2002, 47, 1–17 CrossRef.
  30. E. Torres, E. Bertolini, M. Cambra, C. Monton and M. P. Martin, Mol. Cell. Probes, 2005, 19, 334–340 CrossRef CAS PubMed.
  31. M. Martinez-Galera, T. Lopez-Lopez, M. D. Gil-Garcia, J. L. Martinez-Vidal, D. Picon-Zamora and L. Cuadros-Rodriguez, Anal. Bioanal. Chem., 2003, 375, 653–660 CAS.
  32. L. Q. Wang, Z. L. Zeng, Z. Wang, J. Y. Guo and L. M. He, Food Anal. Methods, 2015, 1–8 Search PubMed.
  33. I. Taverniers, E. van Bockstaele and M. De Loose, Anal. Bioanal. Chem., 2004, 378, 1198–1207 CrossRef CAS PubMed.
  34. G. Snedecor and W. Cochran, Statistical methods, Iowa State University Press, 6th edn, 1980 Search PubMed.
  35. P. J. Taylor, Clin. Biochem., 2005, 38, 328–334 CrossRef CAS PubMed.
  36. E. Rogatsky and D. Stein, J. Am. Soc. Mass Spectrom., 2005, 16, 1757–1759 CrossRef CAS PubMed.
  37. M. Fiori, C. Civitareale, S. Mirante, E. Magaro and G. Brambilla, Anal. Chim. Acta, 2005, 529, 207–210 CrossRef CAS.
  38. M. W. van Hout, H. A. Niederlander, R. A. de Zeeuw and G. J. de Jong, Rapid Commun. Mass Spectrom., 2003, 17, 245–250 CrossRef CAS PubMed.
  39. F. Moragues and C. Igualada, Anal. Chim. Acta, 2009, 637, 193–195 CrossRef CAS PubMed.
  40. M. Yadav, V. Trivedi, V. Upadhyay, G. Shah, G. A. Baxi, S. Goswami and P. S. Shrivastav, J. Chromatogr. B: Anal. Technol. Biomed. Life Sci., 2012, 885–886, 138–149 CrossRef CAS PubMed.
  41. O. A. Ismaiel, M. S. Halquist, M. Y. Elmamly, A. Shalaby and H. Thomas Karnes, J. Chromatogr. B: Anal. Technol. Biomed. Life Sci., 2008, 875, 333–343 CrossRef CAS PubMed.
  42. L. Alder, S. Luderitz, K. Lindtner and H. J. Stan, J. Chromatogr. A, 2004, 1058, 67–79 CrossRef CAS PubMed.
  43. J. Zrostlikova, J. Hajslova, J. Poustka and P. Begany, J. Chromatogr. A, 2002, 973, 13–26 CrossRef CAS PubMed.
  44. M. Stuber and T. Reemtsma, Anal. Bioanal. Chem., 2004, 378, 910–916 CrossRef PubMed.
  45. J. L. Martinez Vidal, F. J. Arrebola, A. Garrido Frenich, J. Martinez Fernandez and M. Mateu-Sanchez, Chromatographia, 2004, 59, 321–327 Search PubMed.
  46. J. L. Martinez Vidal, A. Garrido Frenich, T. Lopez Lopez, I. Martinez Salvado, L. Hajjaj El Hassani and M. Hassan Benajiba, Chromatographia, 2005, 61, 127–131 CAS.
  47. R. Romero Gonzalez, E. Pastor Montoro, J. L. MartıNez Vidal and A. Garrido Frenich, Rapid Commun. Mass Spectrom., 2006, 20, 2701–2708 CrossRef CAS PubMed.

Footnotes

Electronic supplementary information (ESI) available. See DOI: 10.1039/c5ra28050h
These authors contributed equally to this work.

This journal is © The Royal Society of Chemistry 2016
Click here to see how this site uses Cookies. View our privacy policy here.