Temperature and composition dependence of the density, viscosity and refractive index of binary mixtures of a novel gemini ionic liquid with acetonitrile

Xuzhao Yang*, Hao Song, Jun Wang* and Wenyuan Zou
Henan Provincial Key Laboratory of Surface and Interface Science, School of Material and Chemical Engineering, Zhengzhou University of Light Industry, Zhengzhou, China. E-mail: yangxz@zzuli.edu.cn; wangjun8828@sina.com

Received 29th December 2015 , Accepted 11th March 2016

First published on 14th March 2016


Abstract

A novel asymmetrical gemini ionic liquid, 1-(1-methypiperidinium-1-yl)hexane-(1-pyridinium)bi[bis(trifluoromethanesulfonyl)imide] ([MPiC6Py][NTf2]2) was synthesized and characterized by 1H NMR, 13C NMR and IR. Elemental analysis was performed on a Vario EL III instrument. Densities, viscosities and refractive indexes were measured for the binary mixture of [MPiC6Py][NTf2]2 with acetonitrile over the entire range of mole fractions at temperatures from T = (293.15 to 323.15) K under the atmospheric pressure of 0.1 MPa. Using the basic experimental data, the excess molar volumes (VEm), the viscosity deviations (Δη) and the refractive index deviations (ΔnD) for the binary systems were calculated and correlated to the Redlich–Kister polynomial to estimate coefficients and the standard deviation between the experimental and calculated values. The negative values of VEm and Δη result from strong self-association and weak hydrogen bonding interactions between the molecules of [MPiC6Py][NTf2]2 and acetonitrile. The values of ΔnD are all positive for the binary mixtures and increase with increasing temperature. The enthalpy, entropy and excess Gibbs energy of activation of the viscous flow of the binary mixtures also have been determined. The values of molar refraction and polarizability indicate that the dominant interactions between [MPiC6Py][NTf2]2 and acetonitrile are dipole–dipole molecular interactions. The obtained results are hoped to provide helpful information for the fundamental physicochemical properties of asymmetrical gemini ionic liquids and their further industrial applications.

1 Introduction

Ionic liquids (ILs) are a type of fluid charged semi-organic chemical normally composed entirely of a bulky asymmetric organic cations and either inorganic or organic anions at temperatures near or around ambient conditions.1–4 They have a multitude of attractive unique physicochemical properties, such as an extremely low vaporization pressure, wide liquidus ranges, remarkable intrinsic ion conductivity, favorable solvation behavior, excellent chemical and thermal stability, high heat capacity and cohesive energy density, and the ability to dissolve a variety of solutes.5 In addition, these amazing properties of ILs may be finely tailored towards desired properties and specific processes by simply varying the nature of considerable academic and industrial interest. Meanwhile, they have been extensively used in a plethora of research fields such as chemical synthesis, separation science, catalysts while combining their power as solvents, electrochemical processes, polymer systems, biotransformations, and chemical analysis.6–12 With the development of ILs, various kinds of novel ILs especially with special functional groups or properties have been endlessly designed and synthesized for their usage in industrial processes, for example, amino-based ILs, biodegradable ILs, and dicationic ILs.

Dicationic ILs (DILs), a novel kind of ILs consisting of two head groups combined with a spacer and two anions, exhibit superior physicochemical properties in terms of volatility, density and thermal stability compared with traditional monocationic ILs.13 Given the tunability of DILs, they are more suitable for use in science and engineering applications, in which ordinary ILs fail, such as high-temperature organic synthesis,14 chromatography stationary phases,15,16 and potential electrolyte additives.17 Like anything else in nature, DILs are not perfect and also possess some inconveniences. For instance, DILs tend to have higher melting points than common ILs, which may hamper their wide applications. Also, the viscosities especially for DILs are substantially higher than those of conventional monocationic ILs, which would consequently result in decreasing rates of mass transfer and increasing pumping costs. Experimental and theoretical efforts with the common purpose or goal of optimizing the properties of DILs while reducing their negative effects have been and continue to be made by incorporating bulky unsymmetrical or larger cations into the structure, together with relatively low symmetry, high flexibility, and a weakly coordinating anions to reduce the cohesive forces of the DILs and depress ion pairing (e.g. trifluoromethanesulfonate [TfO], bis(trifluoromethane)sulfonamide [NTf2], dicyanamide [N(CN)2]).18–20 Meanwhile, the preparations, characterizations and applications of various low-melting and low-viscous DILs were reported while our work was in progress.21

Despite their obvious importance and interest, the detailed physicochemical and thermodynamic properties of DILs and their mixtures with organic or inorganic molecular solvents necessary for the design of a wide variety of industrially important processes and future development of practical applications have not yet been systematically studied and are still very limited compared to traditional monocationic ILs, which will greatly restrict their further applications in practice. Therefore, there is certainly a clear need for systematic physicochemical and thermodynamic property data of DILs and their mixtures with molecular solvents, such as density, viscosity and refractive index. These data are important properties in multiple processes involving heat and mass transfer. Density and viscosity are specifically the key properties for process design and equipment options (e.g. mixing, separation and transportation). Refractive index can be account as a determination of electronic polarizability of molecule and provides information about intermolecular force. Additionally, the excess molar volume VEm, viscosity deviation Δη, and molar refractivity Rm are predominant parameters in the design of the technological processes of the separation or reaction.

In the present work, a novel asymmetrical gemini ionic liquid, 1-(1-methypiperidinium-1-yl)hexane-(1-pyridinium)bi[bis(trifluoromethanesulfonyl)imide] ([MPiC6Py][NTf2]2), combined with pyridine and 1-methylpiperidine by 1,6-dibromohexane with NTf2 as anion, was prepared and characterized. The density, viscosity and refractive index of [MPiC6Py][NTf2]2 and its binary mixture with acetonitrile (MeCN) were determined over the entire concentration range at the temperatures ranging from 293.15 K to 323.15 K under atmospheric pressure. The temperature dependence of the viscosity of pure [MPiC6Py][NTf2]2 was correlated by various empirical equations. The excess molar volume, viscosity deviation, and refractive deviation of the binary mixtures were respectively calculated and fitted to the Redlich–Kister type polynomial. Moreover, the excess Gibbs energy of activation of viscous flow, activation parameters, molar refraction, and polarizability were further determined so as to obtain a better understanding of the intermolecular interactions between [MPiC6Py][NTf2]2 and MeCN. To the best of our knowledge, this is the first time these thermodynamics properties of DIL in organic solvent have been reported.

2 Experimental details

2.1 Chemicals

High-grade pyridine (C5H5N, CASRN: 110-86-1), 1-methylpiperidine (C6H13N, CASRN: 626-67-5), 1,6-dibromohexane (C6H12Br2, CASRN: 629-03-8), lithium bis(trifluoromethane)sulfonimide (C2F6LiNO4S2, CASRN: 90076-65-6), and MeCN (C2H3N, CASRN: 75-05-8) were supplied by Aladdin Industrial Inc. All chemicals were used directly without further purification and their mass fractions are listed in Table 1.
Table 1 Chemical specifications
Chemical name CAS No. Purity (mass fraction) Source
1-Methylpiperidine 626-67-5 >0.990 Aladdin Industrial Inc., China
Pyridine 110-86-1 >0.990 Aladdin Industrial Inc., China
1,6-Dibromohexane 629-03-8 >0.990 Aladdin Industrial Inc., China
Lithium bis(trifluoromethane)sulfonimide 90076-65-6 >0.990 Aladdin Industrial Inc., China
Acetonitrile 75-05-8 >0.995 Aladdin Industrial Inc., China


The sample of [MPiC6Py][NTf2]2 was obtained according to Scheme 1 with mass fraction purity greater than 0.995 determined by high-performance liquid chromatography (type Waters 600E, Waters Co.). The typical preparation procedures can be described as follows: 1,6-dibromohexane (122.00 g, 0.50 mol) was magnetically stirred in a flask at 30 °C followed by the dropwise addition of pyridine (7.91 g, 0.10 mol) in 20 hours, and the mixture was stirred for 48 hours and then filtered. Resulting residue was washed thrice (3 × 50 mL) with ethyl acetate to remove any unreacted reactants and dried in vacuo. A white powder, 1-(1-bromohexyl)pyridinium bromide, was obtained (28.32 g, 87.66%). 1-(1-Bromohexyl)pyridinium bromide (28.32 g, 0.088 mol) was mixed with 1-methylpiperidine (8.73 g, 0.088 mol) in methanol and stirred at 60 °C for 15 h, and then methanol was rotary evaporated. The residue was washed thrice with ethyl acetate and dried in vacuo at 60 °C for 12 hours. A very hygroscopic white solid, [1-(1-pyridinium-yl-propyl)-1-methylpiperidinium]dibromide, was obtained (33.56 g, 90.32%). [1-(1-Pyridinium-yl-propyl)-1-methylpiperidinium] dibromide (33.56 g, 0.079 mol) was dissolved in 100 mL of deionized water. To the mixture 45.93 g (0.160 mol) of lithium bis(trifluoromethylsulfonyl)amide dissolved in 50 mL of deionized water was slowly added. The reaction mixture was left to stir for 24 hours at room temperature. The reaction mixture separated into a top aqueous phase and a bottom IL phase. The top phase was removed and the sample was washed with deionized water to remove residual halide until no residual halide was detected. The product was decolorized by stirring for 24 hours with activated charcoal and ethyl acetate, then gravity filtered and rotary evaporated. The resultant compound was dried in a high vacuum oven for 72 hours and yielded a clear colorless liquid (58.35 g, 89.78%).


image file: c5ra27934h-s1.tif
Scheme 1 Synthesis approaches of asymmetrical gemini ionic liquid ([MPiC6Py][NTf2]2).

The structure of [MPiC6Py][NTf2]2 was identified using 1H NMR (Bruker Avance 400 spectrometer), 13C NMR (Agilent 400 MR spectrometer), and IR (Tensor-27 FT-IR Spectrometer). 1H NMR (400 MHz, CD2Cl2): δ = 8.78 (t, 2H), 8.48 (dd, 1H), 8.01 (t, 2H), 4.56 (t, 2H), 3.23 (t, 6H), 2.93 (s, 3H), 1.99 (dd, 2H), 1.79 (m, 4H), 1.69 (m, 2H), 1.59 (m, 2H), 1.53 ppm (m, 4H). 13C NMR (100 MHz, DMSO-d6) δ = 145.5, 144.7, 128.1, 124.3, 121.1, 117.9, 114.7, 62.4, 60.9, 60.8, 60.1, 47.0, 30.5, 25.2, 25.0, 20.8, 20.6, 19.3 ppm. IR (KBr): 3030, 2940, 1638, 1490, and 685 cm−1. Elemental analysis was performed on a Vario EL III instrument (Elmentar Anlalysensy Teme GmbH, Germany). Calc. for [MPiC6Py][NTf2]2: C, 30.66; H, 3.68; N, 6.81%. Found: C, 30.63; H, 3.69; N, 6.80%. The water content was measured by Karl-Fischer Titration (Titro Line KF, Schott Instruments, Germany) showing that mass fraction of water was less than 0.001%. The sample of ionic liquid was stored in a black bottle under inert atmosphere.

Solutions of [MPiC6Py][NTf2]2 and MeCN were prepared gravimetrically using an analytical balance with an accuracy of ±1 × 10⁻⁴ g (type XS104, Mettler-Toledo Co.) in mass fraction by magnetic stirring. The mixtures were degassed using an ultrasonic bath to eliminate ubiquitous oxygen. No decomposition was observed at the experimental conditions.

2.2 Apparatus and procedure

Density measurements. Density (ρ) data of pure DIL and its binary mixtures with MeCN at atmospheric pressure were measured in a Rudolph DDM 2911 oscillating U-tube densitometer with viscosity correction and a reference oscillator in the temperature range from 293.15 K to 323.15 K. The accuracy and precision of the densitometer were ±0.00001 g cm−3 and the uncertainty of the measurements was estimated to be better than ±0.00005 g cm−3. The temperature of measurement cell was automatically thermostated within ±0.01 K. The apparatus was calibrated using clean dry ambient air, ultrapure water and tetrachloroethylene (PCE) at atmospheric pressure before each series of density measurements. Each experimental density value is the average of five measurements at one temperature. The comparison of experimental density of MeCN with the available literature data22–26 can been seen in Table 2.
Table 2 Comparison of experimental (exptl) density, viscosity, and refractive index of MeCN with literature (lit) values at temperatures from T = (293.15 to 323.15) Ka
Properties T/K exptl lit
a Standard uncertainties u are u(T) = 0.01 K, u(p) = 0.20 kPa, u(ρ) = 0.00005 g cm−3, u(η) = 0.00001 mPa, u(nD) = 0.0001 for the experimental data. N.A. = not available.b From ref. 22.c From ref. 23.d From ref. 24.e From ref. 25.f From ref. 26.g From ref. 27.h From ref. 28.i From ref. 29.
ρ/(g cm−3) 293.15 0.78120 0.78189b, 0.782005e, 0.7820f
303.15 0.77148 0.771487c, 0.7713d, 0.77112e
313.15 0.76077 0.760541c, 0.76020e, 0.7603f
323.15 0.74957 0.749449c, 0.7494d, 0.7492f
η/(mPa s) 293.15 0.35949 0.355b, 0.364c, 0.3645f
303.15 0.32141 0.332d, 0.3307f, 0.329h
313.15 0.29035 0.304d, 0.3005f, 0.300h
323.15 0.26348 0.279d, 0.2746f, 0.276h
nD 293.15 1.3429 1.3439b, 1.3409i
303.15 1.3394 1.3395g, 1.3392i
313.15 1.3348 1.3347g, 1.3260i
323.15 1.3297 N.A.


Viscosity measurements. Viscosity measurements were carried out with a suspended level Micro-Ubbelohde glass capillary viscometer of different diameters placed in water thermostat having temperature stability within 0.01 K and calibrated with water at various temperatures. Flow time of constant volume of liquid through capillary was determined by an electronic stopwatch with a resolution of 0.01 s and the average of at least six observations was used as the final efflux time. Before measurement, every capillary viscometer was calibrated with viscosity standard oil purchased from Cannon Instrument Company. The viscosities, η, of the solutions were calculated from the efflux time, t, using the following equation:
 
image file: c5ra27934h-t1.tif(1)
where ρ is the density of solution in g cm−3, a and b are viscometer constants.

The uncertainty of the viscosity measurements was estimated to be ±0.00001 mPa s. The experimental viscosity values of MeCN and the literature data22–24,26 are listed in Table 2.

Refractive index measurements. Refractive index measurements were performed by using an Abbe-type refractometer (type WYA-2W, Shanghai Cany Precision Instrument Co., Ltd.) with an uncertainty of ±0.0001. The apparatus is equipped with the exchangeable thermostated prisms. The temperature of the device was controlled by a super thermostatic water-circulator bath to within ±0.01 K. The refractometer was calibrated by ultrapure water and 1-bromonaphthalene. The experimental refractive index values of MeCN and the literature data22,28,29 are presented in Table 2.

3 Results and discussion

3.1 Volumetric properties

The density data measured for the binary mixture system of [MPiC6Py][NTf2]2 + MeCN at various temperatures over the entire composition range are presented in Table 3. The densities are highest for the pure DIL and decrease with the increasing MeCN content. The densities of the solutions decrease with temperature and the decrease in density is relatively more at higher concentration of [MPiC6Py][NTf2]2.
Table 3 Experimental density (ρ), excess molar volume (VEm), viscosity (η), viscosity deviation (Δη), refractive index (nD), refractive index deviation (ΔnD), and Gibbs energy of activation of viscous flow for binary liquid mixtures of [MPiC6Py][NTf2]2 (1) + MeCN (2) from T = (293.15 to 323.15) Ka
x1 ρ/(g cm−3) VEm/(cm3 mol−1) η/(mPa s) Δη/(mPa s) nD ΔnD ΔG*E/(kJ mol−1)
a Uncertainties are u(T) = 0.01 K, u(p) = 200 Pa, u(x) = 0.0001, u(ρ) = 1 × 10⁻⁵ g cm−3, u(η) = 1 × 10⁻⁵ mPa s, u(nD) = 0.0001, u(VEm) = 1 × 10⁻⁵ cm3 mol−1, uη) = 1 × 10⁻⁵ mPa s, unD) = 0.0001, and uG*E) = 1 × 10⁻⁵ kJ mol−1.
293.15 K
0.0000 0.78120 0.00000 0.36018 0.00000 1.3429 0.0000 0.00000
0.0999 1.18842 −1.27878 3.77731 −221.38512 1.4072 0.0536 4.58123
0.1986 1.32264 −1.51374 16.72706 −430.53728 1.4257 0.0615 6.49805
0.2991 1.38934 −1.37044 59.51720 −613.89956 1.4351 0.0601 7.58084
0.3947 1.42738 −1.16223 150.93800 −737.60483 1.4385 0.0533 7.79135
0.5761 1.47022 −0.79418 413.09050 −883.65180 1.4457 0.0410 6.11239
0.6021 1.47454 −0.73826 455.22373 −900.02566 1.4461 0.0387 5.73983
0.6950 1.48786 −0.58738 642.11598 −922.18375 1.4475 0.0301 4.37543
0.8029 1.49972 −0.35781 940.84093 −866.26322 1.4477 0.0187 2.70723
0.8876 1.50724 −0.18441 1337.77702 −659.92523 1.4490 0.0109 1.49996
1.0000 1.51556 0.00000 2250.63290 0.00000 1.4501 0.0000 0.00000
[thin space (1/6-em)]
303.15 K
0.0000 0.77213 0.00000 0.32168 0.00000 1.3394 0.0000 0.00000
0.0999 1.17994 −1.43798 2.91176 −105.13953 1.4043 0.0539 4.51327
0.1986 1.31422 −1.70185 11.78337 −202.70347 1.4231 0.0618 6.42273
0.2991 1.38082 −1.55273 38.48493 −284.37855 1.4328 0.0604 7.48507
0.3947 1.41888 −1.34912 90.56541 −335.39066 1.4364 0.0535 7.66513
0.5761 1.46156 −0.94443 226.46222 −395.11098 1.4441 0.0413 5.98834
0.6021 1.46575 −0.85604 247.00636 −402.60457 1.4447 0.0390 5.61848
0.6950 1.47906 −0.69366 336.41035 −413.38157 1.4463 0.0304 4.26613
0.8029 1.49095 −0.46152 473.89455 −392.25397 1.4469 0.0191 2.61249
0.8876 1.49842 −0.26334 654.25422 −303.23262 1.4484 0.0113 1.42385
1.0000 1.50656 0.00000 1078.69613 0.00000 1.4495 0.0000 0.00000
[thin space (1/6-em)]
313.15 K
0.0000 0.76089 0.00000 0.29040 0.00000 1.3348 0.0000 0.00000
0.0999 1.17092 −1.66710 2.33048 −54.69182 1.4014 0.0553 4.47305
0.1986 1.30626 −2.01753 8.68569 −104.38704 1.4208 0.0635 6.36778
0.2991 1.37358 −1.95230 26.31737 −143.82800 1.4304 0.0617 7.41108
0.3947 1.41135 −1.69539 58.12313 −166.31223 1.4345 0.0550 7.56838
0.5761 1.45388 −1.23158 134.42260 −193.02744 1.4422 0.0422 5.89164
0.6021 1.45815 −1.15724 146.04682 −196.16828 1.4431 0.0401 5.53635
0.6950 1.47113 −0.89093 192.70044 −202.27135 1.4451 0.0316 4.18983
0.8029 1.48304 −0.63560 261.56969 −194.67710 1.4458 0.0201 2.53886
0.8876 1.49039 −0.37495 352.25576 −152.09105 1.4468 0.0115 1.36728
1.0000 1.49832 0.00000 568.17730 0.00000 1.4480 0.0000 0.00000
[thin space (1/6-em)]
323.15 K
0.0000 0.74977 0.00000 0.26355 0.00000 1.3297 0.0000 0.00000
0.0999 1.16004 −1.78489 1.91330 −29.43898 1.3992 0.0579 4.46966
0.1986 1.29671 −2.25159 6.62565 −55.44192 1.4192 0.0665 6.35799
0.2991 1.36396 −2.15536 18.66656 −74.67646 1.4280 0.0637 7.37664
0.3947 1.40198 −1.91456 38.63442 −84.45917 1.4329 0.0575 7.49517
0.5761 1.44493 −1.50652 83.19818 −96.34682 1.4401 0.0437 5.82167
0.6021 1.44918 −1.42428 89.73506 −97.90110 1.4411 0.0417 5.47120
0.6950 1.46238 −1.20643 115.09545 −101.45105 1.4422 0.0321 4.13299
0.8029 1.47409 −0.88389 151.70161 −98.42321 1.4432 0.0206 2.49909
0.8876 1.48118 −0.52537 198.88518 −77.59815 1.4448 0.0124 1.33498
1.0000 1.48877 0.00000 311.46204 0.00000 1.4454 0.0000 0.00000


The change in density with temperature for the pure [MPiC6Py][NTf2]2 can be seen in Fig. 1. To the eye, [MPiC6Py][NTf2]2 does not expand appreciably from 293.15 to 323.15 K and this small volume expansion with temperature can be quantified by the volume expansivity α (a measure of how the volume changes with temperature, also known as the coefficient of thermal expansion) which is defined as:30

 
image file: c5ra27934h-t2.tif(2)
where V denotes the volume in cm3, ρ represents density in g cm−3, T is the thermodynamic temperature in K, and subscript p indicates constant pressure in Pa. As expected, a linear temperature dependence of density for pure [MPiC6Py][NTf2]2 can be observed. The volume expansivities can be easily determined from linear fits of the density data and are listed in Table 4. It can be seen that the values of α are in the range of 5–6 × 10⁻⁴ K−1, which are similar to those of traditional monocationic ionic liquids30 and significantly lower than most molecular organic solvents.


image file: c5ra27934h-f1.tif
Fig. 1 Density (ρ) for pure [MPiC6Py][NTf2]2 as a function of temperature. Linear correlation is plotted as solid lines.
Table 4 Volume expansivities α of pure [MPiC6Py][NTf2]2 from T = (293.15 to 323.15) K
T/K 104 α/K−1
323.15 6.4145 ± 0.0002
293.15 6.1837 ± 0.0002
313.15 5.9526 ± 0.0002
303.15 5.7214 ± 0.0002


The excess molar volume, VEm, expressed well the extent of deviation of mixtures from ideal behavior, which determined from the experimental density data using the following relationship:31

 
image file: c5ra27934h-t3.tif(3)
where x1 is mole fractions of [MPiC6Py][NTf2]2 in mixture, M1 and M2 are the molecular weights of [MPiC6Py][NTf2]2 and MeCN, and V1 and V2 are the molar volumes of [MPiC6Py][NTf2]2 and MeCN, respectively. The measured densities and excess molar volumes of binary mixtures of [MPiC6Py][NTf2]2 (1) + MeCN (2) at four temperatures are listed in Table 3.

The excess molar volume VEm can be correlated by Redlich–Kister type expression:32

 
image file: c5ra27934h-t4.tif(4)
where x1, x2 are the mole fraction of [MPiC6Py][NTf2]2 and MeCN, A0A3 are the Redlich–Kister parameters estimated by the least-square fit method and listed in Table 5. The standard deviation was calculated by the following equation:
 
image file: c5ra27934h-t5.tif(5)
where VEm exptl and VEm cal are respectively the experimental and calculated values in cm3 mol−1, D and N are the numbers of data points and parameters.

Table 5 Coefficients of Redlich–Kister equation and corresponding standard deviations (σ) for [MPiC6Py][NTf2]2 (1) + MeCN (2) from T = (293.15 to 323.15) K
T/K A0 A1 A2 A3 σ
VEm/(cm3 mol−1)
293.15 −3.65564 3.74397 −6.41633 6.28646 0.01387
303.15 −4.24759 4.18062 −7.36069 6.44843 0.02328
313.15 −5.55159 5.11980 −8.10525 6.27316 0.02712
323.15 −6.57549 4.49627 −9.11204 7.25889 0.01106
[thin space (1/6-em)]
Δη/(mPa s)
293.15 −3335.32313 −1549.19531 −2043.00882 −1889.95287 2.59487
303.15 −1498.85045 −623.27968 −1025.24727 −969.03335 1.03052
313.15 −734.56358 −270.31322 −563.60295 −533.00499 0.56003
323.15 −368.70013 −117.50451 −313.88116 −286.65988 0.30914
[thin space (1/6-em)]
ΔG*E/(kJ mol−1)
293.15 27.69612 −18.81804 5.58360 −4.69108 0.01722
303.15 27.21613 −18.88785 5.30832 −4.67287 0.01492
313.15 26.85284 −18.86103 5.15772 −4.90904 0.01361
323.15 26.57062 −18.90432 5.42388 −5.17331 0.01218
[thin space (1/6-em)]
ΔnD
293.15 0.17963 −0.13129 0.23199 0.03765 0.001364
303.15 0.18056 −0.13111 0.23538 0.03797 0.001375
313.15 0.18520 −0.13122 0.24387 0.03611 0.001308
323.15 0.19168 −0.13933 0.25773 0.04283 0.001551


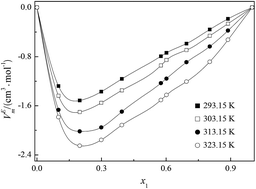
The graphical presentation of the excess molar volumes (VEm) for the system of [MPiC6Py][NTf2]2 (1) + MeCN (2) at various temperatures is plotted in Fig. 2. As can been seen from Fig. 2, the values of VEm for binary mixtures are negative over the entire composition range at all experimental temperatures, which indicates the presence of strong specific interactions in the binary mixtures of [MPiC6Py][NTf2]2 (1) + MeCN (2). The minimal values of VEm occurs at around 0.20 mol fraction of [MPiC6Py][NTf2]2. The values of VEm for a binary mixture containing two polar compounds can be interpreted qualitatively considering following effect: (i) expansion due to disruption of self-association in [MPiC6Py][NTf2]2 or MeCN, (ii) contraction due to specific interaction between [MPiC6Py][NTf2]2 and MeCN, (iii) contraction due to free volume difference of unlike molecules. Meanwhile, the interstitial accommodation and the effect of the condensation of [MPiC6Py][NTf2]2 and MeCN make further negative contributions to the values of VEm.


image file: c5ra27934h-f2.tif
Fig. 2 Excess molar volume VEm for the system of [MPiC6Py][NTf2]2 (1) + MeCN (2) at various temperatures: ■, 293.15 K; □, 303.15 K; ●, 313.15 K; ○, 323.15 K; solid line, Redlich–Kister correlation.

The large negative VEm values over the free volume contribution indicates free volume effect of differences in temperatures of the components, the packing efficiency of MeCN accommodation in the interstice of [MPiC6Py][NTf2]2 networks and the interaction of ion-dipole and hydrogen bonding are dominant in this binary mixtures.33 According to literatures,33,34 the absolute values of VEm for the binary mixture are the indicative to the difference in the packing efficiency and the interaction intensity. The values of VEm for [MPiC6Py][NTf2]2 + MeCN system are more negative than those of [BMPyr][NTf2] + MeCN system35 and [BMIM][NTf2] + MeCN binary mixture,36 which indicates the stronger interaction between [MPiC6Py][NTf2]2 and MeCN. Even if the volume of [MPiC6Py][NTf2]2 molecular lowers the packing efficiency leading to smaller absolute values of VEm, the higher polarity of [MPiC6Py][NTf2]2, however, enhances the interaction between cation of [MPiC6Py][NTf2]2 and MeCN. The strong interaction between non-hydrogen bonding polar solute and cation of ionic liquid by ion-dipole could lead to the larger absolute values of VEm.28

The excess molar volume (VEm) for the binary mixture of [MPiC6Py][NTf2]2 (1) + MeCN (2) becomes less negative with the increasing temperature, indicating volume expansion. The variation of VEm value with temperature is due to the competition of the hydrogen bonding interaction and packing efficiency in the binary mixture. In general, the increase of temperature reduces the hydrogen bonding leading to increase of VEm value, and correspondingly strengthens the packing efficiency which leads to decrease of VEm value.37 For the binary mixture of [MPiC6Py][NTf2]2 + MeCN, the variation of excess molar volume with temperature points out hydrogen bonding plays a dominant functional role in the change in value of VEm and the decrease in interaction between [MPiC6Py][NTf2]2 (1) + MeCN (2) molecules with increasing temperature.

3.2 Viscometric properties

The dynamic viscosities, η, for the binary mixtures of [MPiC6Py][NTf2]2 (1) + MeCN (2) at various temperatures over the entire concentration range were measured and listed in Table 3. The viscosity of pure [MPiC6Py][NTf2]2 as a function of temperature can be expressed in the following equations.

A common way is by using Arrhenius equation:

 
η = Ae(−B/RT) (6)
where A represents the viscosity at infinite temperature in mPa s, B is the activation energy for viscous flow in J mol−1, T is the thermodynamic temperature in K, and R is the universal gas constant (8.3145 J mol−1 K−1).

Temperature dependence of viscosity of pure [MPiC6Py][NTf2]2 could be also fitted to the Vogel–Tammann–Fulcher (VTF) equation:38

 
image file: c5ra27934h-t6.tif(7)
where T0 is related to the glass-transition temperature in K, and A (mPa s), B (K) are adjustable parameters.

A modification of VTF equation can be expressed as follows:39

 
image file: c5ra27934h-t7.tif(8)
where T0 is related to the glass-transition temperature in K, and A (mPa s) and B (K) are adjustable parameters.

Litovitz40 introduced an equation where the viscosity inverse cubic of the temperature:

 
image file: c5ra27934h-t8.tif(9)
where A is the viscosity at infinite temperature in mPa s, B is related to the activation energy of viscous flow in J K2 mol−1, and R is the universal gas constant (8.3145 J mol−1 K−1).

Ghatee41 recommended a equation where the fluidity (1/η) is linear correlated to temperature:

 
image file: c5ra27934h-t9.tif(10)
where A and B are substance dependent constants, φ is a characteristic exponent and φ = 0.300 can be universally applied.

The calculated values of parameters in eqn (6)–(10) for pure [MPiC6Py][NTf2]2 were listed in Table 6, together with squared correlation coefficient (R2). In accordance with the results, it can be seen that VTF and modified VTF equations are better available methods to correlate the viscosity data with temperature.

Table 6 Values of parameters and corresponding squared correlation coefficient (R2) of eqn (6)–(10) for the viscosity of pure [MPiC6Py][NTf2]2 from T = (293.15 to 323.15) K
Equation A B T0 R2
Arrhenius 1.2983 × 10⁻⁶ −5.1817 × 10⁴   0.9997
Litovitz 0.9453 −1.6299 × 10⁹   0.9998
Fluidity −0.6821 2.6592 × 10⁻³   0.9981
VTF 2.3942 × 10⁻³ −2.4625 × 10³ 1.1408 × 10² 0.9999
mVTF 7.9844 × 10⁻⁵ −2.6098 × 10³ 1.1080 × 10² 0.9999


Dynamic viscosities (η) of binary mixtures of [MPiC6Py][NTf2]2 (1) + MeCN (2) at various temperatures were determined by the measured density and efflux time of the mixture and listed in Table 3. The viscosity deviation, Δη, was calculated by using the following equation:42

 
Δη = η − (x1η1 + x2η2) (11)
where η, η1 and η2 are the dynamic viscosity of the binary mixtures, pure [MPiC6Py][NTf2]2 and MeCN in mPa s. The experimental values of Δη are presented in Table 3. Viscosity deviation can be also correlated by Redlich–Kister equation:
 
image file: c5ra27934h-t10.tif(12)
where x1 denotes the mole fraction of [MPiC6Py][NTf2]2 in the mixture, A0A3 are the Redlich–Kister parameters. Standard deviations for the viscosity calculations were obtained by eqn (13), similar to eqn (5):
 
image file: c5ra27934h-t11.tif(13)
where Δηexptl and Δηcal are respectively the experimental and calculated values of viscosity deviation in mPa s, D and N are the numbers of data points and parameters. The optimal parameters obtained by Redlich–Kister type polynomial at various temperatures in correlating the deviation of viscosity are listed in Table 5.

The composition and temperature dependence of viscosity deviation of the [MPiC6Py][NTf2]2 + MeCN mixture is plotted in Fig. 3. The values of viscosity deviation of the binary system are negative over the entire concentration range having their minimums at around 0.70 mol fraction of [MPiC6Py][NTf2]2. The viscosity deviation of mixture is the competition of molecular interaction and size. The viscosity deviations are negative, provided that the mixture is dominated by intermolecular force.33,43 In contrast, the values of viscosity deviation are positive when the mixture is dominated by hydrogen bonding interaction between [MPiC6Py][NTf2]2 and MeCN. According to the viscosity deviations shown in Fig. 3, the negative deviations may be attributed to strong self-association and weak hydrogen bonding interaction between the molecules of [MPiC6Py][NTf2]2 and MeCN. The viscosity deviations become less negative and more flat with increasing temperature, which suggested that the self-associating interactions become weaker and hydrogen bonding interactions become stronger. In addition, the observed compositions at the absolute maximum values of viscosity deviation were found to be almost constant.


image file: c5ra27934h-f3.tif
Fig. 3 Viscosity deviation Δη vs. mole fraction of [MPiC6Py][NTf2]2 in the binary mixture of [MPiC6Py][NTf2]2 (1) + MeCN (2) at various temperatures: ■, 293.15 K; □, 303.15 K; ●, 313.15 K; ○, 323.15 K; solid line, Redlich–Kister correlation.

On the basis of the theory of absolute reaction rates, excess Gibbs free energy (ΔG*E) of activation of the viscous flow can be determined by the following expression:42

 
image file: c5ra27934h-t12.tif(14)
where R is the universal gas constant (8.3145 J mol−1 K−1), T represents the absolute temperature in K, and V, V1 and V2 are respectively the molar volumes of the binary mixture, [MPiC6Py][NTf2]2, and MeCN. The experimental values of ΔG*E are listed in Table 3 and plotted in Fig. 4.


image file: c5ra27934h-f4.tif
Fig. 4 Excess Gibbs energy of activation ΔG*E vs. mole fraction of [MPiC6Py][NTf2]2 in the binary mixture of [MPiC6Py][NTf2]2 (1) + MeCN (2) at various temperatures: ■, 293.15 K; □, 303.15 K; ●, 313.15 K; ○, 323.15 K; solid line, Redlich–Kister correlation.

As is shown in Table 3 and Fig. 4, the calculated values of ΔG*E for the binary mixtures are positive over the entire composition range, and sign of ΔG*E values can be considered as a reliable criterion for detecting or excluding the presence of interaction between different molecules, which indicated the formation of intermolecular hydrogen bonding interactions between [MPiC6Py][NTf2]2 and MeCN.37

The values of ΔG*E of the viscous flow can be correlated by Redlich–Kister type polynomial:42

 
image file: c5ra27934h-t13.tif(15)
where x1, x2 are the mole fraction of [MPiC6Py][NTf2]2 and MeCN, A0A3 are the Redlich–Kister parameters estimated by the least-square fit method and listed in Table 5.

The activation thermodynamic parameters of the viscous flow, enthalpy (ΔH*) and entropy (ΔS*), were evaluated using eqn (16) on the basis of Eyring's theory approach to Andrade's theory:42

 
image file: c5ra27934h-t14.tif(16)
where η presents the viscosity of the binary mixture in mPa s, h denotes Planck's constant (6.62606896 × 10⁻³⁴ J s), NA is Avogadro's number (6.02214129 × 10²³), R is the universal gas constant (8.3145 J mol−1 K−1), and T is the absolute temperature in K.

When ln(ηV/hNA) is plotted against 1/T, the slope is equal to ΔH*/R and the intercept is equal to ΔS*/R, which are listed in Table 7. The results show that the values of ΔH* and ΔS* steadily increase with increasing concentration of [MPiC6Py][NTf2]2. The entropy change of activation from the initial state to the transition state at a given composition is small during the activated viscous flow process. The energetic contribution of enthalpy to the molar Gibbs energy of activation of viscous flow is lower than that of entropy to the molar Gibbs energy in the MeCN rich region and is higher in the [MPiC6Py][NTf2]2 rich region. Because of a significant degree of hydrogen bonding, there exists self-association in the pure state and strong cross association in their mixtures. The gradually increscent values of ΔS* show that the viscous flow is, on the whole, an ordered process involving contiguous liquid layers as they are self-associated via hydrogen bond and the existence of strong cross association in the corresponding binary mixtures, which retain their structural configuration even moving in a stationary steady state.44

Table 7 The activation parameters ΔH* and ΔS* of [MPiC6Py][NTf2]2 (1) + MeCN (2) mixtures from T = (293.15 to 323.15) Ka
x1 ΔH*/(kJ mol−1) ΔS*/(J K−1 mol−1) R2
a Uncertainties are u(x) = 0.0001, uH*) = 0.0001 kJ mol−1, and uS*) = 0.0001 J K−1 mol−1.
0.0000 7.1061 −180.2782 0.9998
0.0999 17.2171 −169.0982 0.9993
0.1986 23.7955 −162.5012 0.9995
0.2991 29.9441 −155.0317 0.9997
0.3947 35.2579 −146.7341 0.9997
0.5761 41.5575 −136.4473 0.9997
0.6021 42.0977 −135.7295 0.9997
0.6950 44.5962 −131.0732 0.9997
0.8029 47.3942 −125.8018 0.9997
0.8876 49.5031 −122.2742 0.9998
1.0000 51.3529 −121.1862 0.9998


3.3 Refractive properties

The experimental values of refractive index, nD, for the binary mixture of [MPiC6Py][NTf2]2 and MeCN at various temperatures over the entire composition range are shown in Table 3. Refractive index deviation, ΔnD, can be obtained by using the following equation:45
 
ΔnD = nDx1nD1x2nD2 (17)
where nD1, nD2 and nD are respectively the refractive indexes of [MPiC6Py][NTf2]2, MeCN and the binary mixture, also included in Table 3 and plotted in Fig. 5. From Table 3 and Fig. 5, it can be seen that the values of ΔnD are all positive for the binary mixtures over the entire range of compositions, and they increase with increasing temperature. The composition dependence of ΔnD of binary mixture of [MPiC6Py][NTf2]2 + MeCN at various temperatures could be correlated by Redlich–Kister type polynomial:
 
image file: c5ra27934h-t15.tif(18)
where x1 denotes the mole fraction of [MPiC6Py][NTf2]2 in the mixture, A0A3 are the Redlich–Kister parameters. Standard deviations for the refraction index calculations were obtained as follows:
 
image file: c5ra27934h-t16.tif(19)
where ΔnD,exptl and ΔnD,cal are respectively the experimental and calculated values of refractive index deviation, D and N are the numbers of data points and parameters. The optimal parameters obtained by Redlich–Kister type polynomial at various temperatures in correlating the deviation of refractive index are listed in Table 5.

image file: c5ra27934h-f5.tif
Fig. 5 Refractive index deviation ΔnD vs. mole fraction of [MPiC6Py][NTf2]2 in the binary mixture of [MPiC6Py][NTf2]2 (1) + MeCN (2) at various temperatures: ■, 293.15 K; □, 303.15 K; ●, 313.15 K; ○, 323.15 K; solid line, Redlich–Kister correlation.

In order to interpret these results, one must first consider the relationship between the refraction index of a compound and its molar refraction, Rm, calculated from the Lorenz–Lorentz equation:44

 
image file: c5ra27934h-t17.tif(20)
where V and nD are molar volume and refractive index of the binary mixture. The calculated values of Rm are shown in Table 8. The values of Rm in Table 8 are molecular quantities derived from bulk refractive indexes. The values of Rm increase with the increasing composition of [MPiC6Py][NTf2]2. The value of Rm is directly proportional to molecular polarizability which is related to the ability of molecular orbital to be impaired under an electrical field. The electric dipole moment of the molecules absolutely dominated the orientation.46 Since the refractive index is measured in the optical region, the polarizability (β) should not include orientational effects and the molar refraction should slightly depend on temperature. The polarizability of the binary mixture is determined by the following equation:47
 
image file: c5ra27934h-t18.tif(21)
where NA is Avogadro's number (6.02214129 × 10²³). Thus, the values of β can be determined and listed in Table 8. From Table 8, the values of β are weakly affected by temperature and increases with decreasing composition of MeCN in the binary mixtures.

Table 8 Molar refraction (Rm) and polarizability (β) of [MPiC6Py][NTf2]2 (1) + MeCN (2) mixtures from T = (293.15 to 323.15) Ka
x1 293.15 K 303.15 K 313.15 K 323.15 K
Rm/(cm3 mol−1) β × 1029/m3 Rm/(cm3 mol−1) β × 1029/m3 Rm/(cm3 mol−1) β × 1029/m3 Rm/(cm3 mol−1) β × 1029/m3
a Uncertainties are u(x) = 0.0001, u(T) = 0.01 K, u(Rm) = 1 × 10⁻⁵ cm3 mol−1, and u(β) = 1 × 10⁻³⁴ m3.
0.0000 1.10995 0.44001 1.11270 0.44110 1.11526 0.44212 1.11614 0.44246
0.0999 2.43980 0.96720 2.44190 0.96803 2.44512 0.96930 2.45609 0.97366
0.1986 3.74624 1.48510 3.75009 1.48663 3.75497 1.48856 3.77001 1.49453
0.2991 5.08427 2.01553 5.09207 2.01862 5.09414 2.01944 5.10508 2.02378
0.3947 6.33338 2.51071 6.34476 2.51522 6.35442 2.51905 6.37636 2.52774
0.5761 8.76063 3.47293 8.78509 3.48262 8.79869 3.48801 8.81665 3.49513
0.6021 9.10277 3.60856 9.13243 3.62032 9.15136 3.62782 9.17191 3.63597
0.6950 10.32770 4.09414 10.36500 4.10893 10.39651 4.12144 10.39963 4.12265
0.8029 11.72760 4.64911 11.77830 4.66921 11.81592 4.68410 11.82740 4.68868
0.8876 12.85550 5.09622 12.91620 5.12029 12.94561 5.13195 12.97551 5.14382
1.0000 14.34220 5.68560 14.41130 5.71298 14.44864 5.72779 14.46813 5.73553


The values of β for [MPiC6Py][NTf2]2 and MeCN are respectively 5.68560 × 10⁻²⁹ m3 and 4.4001 × 10⁻³⁰ m3 at 293.15 K, which strongly indicates that intermolecular forces such as dipole–dipole interaction forces are dominant in pure MeCN and dispersion forces are dominant in pure [MPiC6Py][NTf2]2. The dispersion forces exist between all molecules and are induced by instantaneous dipole and determined by the polarizability of the molecules. The polarizability depends on the total number of electrons and the volume over which they are spread. Therefore, voluminous solvents with a large index of refraction, and hence large polarizability, should be capable of employing particularly strong dispersion forces, being also good solvents for species possessing high polarizabilities.

4 Conclusions

Densities, viscosities and refractive indexes for the binary mixture of a novel asymmetrical gemini ionic liquid, [MPiC6Py][NTf2]2, with MeCN have been determined over the whole concentration range at T = (293.15 to 323.15) K and p = 0.1 MPa. The densities, viscosities and refractive indexes all increase with decreasing temperature and increasing concentration of [MPiC6Py][NTf2]2. The values of excess molar volumes and viscosity deviations are negative and those of refractive index deviations are positive over the complete composition range and at all investigated temperatures. The calculated negative values of excess molar volume and viscosity deviation indicate the existence of strong self-association and weak hydrogen bonding interaction between the molecules of [MPiC6Py][NTf2]2 and MeCN. The values of ΔnD are all positive for the binary mixtures and increase with increasing temperature. The Redlich–Kister type polynomial is applied to correlate the excess molar volumes, viscosity deviations and refractive index deviations. The enthalpy, entropy and excess Gibbs energy of activation of viscous flow of the binary mixtures of [MPiC6Py][NTf2]2 and MeCN were all calculated. The values of molar refraction and polarizability indicate that dipole–dipole molecular interactions are the dominant interactions.

Acknowledgements

This work was supported by the National Natural Science Foundation of China (No. 21176228), Science and Technology Planning Project of Henan Province (No. 132102210188), Foundation for University Key Teacher of Henan Province (No. 2013GGJS-108), and Science and Technology Research Projects of Zhengzhou City (No. 141PQYJS555).

Notes and references

  1. P. Wassercheid and T. Welton, Ionic liquids in Synthesis, Wiley-VCH Verlag, Germany, 2002 Search PubMed.
  2. H. Weingartner, Angew. Chem., Int. Ed., 2008, 47, 654–670 CrossRef PubMed.
  3. A. Corma, S. Iborra and A. Velty, Chem. Rev., 2007, 107, 2411–2502 CrossRef CAS PubMed.
  4. R. G. Azevedo, J. S. S. Esperanca, V. N. Visak, Z. P. Visak, H. J. R. Guedes, M. N. Ponte and L. P. N. Rebelo, J. Chem. Eng. Data, 2005, 50, 997–1008 CrossRef.
  5. M. Tariq, P. A. S. Forte, M. F. Coast Gomes, J. N. Canongia Lopes and L. P. N. Rebelo, J. Chem. Thermodyn., 2009, 41, 790–798 CrossRef CAS.
  6. H. Zhao, Z. Y. Song and O. Olubajo, Biotechnol. Lett., 2010, 32, 1109–1116 CrossRef CAS PubMed.
  7. L. Buriol, C. P. Frizzo, L. D. T. Prola, D. N. Moreira, M. R. B. Marzari, E. Scapin, N. Zanatta, H. G. Bonacorso and M. A. P. Martins, Catal. Lett., 2011, 141, 1130–1135 CrossRef CAS.
  8. S. Mallakpour and M. Dinari, Polym. Bull., 2009, 63, 623–635 CrossRef CAS.
  9. M. Munoz, C. M. Domínguez, Z. M. de Pedro, A. Quintanilla, J. A. Casas and J. J. Rodriguez, Catal. Today, 2015, 240, 16–21 CrossRef CAS.
  10. X. Z. Liang, RSC Adv., 2015, 5, 99448–99453 RSC.
  11. A. Hayashi, H. Morishima, K. Tadanaga and M. Tatsumisago, Solid State Ionics, 2011, 192, 126–129 CrossRef CAS.
  12. A. Riisagera, R. Fehrmanna and M. Haumannb, Top. Catal., 2006, 40, 91–102 CrossRef.
  13. J. L. Anderson, R. F. Ding, A. Ellern and D. W. Armstrong, J. Am. Chem. Soc., 2005, 127, 593–604 CrossRef CAS PubMed.
  14. X. Han and D. W. Armstrong, Org. Lett., 2005, 7, 4205–4208 CrossRef CAS PubMed.
  15. M. Qi and D. W. Armstrong, Anal. Bioanal. Chem., 2007, 388, 889–899 CrossRef CAS PubMed.
  16. K. Huang, X. Han, X. Zhang and D. W. Armstrong, Anal. Bioanal. Chem., 2007, 389, 2265–2275 CrossRef CAS PubMed.
  17. Z. X. Zhang, L. Yang, S. C. Luo, M. Tian, K. Tachibana and K. Kamijima, J. Power Sources, 2007, 167, 217–222 CrossRef CAS.
  18. T. Payagala, J. M. Huang, Z. S. Breitbach, P. S. Sharma and D. W. Armstrong, Chem. Mater., 2007, 19, 5848–5850 CrossRef CAS.
  19. Z. X. Zhang, H. Y. Zhou, L. Yang, K. Tachibana, K. Kamijima and J. Xu, Electrochim. Acta, 2008, 53, 4833–4838 CrossRef CAS.
  20. A. H. Jadhav, K. Lee, S. Koo and J. G. Seo, RSC Adv., 2015, 5, 26197–26208 RSC.
  21. J. Wang, M. M. Wang, X. Z. Yang, W. Y. Zou and X. Chen, Chin. J. Chem. Eng., 2015, 23, 816–821 CrossRef CAS.
  22. R. Majdan-Cegincara, M. T. Zafarani-Moattar and H. Shekaari, J. Mol. Liq., 2015, 203, 198–203 CrossRef CAS.
  23. F. C. Chen, Z. Y. Yang, Z. Y. Chen, J. H. Hu, C. Chen and J. X. Cai, J. Mol. Liq., 2015, 209, 683–692 CrossRef CAS.
  24. M. S. Rahman, M. A. Saleh, F. I. Chowdhury, M. S. Ahmed, M. M. H. Rocky and S. Akhtar, J. Mol. Liq., 2014, 190, 208–214 CrossRef CAS.
  25. M. Geppert-Rybczyńska, A. Heintz, J. K. Lehmann and A. Golus, J. Chem. Eng. Data, 2010, 55, 4114–4120 CrossRef.
  26. H. C. Ku and C. H. Tu, J. Chem. Eng. Data, 1998, 43, 465–468 CrossRef CAS.
  27. A. K. Nain, S. Ansari and A. Ali, J. Solution Chem., 2014, 43, 1032–1054 CrossRef CAS.
  28. J. Y. Wu, Y. P. Chen and C. S. Su, J. Solution Chem., 2015, 44, 395–412 CrossRef CAS.
  29. R. K. Shukla, A. Kumar, N. Awasthi, U. Srivastava and V. S. Gangwar, Exp. Therm. Fluid Sci., 2012, 37, 1–11 CrossRef CAS.
  30. Z. Y. Gu and J. F. Brennecke, J. Chem. Eng. Data, 2002, 47, 339–345 CrossRef CAS.
  31. V. K. Reddy, K. Rambabu, T. Devarajulu and A. Krishanaiah, J. Chem. Eng. Data, 1995, 40, 124–127 CrossRef CAS.
  32. J. J. Wang, Y. Tian, Y. Zhao and K. L. Zhuo, Green Chem., 2003, 5, 618–622 RSC.
  33. J. Chen, L. Chen and Y. Xu, J. Chem. Thermodyn., 2015, 88, 110–120 CrossRef CAS.
  34. A. L. Zhu, J. J. Wang and R. X. Liu, J. Chem. Thermodyn., 2011, 43, 796–799 CrossRef CAS.
  35. M. Geppert-Rybczyńska, J. K. Lehmann and A. Heintz, J. Chem. Thermodyn., 2014, 71, 171–181 CrossRef.
  36. M. Geppert-Rybczyńska and M. Sitarek, J. Chem. Eng. Data, 2014, 59, 1213–1224 CrossRef.
  37. M. Anouti, A. Vigeant, J. Jacquemin, C. Brigouleix and D. Lemordant, J. Chem. Thermodyn., 2010, 42, 834–845 CrossRef CAS.
  38. G. Tammann and W. Hesse, Z. Anorg. Allg. Chem., 1926, 156, 245–257 CrossRef.
  39. O. Ciocirlan and O. Iulian, J. Chem. Eng. Data, 2012, 57, 3142–3148 CrossRef CAS.
  40. T. A. Litovitz, J. Chem. Phys., 1952, 20, 1088–1089 CrossRef CAS.
  41. M. H. Ghatee, M. Zare, A. R. Zolghadr and F. Moosavi, Fluid Phase Equilib., 2010, 291, 188–194 CrossRef CAS.
  42. U. R. Kapadi, D. G. Hundiwale, N. B. Patil, M. K. Lande and P. R. Patil, Fluid Phase Equilib., 2001, 192, 63–70 CrossRef CAS.
  43. M. Anouti, J. Jacquemin and D. Lemordant, J. Chem. Eng. Data, 2010, 55, 5719–5728 CrossRef CAS.
  44. L. F. Sanz, J. A. González, I. G. D. L. Fuente and J. C. Cobos, J. Mol. Liq., 2012, 172, 26–33 CrossRef CAS.
  45. A. S. H. Branco, M. S. Calado, J. M. N. A. Fareleira, Z. P. Visak and J. N. C. Lopes, J. Solution Chem., 2015, 44, 431–439 CrossRef CAS.
  46. H. Shekaari, M. T. Zafarani-Moattar and S. N. Mirheydari, J. Chem. Eng. Data, 2015, 60, 1572–1583 CrossRef CAS.
  47. G. R. Sunkara, M. M. Tadavarthi, V. K. Tadekoru, S. K. Tadikonda and S. R. Bezawada, J. Chem. Eng. Data, 2015, 60, 886–894 CrossRef CAS.

This journal is © The Royal Society of Chemistry 2016
Click here to see how this site uses Cookies. View our privacy policy here.