
Silicon nanoparticles grown on a reduced graphene oxide surface as high-performance anode materials for lithium-ion batteries†
Aravindaraj G. Kannan,
Sang Hyung Kim,
Hwi Soo Yang and
Dong-Won Kim*
Department of Chemical Engineering, Hanyang University, Seoul 133-791, Republic of Korea. E-mail: dongwonkim@hanyang.ac.kr
First published on 1st March 2016
Abstract
The growth of silicon nanoparticles on a graphene surface without forming the unwanted silicon carbide (SiC) phase has been challenging. Herein, the critical issues surrounding silicon anode materials for lithium-ion batteries, such as electrode pulverization, unstable solid electrolyte interphase and low electrical conductivity, have been addressed by growing silicon nanoparticles smaller than 10 nm, covalently bonded to a reduced graphene oxide (rGO) surface. The successful growth of SiC-free silicon nanoparticles covalently attached to the rGO surface was confirmed by using various spectroscopic and microscopic analyses. The rGO–Si delivered an initial discharge capacity of 1338.1 mA h g−1 with capacity retention of 87.1% after the 100th cycle at a current rate of 2100 mA g−1, and exhibited good rate capability. Such enhanced electrochemical performance is attributed to the synergistic effects of combining ultra-small silicon nanoparticles and rGO nanosheets. Here, rGO provides a continuous electron conducting network, whereas, ultra-small silicon particles reduce ionic diffusion path length and accommodate higher stress during volume expansion upon lithiation.
Introduction
The growing demand for high-performance rechargeable batteries for applications such as electric vehicles and energy storage systems requires improvement in the energy density of current lithium-ion batteries.1 This requirement has led to a search for materials with high theoretical specific capacity and natural abundance for large-scale applications. Silicon-based anode materials with high theoretical capacity, low reduction potential and low cost satisfy these requirements for next-generation lithium-ion batteries.2 However, silicon materials undergo large volume changes during the lithium alloying and de-alloying reactions, resulting in electrode pulverization.3,4 In addition, the large volume changes result in continuous breakdown and formation of a solid electrolyte interphase (SEI) layer during repeated cycling.5 Coupled with the low intrinsic electrical conductivity of silicon, these problems led to significant capacity fading and low coulombic efficiency, thereby limiting the practical use of silicon materials.Various strategies have been adopted to mitigate these problems, including controlling the particle size and morphology,6,7 alloying with inert metals,8,9 utilizing self-healing binders,10 and embedding silicon in a conductive matrix.11,12 Among these approaches, silicon nanostructures modified with carbon showed an overall improved electrochemical performance as anode materials in lithium-ion batteries. In particular, graphene nanosheets with two-dimensional and sp2-hybridized carbon structures have been widely explored as the conductive matrix in energy storage devices, because they possess many unique properties, including excellent electronic conductivity, high surface area, superior mechanical strength and chemical stability.13 The presence of graphene nanosheets in silicon composites enhances electrical conductivity and buffers the pulverization of silicon upon lithiation.14,15 In previous works, graphene has been physically mixed with silicon nanoparticles to obtain silicon–graphene nanocomposites.16–19 Another strategy used to prepare silicon–graphene composites includes functionalization of silicon particles with positively charged short-chain molecules followed by self-assembly with graphene oxide (GO) through electrostatic interaction.20–23 Xin et al. prepared a 3-D porous architecture of Si–graphene nanocomposites with silicon firmly riveted on the graphene nanosheets through covalent interactions.14 Similarly, Zhu et al. synthesized silica nanoparticles of approximately 30 nm size that were uniformly deposited on a GO surface using the sonochemical method24 followed by reduction with a magnesiothermic reduction process.25–29 However, reduction of silica in presence of graphene using these methods may form the unwanted silicon carbide (SiC) phase in the graphene–silicon interface, which is detrimental to the silicon anode performance due to its insulating and electrochemically inactive nature.30 Therefore, SiC-free hybrids need to be synthesized for improved electrochemical performance. Moreover, control of silicon particle size is also a critical factor for enhancing the electrochemical performance of silicon-based anode materials.31–33 Thus, the direct growth of ultra-small silicon nanoparticles on a graphene surface without forming the unwanted silicon carbide phase has been very challenging.
In this work, ultra-small silicon nanoparticles of smaller than 10 nm size were directly grown on both sides of a reduced graphene oxide (rGO) surface using a two-step synthesis method, as illustrated in Fig. 1. In the first step, silica (SiO2) nanoparticles were directly grown on the GO surface using a sol–gel method, followed by a magnesiothermic reduction process to reduce both silica nanoparticles and GO simultaneously. Here, magnesiothermic reduction process was chosen due to its low reaction temperature (650 °C) in comparison to the traditional carbothermic reduction process. The magnesiothermic reaction temperature is much lower than the melting point of silicon (1410 °C), which can prevent the melting and fusion of silicon and enable the preservation of nano-structured morphology. Sodium chloride was used as a heat scavenger in the second step to prevent condensation of silicon nanoparticles and suppress formation of SiC as an impurity phase during the exothermic reaction of magnesium metal.34 The covalent attachment of ultra-small silicon nanoparticles to rGO without forming SiC phase prevented detachment of silicon nanoparticles from graphene nanosheets during cycling, which resulted in improved electrochemical performance as an anode material in lithium-ion cells.
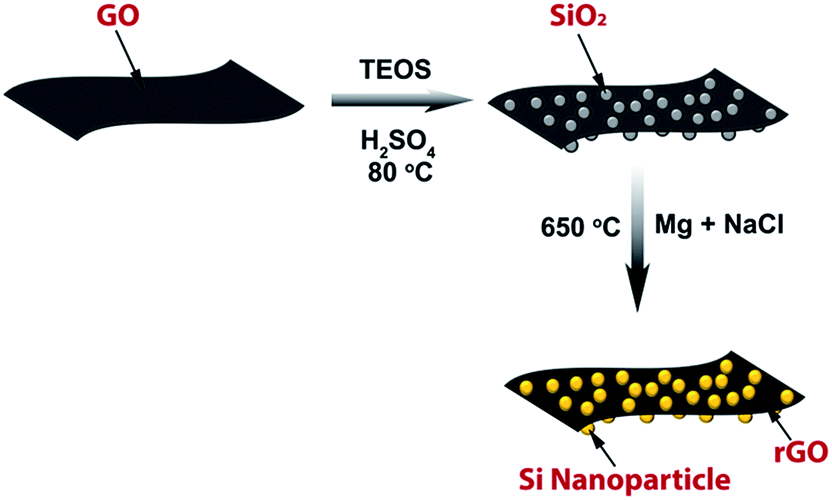 | ||
| Fig. 1 Schematic illustration of the rGO–SiNaCl synthesis using a two-step method. Silica nanoparticles were grown on GO surface using a sol–gel method followed by magnesiothermic reduction to form rGO–SiNaCl. | ||
Experimental
Growth of silicon nanoparticles on graphene surface
GO was prepared by exfoliating graphite oxide, which has been synthesized from graphite powder (SP-1, Bay Carbon, USA) using a modified Hummer's method. In the first step, pre-oxidation was carried out as previously reported.35 This was followed by oxidation using the modified Hummer's method in the subsequent step.36 Silica nanoparticles on GO (GO-SiO2) were synthesized by modifying the method reported in a previous literature.37 In a typical synthesis, 50 mL of GO dispersion (1.6 mg mL−1) in DI water was poured into 700 mL of ethanol and stirred vigorously at 80 °C. A mixture of sulfuric acid (1.5 mL) and tetraethylorthosilicate (TEOS, 3.6 mL) in 50 mL of ethanol was added to the solution and stirred vigorously for 24 h. The resulting product was centrifuged and washed with ethanol and DI water several times. The prepared GO–SiO2 was reduced in the subsequent step using magnesiothermic reduction method. Typically, 200 mg of GO–SiO2 was mixed well with 2 g of sodium chloride and 0.2 g of magnesium powder in a glove box under an argon atmosphere. The mixture was heated at 650 °C in a tube furnace for 2 h under argon gas flow. The resulting powder was washed with 1 M hydrochloric acid solution. Reduced graphene oxide–silicon nanoparticles (rGO–SiNaCl) were then obtained by filtering and washing with DI water until the pH became neutral. As a control sample, the reduced graphene oxide–silicon nanoparticles (rGO–Si) sample was prepared using the same synthetic procedure without NaCl in the second step.Electrode preparation and cell assembly
The rGO–SiNaCl electrode was prepared by coating N-methyl-2-pyrrolidone (NMP)-based slurry containing rGO–SiNaCl, super P carbon (MMM Co.) and poly(amide imide) binder (75![[thin space (1/6-em)]](https://www.rsc.org/images/entities/char_2009.gif) :13:12 by weight) onto a Cu foil. The electrode was dried under a vacuum for 12 h at 80 °C and further thermally treated at 350 °C for 1 h in argon gas to enhance particulate contact and adhesion to the current collector. The rGO–SiNaCl loading in the electrode was approximately 1.0 mg cm−2. The lithium electrode consisted of 100 μm-thick lithium foil (Honjo Metal Co., Ltd.) pressed onto a copper current collector. A CR2032-type coin cell composed of a lithium electrode, a polypropylene separator (Celgard 2400), and an rGO–SiNaCl electrode was assembled with a liquid electrolyte. The liquid electrolyte was 1.15 M LiPF6 in ethylene carbonate (EC)/diethyl carbonate (DEC) (1:1 by volume, battery grade, Soulbrain Co. Ltd.). All cells were assembled in a glove box filled with argon gas.
:13:12 by weight) onto a Cu foil. The electrode was dried under a vacuum for 12 h at 80 °C and further thermally treated at 350 °C for 1 h in argon gas to enhance particulate contact and adhesion to the current collector. The rGO–SiNaCl loading in the electrode was approximately 1.0 mg cm−2. The lithium electrode consisted of 100 μm-thick lithium foil (Honjo Metal Co., Ltd.) pressed onto a copper current collector. A CR2032-type coin cell composed of a lithium electrode, a polypropylene separator (Celgard 2400), and an rGO–SiNaCl electrode was assembled with a liquid electrolyte. The liquid electrolyte was 1.15 M LiPF6 in ethylene carbonate (EC)/diethyl carbonate (DEC) (1:1 by volume, battery grade, Soulbrain Co. Ltd.). All cells were assembled in a glove box filled with argon gas.
Characterization and measurements
The morphologies of the prepared samples were examined using field emission scanning electron microscopy (FE-SEM, JEOL JSM 6701F) equipped with energy dispersive X-ray spectroscopy (EDS) and transmission electron microscopy (TEM, JEOL, JEM 2100F). Silicon-based hybrid materials were further characterized to investigate the quality of the graphene using Raman spectroscopy (Dongwoo Optron, MonoRa 780i). The simultaneous reduction of GO during magnesiothermic reduction was confirmed using X-ray photoelectron spectroscopy (XPS, VG multilab ESCA system, 220i). X-ray diffraction (XRD) patterns of GO, GO–SiO2 and rGO–SiNaCl were obtained using an X-ray diffractometer (Rigaku DMAX/2500) with Cu Kα radiation. Cyclic voltammetry (CV) measurements were carried out using a potentiostat (Zahner Electrik IM6) on the rGO–SiNaCl electrode, with the counter and reference electrodes of lithium metal at a scanning rate of 2.0 mV s−1. Charge and discharge cycling tests of the Li/rGO–SiNaCl cells were conducted at different current rates over a voltage range of 0.005–1.5 V using battery testing equipment (WBCS 3000, Wonatech). The initial formation cycles were carried out at 100 mA g−1 prior to the cycling test. Specific capacities were calculated based on the rGO–SiNaCl weight in the electrode unless otherwise specified. All the electrochemical measurements were carried out at 25 °C.Results and discussion
Fig. 1 schematically illustrates the growth of silicon nanoparticles on a graphene surface using a simple sol–gel method followed by magnesiothermic reduction. During the sol–gel reaction, hydrolyzed TEOS molecules are directed towards the defect sites created by oxygen functional groups in GO through electrostatic interactions. These defect sites act as nucleation sites for the formation of Si–O–C bonds, aiding the growth of silica nanoparticles.An SEM image of GO–SiO2 and its corresponding elemental mappings of silicon, carbon, and oxygen are given in Fig. 2. The uniform distribution of these elements throughout the sample indicates that silica nanoparticles are uniformly grown on the GO surface in the first step. The SEM EDS spectrum of GO–SiO2 shown in Fig. S1† confirms the predominant presence of silicon and oxygen with a minor peak corresponding to carbon. In the second step, the formed GO–SiO2 sample was reduced using magnesiothermic reduction at 650 °C to form rGO–SiNaCl. SEM images of the rGO–SiNaCl given in Fig. 3(a) and (b) show the uniform and dense growth of nanoparticles on both sides of the graphene surface. The SEM-EDS spectrum of rGO–SiNaCl given in Fig. S2† shows the predominant presence of silicon, whereas small amount of carbon is detected. From SEM-EDS results, the silicon, carbon and oxygen contents in the rGO–SiNaCl sample were determined to be 75.8, 20.9, and 3.3 wt%, respectively. The predominant presence of silicon in the rGO–SiNaCl sample indicates that the particle-like structures observed on the surface of the graphene sheets correspond to silicon nanoparticles. The presence of a negligible amount of oxygen in the rGO–SiNaCl sample confirms simultaneous reductions of SiO2 and GO during the magnesiothermic reduction step. The reduction of GO during magnesiothermic reaction was confirmed using XPS analysis of rGO (Fig. S3†), which was prepared by the same reduction procedure in the absence of silica nanoparticles on GO surface. The relative intensity of oxygen peak in rGO was highly reduced after magnesiothermic reduction in comparison to the GO sample. The ratio of C/O in GO and rGO was found to be 2.21 and 9.75, respectively, indicating that GO is simultaneously reduced along with the reduction of silica during the magnesiothermic reduction process.
 | ||
| Fig. 2 (a) SEM image of the GO–SiO2 hybrid and its corresponding EDS elemental mappings of (b) Si, (c) C and (d) O. | ||
 | ||
| Fig. 3 (a) Low and (b) high magnification SEM images of rGO–SiNaCl showing the growth of nanoparticles on both sides of the rGO nanosheets. | ||
The morphology of the rGO–SiNaCl sample was further characterized using TEM analysis. The TEM images shown in Fig. 4(a) and (b) show the uniform and dense growth of silicon nanoparticles on both sides of the rGO surface. Silicon nanoparticle size was determined to be smaller than 10 nm. In contrast, silicon nanoparticles obtained using a similar synthetic procedure without sodium chloride resulted in aggregated structures with much bigger particle size, as shown in Fig. S4.† This result can be attributed to the fact that NaCl absorbs excess local heat generated by the exothermic reaction of magnesium metal and prevents condensation of silicon nanoparticles.34 It is noticeable that no free silicon particles are observed in the TEM images, indicating that any free silicon particles are completely removed during washing after the sol–gel reaction. The rGO nanosheets show a folded morphology, which is characteristic of rGO due to the presence of residual defect sites on the graphene basal plane. The folded structure shown in the HRTEM image (Fig. 4(c)) demonstrates the presence of few-layered rGO sheets (less than 10 layers), indicating that the graphene sheets are well exfoliated. This result is ascribed to the presence of silicon nanoparticles on the rGO surface, which prevents the sheets from restacking during high temperature reduction. Lattice spacing of 0.31 nm corresponds to the (111) plane of silicon, confirming the presence of crystalline silicon nanoparticles attached to rGO nanosheets. Selected area electron diffraction (SAED) pattern of rGO–SiNaCl sample given in Fig. 4(d) shows the characteristic reflections of crystalline silicon (JCPDS no. 27-1402). In case of rGO–Si prepared without NaCl in the second step, the HRTEM image and the corresponding line profiles in Fig. S4(b)–(d)† indicate the presence of silicon carbide impurity phase in addition to the silicon particles in the hybrid. During the magnesiothermic reduction process of silica in presence of graphene nanosheets, the massive heat released from the exothermic reaction of magnesium metal could increase the local reaction temperature as high as 1720 °C.30 Such a high temperature facilitated the reaction of surface oxide-stripped silicon with carbon in graphene to form SiC phase. SiC is insulating in nature and shows inferior electrochemical activity. Accordingly, the presence of SiC phase exerts a negative influence on the electrochemical performance of silicon electrodes, and it should be removed. In contrast, when NaCl was used in the second step, the excess heat produced by the reaction of magnesium metal was scavenged by the fusion of NaCl crystals. The melting of NaCl crystals began at 801 °C and consumed the excess heat generated, thereby effectively dissipated the excess heat and prevented further temperature rise. This heat scavenging by NaCl effectively prevented the formation of SiC phase. Based on these results, we conclude that the addition of NaCl during magnesiothermic reduction plays a dual-role of not only controlling particle size, but also suppressing the formation of SiC.
 | ||
| Fig. 4 TEM images of (a) low- and (b) high-magnification rGO–SiNaCl hybrid showing the uniform and dense growth of silicon nanoparticles on the rGO surface. (c) HRTEM image of rGO–SiNaCl showing the lattice fringes corresponding to crystalline silicon. The folded rGO region indicates 8 layers of graphene sheets. (d) A SAED pattern of rGO–SiNaCl sample showing the characteristic reflections of crystalline silicon. | ||
To examine the crystalline structure of synthesized materials, the XRD patterns of graphite oxide, GO–SiO2, and rGO–SiNaCl are given in Fig. 5(a). The graphite oxide sample shows an intense and sharp peak at 10.5°, which corresponds to the interlayer spacing of 0.84 nm. This indicates that the oxygen functional groups in graphite oxide increase d-spacing, since the interlayer distance of the nearest graphene sheets in graphite is 0.335 nm. In the GO–SiO2 sample, a broad and low-intensity peak is observed around 23°, which implies the presence of well exfoliated graphene nanosheets. The absence of other diffraction peaks suggests that the silica particles are amorphous in nature. In the XRD pattern of the rGO–SiNaCl sample, sharp peaks corresponding to silicon with a cubic structure (JCPDS no. 27-1402) are observed. The peaks at 28.4°, 47.2°, and 56.1° are attributed to the crystal planes of (111), (220), and (311), respectively.38,39 When NaCl was not used as a heat scavenger in the magnesiothermic reduction process, the XRD pattern of rGO-Si (Fig. S5†) shows additional crystalline peaks corresponding to SiC.24 This result further confirms that the presence of NaCl as a heat scavenger suppresses the formation of SiC impurity phase during the magnesiothermic reduction step. In order to understand the structure and quality of the graphene nanosheets, the rGO–SiNaCl sample was characterized by Raman spectroscopy. Raman spectra of the GO and rGO–SiNaCl samples given in Fig. 5(b) show characteristic D and G bands. The D band corresponds to the local basal plane derivatization that creates sp3 distortion, and the G band arises from sp2-hybridized graphitic carbon atoms. The intensity ratio of the D to G bands (ID/IG) indicates the extent of defects in the graphene nanosheets. In Fig. 5(b), the ID/IG ratios are 0.98 and 1.10 for GO and rGO–SiNaCl, respectively. Although the oxygen functional groups in GO were removed during the reduction step, ID/IG increased for the rGO–SiNaCl sample. This result suggests that silicon nanoparticles interact with rGO sheets, thereby generating more defects in the rGO–SiNaCl sample. Raman spectrum of rGO–SiNaCl shows a main peak at 510 cm−1, which corresponds to crystalline silicon nanoparticles. The minor peak at 940 cm−1 is attributed to an amorphous phase Si–Si stretching.40 The presence of a broad 2D band around 2700 cm−1 indicates the predominant presence of a mixture of single- and few-layer rGO nanosheets in the rGO–SiNaCl samples. This result is consistent with the XRD and HRTEM results that the rGO nanosheets are well exfoliated. To determine the type of interactions between the rGO and silicon nanoparticles, the FTIR spectra of the GO, GO–SiO2, and rGO–SiNaCl samples were obtained, as shown in Fig. 5(c). The GO sample shows characteristic peaks corresponding to various oxygen configurations on the basal plane and on the edges of the GO. The GO–SiO2 sample shows new peaks corresponding to Si–O–Si bonds, indicating that silica nanoparticles successfully grew on the GO surface. The presence of a minor peak at 951 cm−1 corresponds to the silanol groups, indicating that a small amount of Si–OH groups remain uncondensed. However, silanol would condense in the further reduction step at elevated temperatures. Another important difference between GO–SiO2 and GO is the disappearance of a peak at 1740 cm−1 corresponding to the C![[double bond, length as m-dash]](https://www.rsc.org/images/entities/char_e001.gif) O group. This is attributed to the formation of covalent bonds through esterification between the hydroxyl groups in the silica precursors and the carboxyl groups in the GO.41 The rGO–SiNaCl spectrum showed the disappearance of peaks corresponding to the Si–O–Si bonds at 794 cm−1 and 453 cm−1. This result confirms that silica is successfully reduced to silicon in the magnesiothermic reduction step. The broad peak centered at 1080 cm−1, which is also present in GO–SiO2 (albeit with a different peak shape), is attributed to both the Si–O–C bonds and the Si–O–Si bonds. Since the peaks corresponding to Si–O–Si in other regions disappear, the peak at 1080 cm−1 in the rGO–SiNaCl sample is assigned to the Si–O–C bonds. The disappearance of CO group and the formation of Si–O–C bond confirms covalent interactions between the silicon and rGO nanosheets. Thus, these results demonstrate successful growth of ultra-small silicon nanoparticles covalently attached on both sides of rGO surface (Fig. 5(d)).
O group. This is attributed to the formation of covalent bonds through esterification between the hydroxyl groups in the silica precursors and the carboxyl groups in the GO.41 The rGO–SiNaCl spectrum showed the disappearance of peaks corresponding to the Si–O–Si bonds at 794 cm−1 and 453 cm−1. This result confirms that silica is successfully reduced to silicon in the magnesiothermic reduction step. The broad peak centered at 1080 cm−1, which is also present in GO–SiO2 (albeit with a different peak shape), is attributed to both the Si–O–C bonds and the Si–O–Si bonds. Since the peaks corresponding to Si–O–Si in other regions disappear, the peak at 1080 cm−1 in the rGO–SiNaCl sample is assigned to the Si–O–C bonds. The disappearance of CO group and the formation of Si–O–C bond confirms covalent interactions between the silicon and rGO nanosheets. Thus, these results demonstrate successful growth of ultra-small silicon nanoparticles covalently attached on both sides of rGO surface (Fig. 5(d)).
 | ||
| Fig. 5 (a) XRD patterns of graphite oxide, GO–SiO2 and rGO–SiNaCl. (b) Raman spectra of GO and rGO–SiNaCl. (c) FTIR spectra of GO, GO–SiO2 and rGO–SiNaCl. (d) Schematic illustration of the magnesiothermic reduction process demonstrating the role of NaCl as a heat scavenger. | ||
Fig. 6(a) shows cyclic voltammograms of the rGO–SiNaCl electrode in the potential range of 0.005 to 1.5 V at a scan rate of 2 mV s−1. An irreversible reductive current was observed from 1.1 to 0.42 V in the first cycle, which disappeared in the second cycle. This result indicates that the reductive decomposition of liquid electrolyte in subsequent cycles was suppressed by the SEI layer formed in the first cycle. The cathodic scan of the second cycle showed a main peak at 0.05 V and a shoulder peak at 0.21 V, which is attributed to the formation of Li–Si alloy phases. The anodic scan exhibited two broad peaks at 0.32 and 0.51 V, which correspond to the de-alloying reaction of Li–Si alloys.42,43 The redox peaks in the second and third cycle are similar, indicating high reversibility of the rGO–SiNaCl electrode. Fig. 6(b) shows the formation charge and discharge curves of the rGO–SiNaCl electrode, which was obtained at a current rate of 100 mA g−1 in the potential range of 0.005 to 1.5 V. The rGO–SiNaCl electrode exhibited typical charge and discharge profiles that correspond to alloying (forming LixSi) and de-alloying (regenerating Si) reactions, respectively. During the first charge, the curve shows reductive activity from 1.1 V, which is well consistent with the CV result. The main plateau during the charge process is observed around 0.15 V, which is attributed to the alloying reaction of silicon with lithium ions. The specific capacities during charge and discharge in the first formation cycle are 2949.4 and 1902.1 mA h g−1, respectively. Low coulombic efficiency in the first cycle can be attributed to SEI layer formation, lithiation of native oxide, and the large surface area of rGO nanosheets.27 The subsequent formation cycle resulted in a discharge capacity of 1850.4 mA h g−1 with a coulombic efficiency of 85.8%. This result indicates that a stable SEI layer is formed by electrolyte decomposition in the first cycle, which results in an increase of coulombic efficiency in the second cycle. The cycling performance of the rGO–SiNaCl electrode after two formation cycles was further evaluated at a current rate of 2100 mA g−1 in the voltage range of 0.005 to 1.5 V, and the results are given in Fig. 6(c). The rGO–SiNaCl electrode delivered a discharge capacity of 1338.1 mA h g−1 (based on the rGO–SiNaCl material in the electrode) at the first cycle after the formation process. The rGO–SiNaCl electrode exhibited stable cycling characteristics, and it delivered 87.1% of the initial discharge capacity after 100 cycles. The specific capacity based on the weight of silicon loaded in the electrode at the 100th cycle was calculated to be 1514.3 mA h g−1silicon. The coulombic efficiency of the cell steadily increased and was maintained at higher than 99.0% through cycling after the initial cycles. Such high coulombic efficiency and good capacity retention indicate that the rGO–SiNaCl electrode is highly reversible with a stable SEI layer formed on the electrode surface. In addition, covalent bonding of silicon nanoparticles on graphene could prevent the segregation of silicon upon volume expansion/contraction, resulting in enhanced cycling performance.44 On the other hand, the rGO–Si electrode prepared without using NaCl as a heat scavenger showed inferior cycling performance (Fig. S6†) in comparison to the rGO–SiNaCl electrode. The specific capacity decreased drastically in the first 30 cycles and stabilized at around 810 mA h g−1 in the subsequent cycles. The specific capacity when calculated based on the weight of silicon in the hybrid is about 1052 mA h g−1 at the 100th cycle, which is only about 69% of the capacity achieved using rGO–SiNaCl electrode without SiC phase. This result demonstrates the negative influence of SiC phase on the electrochemical performance of rGO–Si electrode. Therefore, the enhanced electrochemical performance of rGO–SiNaCl electrode was not only attributed to the presence of rGO nanosheets and ultra-small particle size, but also the absence of SiC impurity phase. The cycling performance of rGO–SiNaCl electrode is compared with those of the reported systems based on graphene–silicon nanocomposites (Table S1†). It shows that the performance of rGO–SiNaCl electrode is comparable or better than the reported results. The rate capability of rGO–SiNaCl electrodes was evaluated at rates ranging from 0.1 to 2.0C (Fig. 6(d)) with every 5 cycles for each rate. Discharge capacities slightly decreased as the C rate increased, and the electrode delivered high discharge capacity of 1239.5 mA h g−1 at a rate of 2.0C. This superior rate performance can be ascribed to the covalent attachment of silicon nanoparticles on the rGO surface, which enables fast electron transport through strong electrical coupling between silicon nanoparticles and rGO sheets. In addition, the ultra-small particle size of silicon results in a shorter lithium ion diffusion path, enabling faster reaction kinetics.
 | ||
| Fig. 6 (a) Cyclic voltammograms of the rGO–SiNaCl electrode, (b) two initial formation curves of the rGO–SiNaCl electrode cycled at 100 mA g−1, (c) charge and discharge capacities of the rGO–SiNaCl electrode after two formation cycles (current rate: 2100 mA g−1, cut-off: 0.005–1.5 V), and (d) discharge capacities of the rGO–SiNaCl electrode as a function of the C rate. The C rate was increased from 0.1 to 2.0C after every 5 cycles. | ||
To understand the enhanced electrochemical performance of rGO–SiNaCl material, SEM images of the electrode surface were taken before and after the cycles (Fig. 7(a)–(f)). The SEM image of the electrode prior to cycling showed smooth and porous morphology with particle-like structures, which was attributed to the clumped rGO–SiNaCl hybrid materials. After 100 cycles, it showed a larger particle size and a denser particle-like morphology at the charged state, indicating that the clumped rGO–SiNaCl hybrid increased in size upon lithiation, resulting in volume expansion. At the 100th cycle discharged state, the morphology was reversed back to a smoother morphology with the appearance of some cracks on the electrode surface. However, the electrode was still intact and did not show any pulverization. This result demonstrates that graphene nanosheets act as a volume buffer and suppress pulverization of the electrode.
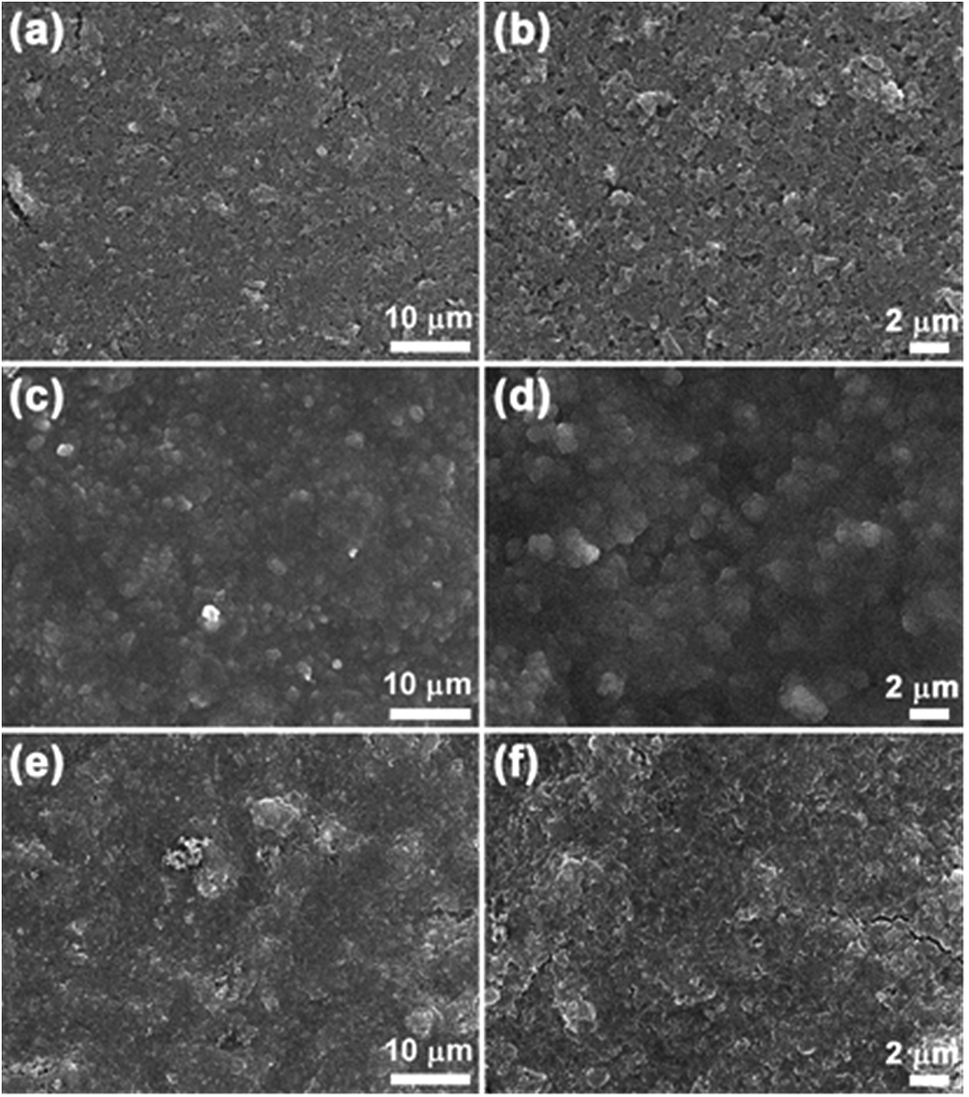 | ||
| Fig. 7 SEM images of (a, b) a pristine rGO–SiNaCl electrode before cycling, (c, d) an rGO–SiNaCl electrode at a charged state after 100 cycles, and (e, f) an rGO–SiNaCl electrode at a discharged state after 100 cycles. | ||
Conclusions
An rGO–SiNaCl hybrid with silicon nanoparticles of smaller than 10 nm was successfully synthesized using sol–gel reaction followed by magnesiothermic reduction. The use of NaCl as a heat scavenger aided in controlling the particle size and suppressing the formation of SiC impurity phase. The uniform distribution of silicon nanoparticles on the surface of rGO nanosheets through covalent bonding resulted in stable cycling performance and superior rate capability. The enhanced electrochemical performance of the rGO–SiNaCl electrode is attributed to the high electronic conductivity of the rGO nanosheets and their ability to preserve the mechanical integrity of the electrode. In addition, the ultra-small size of silicon particles reduced the ionic diffusion path length. Also, suppression of formation of the SiC phase played a key role in improving the electrochemical performance. Such a simple and scalable approach can be extended to other conversion type electrode materials in lithium-ion batteries.Acknowledgements
This work was supported by the green industry leading secondary battery technology development program of KEIT [10046341, Development of a high capacity, low cost silicon based anode material for lithium secondary batteries] and by the Basic Science Research Program through the National Research Foundation of Korea (NRF) funded by the Ministry of Science, ICT, and future Planning (2014R1A2A2A01002154).References
- M. Armand and J. M. Tarascon, Nature, 2008, 451, 652–657 CrossRef CAS PubMed.
- B. Liang, Y. Liu and Y. Xu, J. Power Sources, 2014, 267, 469–490 CrossRef CAS.
- B. Key, R. Bhattacharyya, M. Morcrette, V. Seznéc, J.-M. Tarascon and C. P. Grey, J. Am. Chem. Soc., 2009, 131, 9239–9249 CrossRef CAS PubMed.
- M. T. McDowell, S. W. Lee, W. D. Nix and Y. Cui, Adv. Mater., 2013, 25, 4966–4985 CrossRef CAS PubMed.
- H. Wu, G. Chan, J. W. Choi, I. Ryu, Y. Yao, M. T. McDowell, S. W. Lee, A. Jackson, Y. Yang, L. Hu and Y. Cui, Nat. Nanotechnol., 2012, 7, 310–315 CrossRef CAS PubMed.
- J. R. Szczech and S. Jin, Energy Environ. Sci., 2011, 4, 56–72 CAS.
- M. R. Zamfir, H. T. Nguyen, E. Moyen, Y. H. Lee and D. Pribat, J. Mater. Chem. A, 2013, 1, 9566–9586 CAS.
- M. N. Obrovac, L. Christensen, D. B. Le and J. R. Dahn, J. Electrochem. Soc., 2007, 154, A849–A855 CrossRef CAS.
- N. Mahmood, J. Zhu, S. Rehman, Q. Li and Y. Hou, Nano Energy, 2015, 15, 755–765 CrossRef CAS.
- C. Wang, H. Wu, Z. Chen, M. T. McDowell, Y. Cui and Z. Bao, Nat. Chem., 2013, 5, 1042–1048 CrossRef CAS PubMed.
- W. J. Lee, T. H. Hwang, J. O. Hwang, H. W. Kim, J. Lim, H. Y. Jeong, J. Shim, T. H. Han, J. Y. Kim, J. W. Choi and S. O. Kim, Energy Environ. Sci., 2014, 7, 621–626 CAS.
- Y.-S. He, P. Gao, J. Chen, X. Yang, X.-Z. Liao, J. Yang and Z.-F. Ma, RSC Adv., 2011, 1, 958–960 RSC.
- C. Xu, B. Xu, Y. Gu, Z. Xiong, J. Sun and X. S. Zhao, Energy Environ. Sci., 2013, 6, 1388–1414 CAS.
- X. Xin, X. Zhou, F. Wang, X. Yao, X. Xu, Y. Zhu and Z. Liu, J. Mater. Chem., 2012, 22, 7724–7730 RSC.
- X. Zhou, Y.-X. Yin, A.-M. Cao, L.-J. Wan and Y.-G. Guo, ACS Appl. Mater. Interfaces, 2012, 4, 2824–2828 CAS.
- J. K. Lee, K. B. Smith, C. M. Hayner and H. H. Kung, Chem. Commun., 2010, 46, 2025–2027 RSC.
- R. Hu, W. Sun, Y. Chen, M. Zeng and M. Zhu, J. Mater. Chem. A, 2014, 2, 9118–9125 CAS.
- F. Sun, K. Huang, X. Qi, T. Gao, Y. Liu, X. Zou, X. Wei and J. Zhong, Nanoscale, 2013, 5, 8586–8592 RSC.
- Y.-S. Ye, X.-L. Xie, J. Rick, F.-C. Chang and B.-J. Hwang, J. Power Sources, 2014, 247, 991–998 CrossRef CAS.
- X. Zhou, Y.-X. Yin, L.-J. Wan and Y.-G. Guo, Adv. Energy Mater., 2012, 2, 1086–1090 CrossRef CAS.
- J. Chang, X. Huang, G. Zhou, S. Cui, P. B. Hallac, J. Jiang, P. T. Hurley and J. Chen, Adv. Mater., 2014, 26, 758–764 CrossRef CAS PubMed.
- G. Zhao, L. Zhang, Y. Meng, N. Zhang and K. Sun, J. Power Sources, 2013, 240, 212–218 CrossRef CAS.
- M. Zhou, F. Pu, Z. Wang, T. Cai, H. Chen, H. Zhang and S. Guan, Phys. Chem. Chem. Phys., 2013, 15, 11394–11401 RSC.
- S. Zhu, C. Zhu, J. Ma, Q. Meng, Z. Guo, Z. Yu, T. Lu, Y. Li, D. Zhang and W. M. Lau, RSC Adv., 2013, 3, 6141–6146 RSC.
- A. Xing, J. Zhang, Z. Bao, Y. Mei, A. S. Gordin and K. H. Sandhage, Chem. Commun., 2013, 49, 6743–6745 RSC.
- D. S. Jung, M.-H. Ryou, Y. J. Sung, S. B. Park and J. W. Choi, Proc. Natl. Acad. Sci., 2013, 110, 12229–12234 CrossRef CAS PubMed.
- N. Liu, K. Huo, M. T. McDowell, J. Zhao and Y. Cui, Sci. Rep., 2013, 3, 1919 Search PubMed.
- X. Liu, Y. Gao, R. Jin, H. Luo, P. Peng and Y. Liu, Nano Energy, 2014, 4, 31–38 CrossRef CAS.
- A. Xing, S. Tian, H. Tang, D. Losic and Z. Bao, RSC Adv., 2013, 3, 10145–10149 RSC.
- I. H. Son, J. Hwan Park, S. Kwon, S. Park, M. H. Rummeli, A. Bachmatiuk, H. J. Song, J. Ku, J. W. Choi, J. M. Choi, S. G. Doo and H. Chang, Nat. Commun., 2015, 6, 7393 CrossRef CAS PubMed.
- B. Wang, X. Li, B. Luo, L. Hao, M. Zhou, X. Zhang, Z. Fan and L. Zhi, Adv. Mater., 2015, 27, 1526–1532 CrossRef CAS PubMed.
- H. Kim, M. Seo, M.-H. Park and J. Cho, Angew. Chem., Int. Ed., 2010, 49, 2146–2149 CrossRef CAS PubMed.
- Z. Ma, T. Li, Y. L. Huang, J. Liu, Y. Zhou and D. Xue, RSC Adv., 2013, 3, 7398–7402 RSC.
- W. Luo, X. Wang, C. Meyers, N. Wannenmacher, W. Sirisaksoontorn, M. M. Lerner and X. Ji, Sci. Rep., 2013, 3, 1–7 Search PubMed.
- N. I. Kovtyukhova, P. J. Ollivier, B. R. Martin, T. E. Mallouk, S. A. Chizhik, E. V. Buzaneva and A. D. Gorchinskiy, Chem. Mater., 1999, 11, 771–778 CrossRef CAS.
- W. S. Hummers and R. E. Offeman, J. Am. Chem. Soc., 1958, 80, 1339 CrossRef CAS.
- C. H. Lim, A. G. Kannan, H.-W. Lee and D. K. Kim, J. Mater. Chem. A, 2013, 1, 6183–6190 CAS.
- W. Chen, Z. Fan, A. Dhanabalan, C. Chen and C. Wang, J. Electrochem. Soc., 2011, 158, A1055–A1059 CrossRef CAS.
- K. Evanoff, A. Magasinski, J. Yang and G. Yushin, Adv. Energy Mater., 2011, 1, 495–498 CrossRef CAS.
- M.-H. Park, M. G. Kim, J. Joo, K. Kim, J. Kim, S. Ahn, Y. Cui and J. Cho, Nano Lett., 2009, 9, 3844–3847 CrossRef CAS PubMed.
- Y. Mitamura, Y. Komori, S. Hayashi, Y. Sugahara and K. Kuroda, Chem. Mater., 2001, 13, 3747–3753 CrossRef CAS.
- J. Chang, X. Huang, G. Zhou, S. Cui, S. Mao and J. Chen, Nano Energy, 2015, 15, 679–687 CrossRef CAS.
- J. Li and J. R. Dahn, J. Electrochem. Soc., 2007, 154, A156–A161 CrossRef CAS.
- Y. Miroshnikov, G. Grinbom, G. Gershinsky, G. D. Nessim and D. Zitoun, Faraday Discuss., 2014, 173, 391–402 CAS.
Footnote |
| † Electronic supplementary information (ESI) available: Table comparing the performance of rGO–SiNaCl electrode with the reported data, SEM image and corresponding EDS spectra of GO-SiO2 and rGO–SiNaCl, XPS survey spectra of GO and rGO, TEM, HRTEM images and XRD pattern of the rGO–Si synthesized without NaCl as a heat scavenger, Cycling performance of rGO–Si electrode prepared without NaCl. See DOI: 10.1039/c5ra27877e |
| This journal is © The Royal Society of Chemistry 2016 |