DOI:
10.1039/C5RA27611J
(Paper)
RSC Adv., 2016,
6, 18778-18792
Transcriptome-wide identification of sucrose synthase genes in Ornithogalum caudatum†
Received
24th December 2015
, Accepted 2nd February 2016
First published on 3rd February 2016
Abstract
OCAP-2-1, OCAP-2-2, OCAP-3-1 and OCAP-3-3, four glucose-containing polysaccharides from Ornithogalum caudatum, exhibit antitumor activity, suggesting their potential application as natural antitumor drugs. Although the incorporation of glucose into these polysaccharides from UDP-D-glucose is reasonably well understood, the cDNA isolation and functional characterization of genes responsible for UDP-D-glucose biosynthesis from O. caudatum has not been identified. Here, we present a full characterization of the sucrose synthase family, a Leloir glycosyltransferase responsible for UDP-D-glucose biosynthesis from O. caudatum. Specifically, a transcriptome-wide search for Sus genes in O. caudatum was first performed in the present study. A total of 5 unigenes sharing high sequence identity with Sus were retrieved from transcriptome sequencing. Three full-length Sus-like candidates derived from this unigene assembly were then obtained and isolated by reverse transcription polymerase chain reaction (RT-PCR) from O. caudatum. Additional analysis showed two conserved domains (sucrose synthase and glycosyl transferase domains) were present in this family. Phylogenetic analysis indicated that the OcSus1 and OcSus2 could be clustered together into a monocots specific clade, while OcSus3 could be classified into M & D1 category with members from the monocots and dicots species, displaying an evolutionary consistency with other plant species. These candidate isoenzymes were screened by functional expression in E. coli individually as standalone enzymes. All three cDNAs were identified to be bona fide genes and encoded sucrose synthase with varied kinetic properties. To further explore the possible role of these Sus proteins in polysaccharide biosynthesis, transcript profiles of the three genes were subsequently examined by real-time quantitative PCR in various tissues. OcSus1 and OcSus2 were therefore assumed to be responsible for the biosynthesis of the four glucose-containing polysaccharides due to their expression profiles in O. caudatum. Taken together, these data provide further comprehensive knowledge for polysaccharide biosynthesis in O. caudatum and broaden the potential application of Sus in metabolic engineering or synthetic biology as a potential gene part.
1. Introduction
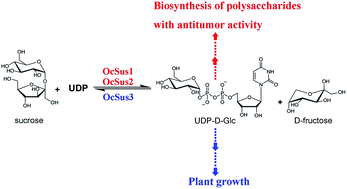
Sucrose synthase (Sus, UDP-glucose: D-fructose 2-α-D-glucosyl transferase, EC 2. 4. 1. 13), an enzyme catalyzing both the synthesis and cleavage of sucrose in a reversible and almost energy neutral manner, is a unique case among the Leloir glycosyltransferases.1 Sucrose synthase can synthesize sucrose by transfer of a glucosyl group from nucleotide diphosphate glucose (NDP-glucose, NDP-Glc or NDPG) to a D-fructose. Also, this synthase can catalyze the reversible conversion of sucrose and nucleotide diphosphate (NDP) into fructose and NDPG (Fig. 1).2 By this token, sucrose synthase is a key player in the regulation of carbon partitioning into diverse pathways that are necessary for metabolic, structural and storage functions in the plant cell.3 There are considerable evidences indicate that Sus has important effects on plant growth and development. The typical function of Sus is to supply precursor material for the biosynthesis of cellulose in the cell wall and starch.4,5 Also, Sus was proposed to be responsible for pollen tube growth.6,7 Additionally, Sus was assumed to be associated with other important processes including nitrogen fixation,8,9 fruit and seed maturation,10,11 environmental stresses response12 and biomass production.10,13 Overall, Sus plays central role in the metabolism of imported photosynthate and therefore it is necessary to deepen comprehensive knowledge of sucrose synthase.
 |
| Fig. 1 Cleavage and synthesis reaction of sucrose synthase. | |
Besides its biological significance, Sus has also proven to have synthetic potentials as a biocatalyst in vitro. In a few previous reports, sucrose synthase was exploited to synthesize various nucleotide sugars and saccharides.2,14–17 Moreover, sucrose synthase was used to supply glucosyl donor for small molecules to yield glycosides of higher value by coupling with glycosyltransferases.1,18–21 Such efforts revealed the potential for Sus to act as a biocatalyst in biological processes. However, low activity and poor solvent tolerance of sucrose synthase make its application be still far from industrial applications1,20 and bioprospecting.22 It is essential, therefore, to continue to search more effective forms of Sus, with high catalytic activity and stability from a variety of organisms.
Sucrose synthase was explored extensively due to its potential application since its first discovery in 1955.23 Up to data, Sus was isolated from various plant species,24,25 cyanobacteria26–28 and nonphotosynthetic organisms.29 Most of these Sus proteins were encoded by a small multi-gene family.24,25 Although Sus genes in a few plant species such as Arabidopsis thaliana,24,30,31 Bambusa oldhamii,25 Hordeum vulgare,32,33 Zea mays,34,35 Pisum sativum,36 Hevea brasiliensis,12 Lotus japonicas,37 Citrus paradisi,38 Populus trichocarpa,39 Oryza sativa40,41 and Gossypium arboreum42 have been extensively studied, the Sus genes in the Asparagaceae species Ornithogalum caudatum have not.
O. caudatum, an annual herb originally distributed in southern Africa and introduced to ancient China, was known in Chinese folk medicine as exhibiting anticancer, antimicrobial and anti-inflammatory activities.43,44 O. caudatum contained diverse polysaccharides, like OCAP-2-1, OCAP-2-2, OCAP-3-1 and OCAP-3-3, exhibiting significant anticancer action.43 Monosaccharide components characterization revealed glucose is the dominant monosaccharide, accounting for exceeding 30% of the total sugars. Besides glucose, these four polysaccharide fractions consist of other monosaccharide components, such as xylose, galactose, arabinose, glucuronic acid and galacturonic acid. The incorporation of these monosaccharide components into polysaccharides requires their addition from the nucleotide-activated precursors, like UDP-D-glucose (UDP-D-Glc), UDP-D-xylose (UDP-D-Xyl), UDP-D-galactose (UDP-D-Gal), UDP-L-arabinose (UDP-L-Ara), UDP-D-glucuronic acid (UDP-D-GlcA) and UDP-D-galacturonic acid (UDP-D-GalA). UDP-D-Glc is doubtless the precursor of all sugar nucleotides mentioned above. Although biochemical aspects of the UDP-D-Glc biosynthetic pathways are reasonably well understood, the cDNA isolation and functional characterization of genes encoding UDP-D-Glc biosynthetic enzymes from O. caudatum has not been identified, including Sus.
In this contribution, a total of three full-length cDNAs encoding sucrose synthase were isolated for the first time from O. caudatum by a transcriptome-wide search. These candidate isoenzymes were then screened by the functional expression in E. coli individually as standalone enzymes. Results showed all the three cDNAs were bona fide genes and encoded sucrose synthase with varied activities. Most important, the present investigation first verified the involvement of OcSus1 and OcSus2 in biosynthesis of glucose-containing polysaccharides in O. caudatum. Discovery and characterization of Sus family will help to further understanding the UDP-D-Glc biosynthesis in O. caudatum. Also, the present study lays a foundation for comprehensive knowledge and potential application in metabolic engineering of Sus.
2. Experimental
2.1. Substrates, chemicals and enzymes
Materials (suppliers) used in this study were as follows. Sucrose, D-fructose, UDP-D-Glc and nucleotide diphosphates (ADP, CDP, GDP, TDP and UDP) (Sigma-Aldrich Co. Ltd., St. Louis, MO, USA) were used in the enzyme assays. In-Fusion® HD Cloning Kit and restriction enzymes (Takara Shuzo Co. Ltd., Kyoto, Japan) were applied in recombinant plasmids construction. Rever Tra-Plus™ RT-PCR kit and KOD-Plus-Neo DNA polymerases (Toyobo Co. Ltd., Osaka, Japan) were utilized to synthesize full-length cDNAs. RNeasy Plant Mini Kit (Qiagen, Dusseldorf, Germany) was put to use for RNA extraction; Ni-Sepharose (Invitrogen, Carlsbad, CA, USA) was applied to purify recombinant proteins. The anthrone solution was prepared by mixing 150 mg anthrone with 100 mL diluted sulfuric acid (76 mL sulfuric acid in 30 mL water). All other chemicals used in this study were of analytical grade.
2.2. Strains and plasmids
Vectors pEASY®-Blunt (TransGen Biotech Co. Ltd., Beijing, China) and pCDFDuet-1 (Novagen, Madison, USA) were used for gene amplification and heterologous expression, respectively. The three E. coli strains Trans1-T1, Transetta (DE3) and BL21 (DE3) were obtained from TransGen Co. Ltd and were used as a bacterial host for recombinant plasmids amplification and enzymes expression, respectively. The strains were grown in Luria-Bertani medium (10 g L−1 Bacto-Tryptone, 5 g L−1 Bacto-yeast extract, 10 g L−1 NaCl) supplemented with appropriate antibiotics when required for selection. The plasmids and strains used in this study are provided in Table S1.†
2.3. Plant materials
O. caudatum plants were cultivated at the experimental plantation of Institute of Materia Medica, Chinese Academy of Medical Sciences & Peking Union Medical College until flowering. Fresh tissue samples of roots, leaves, bulbs, flowers and bulblets were then collected from a 2 year-old O. caudatum for analyses of the expression profiles of Sus genes. Also, O. caudatum bulbs were inoculated on 6,7-V medium45 after sterilization, and then continued to subculture on 6,7-V medium at a temperature of 22 °C and 16 h light/8 h dark cycle. The sterile bulbs of O. caudatum were collected and used fresh or were frozen in liquid N2 for RNA isolation, which was used as the start material for transcriptome sequencing, cDNA isolation and expression analyses of Sus genes.
2.4. Transcriptome sequencing and RNA-seq data analysis
The detailed procedure is the same as the previous reports by our laboratory.46–49 Briefly, beads with oligo(dT)20 were used to isolate poly(A) mRNA after total RNA was collected from the bulbs of O. caudatum, first and then, the resultant mRNA was interrupted to short fragments for cDNA library construction using a mRNA-seq Sample Preparation Kit (Illumina) following the manufacturer's protocol. The resulting cDNA library was subsequently sequenced using Illumina HiSeq™2000. Short nucleotide reads obtained via Illumina sequencing were assembled by the Trinity software (http://www.trinity-software.com) to produce error-free, unique contiguous sequences (contigs). These contigs were ligated to obtain non-redundant unigenes, which could not be extended on either end. Unigene sequences were aligned by BLAST X to protein databases like NCBI nr, Swiss-Prot, KEGG, and COG (e-value < 0.00001), and aligned by BLAST N to nucleotide databases nt (e-value < 0.00001), retrieving proteins with the highest sequence similarity with the given unigenes, along with their functional annotations.
2.5. Full-length cDNAs isolation and sequences analyses of OcSus gene family
To confirm whether assembled sequences represented true gene products, experimental verification was performed by designing gene-specific primers (Table S2†) for OcSus full-length sequences, and then verifying the identity of amplified products by sequencing.
Total RNA isolated from sterile bulb tissue of O. caudatum was used as a template for isolation of OcSus cDNAs. The resulting OcSus cDNAs were each inserted into the pEASY®-Blunt to generate pEASY-OcSus, respectively, for sequencing (Table S1†).
The obtained OcSus sequences were analyzed using online bioinformatics tools from NCBI and ExPASy. Open reading frame (ORF) finder was performed by the on-line program (http://www.ncbi.nlm.nih.gov/gorf/orfig.cgi). The amino acid sequence of the resultant ORF was deduced and analyzed with the ProtParam tool (http://web.expasy.org/protparam/). TMHMM (http://www.cbs.dtu.dk/services/TMHMM/) was used to predict the transmembrane helices of proteins, SignalP 4.1 (http://www.cbs.dtu.dk/services/SignalP/) was used to predict cleavage sites of signal peptides, and the online tool (http://www.ebi.ac.uk/interpro/) was used to predict the domain of the proteins, respectively. Protein multiple sequence alignment was performed using Clustal X (version 2.1).50 A phylogenetic tree was constructed using the neighbor-joining method with the MEGA5.1 program.51 The reliability of the tree was measured by bootstrap analysis with 1000 replicates.
2.6. Heterologous expression and purification of recombinant OcSus proteins
After sequence verifications, OcSus ORFs were inserted into restriction enzymes linearized pCDFDuet-1 to generate recombinant vectors for heterologous expression using In-Fusion technology as previously described.46–48 Specifically, OcSus1 was inserted between BamHI and SacI sites of pCDFDuet-1, while OcSus2 and OcSus3 were ligated into EcoRI and PstI linearized pCDFDuet-1, respectively (Table S1†). In all cases, successful gene cloning was verified by digestion checks, and the absence of undesired mutations introduced during PCR was verified by direct nucleotide sequencing.
E. coli Transetta (DE3) harboring plasmids pCDFDuet-OcSus1, pCDFDuet-OcSus2 or pCDFDuet-OcSus3 was grown in LB medium containing 34 μg mL−1 chloromycetin and 10 μg mL−1 streptomycin. Production of His-tagged recombinant OcSus proteins was induced at mid-log phase by adding various final concentrations of isopropyl β-D-thiogalactopyranoside (IPTG, 0.2 mM for OcSus1 and OcSus3, while 0.8 mM for OcSus2). The induced cells were harvested by centrifugation (10
000 g, 2 min) at 4 °C. A small part of pellets (derived from 1 mL culture) were then subjected to sodium dodecyl sulfate-polyacrylamide gel electrophoresis (SDS-PAGE) and Western-blot analyses as previously described.47 After verification of successful expression, the rest cells were washed and re-suspended in lysis buffer (pH 8.0, 20 mM sodium phosphate) for proteins purification. In particular, cells were lysed with a high pressure homogenizer (800 bar, 3 passes), and centrifuged at 10
000g for 30 min. The resulting supernatant was collected and dealt with 1 U per mL DNaseI at 4 °C for approximately 2 h. The treated samples were then centrifuged for 30 min at 10
000 g. The obtained supernatant was passed through a 0.2 μm pore-size filter to remove E. coli debris and other contaminants, and then loaded onto a Ni-NTA resin column which was pre-equilibrated with equilibrium buffer (pH 8.0, 20 mM sodium phosphate containing 5 mM imidazole). The column was then washed with washing buffer (pH 8.0, 20 mM sodium phosphate containing 20 mM imidazole) to remove non-specifically bound proteins. Subsequently, an elution buffer (pH 8.0, 20 mM sodium phosphate containing 40 mM imidazole) was used to elute the His-tagged protein.
To remove imidazole, ultrafiltration was performed using the Millipore's Amicon® Ultra-15 centrifugal filter devices according to the manufacturer's instructions. Glycerin (final concentration of 20%) was added into the obtained proteins, and stored at −20 °C until use. What calls for special attention is that all the enzyme purification steps were performed at 4 °C.
2.7. Enzyme assays
Sucrose synthase can catalyze in vivo the synthesis and cleavage of sucrose under appropriate conditions. Sucrose synthase activity was, therefore, determined in both directions, namely synthesis and breakdown directions.
Assay of Sus activity in synthesis direction. Sucrose synthesis by Sus was assayed by a combination of the methods as reported by Wen et al.,5 Klann et al.,52 Miron et al.53 and van Handel,54 with minor modifications. In a total volume of 300 μL HEPES/NaOH buffer (50 mM, pH 8.5), recombinant OcSus protein was incubated with 2 mM UDP-D-Glc and 20 mM D-fructose for 60 min at 37 °C. The assays which do not contain any enzyme were used for the control. The reactions were stopped by transferring to a boiling water bath for 10 min. After a brief centrifugation, 70 μL of sample was removed from the reactive assay and transferred to new tubes. To destroy any unreacted fructose, 70 μL of 30% NaOH was added, mixed thoroughly and subsequently boiled for an additional 10 min. Samples were centrifuged again and 1 mL anthrone reagent was added into each reaction for incubation at 40 °C for 20 min. The sucrose formed was first estimated subjectively based on the degree of blue-green coloration. Accurate quantification of sucrose in samples was then performed according to their absorbance at 620 nm.
Assay of Sus activity in cleavage direction. The cleavage of sucrose by Sus was performed in a manner similar to that described previously.20,55 In a total volume of 200 μL Tris–HCl buffer (50 mM, pH 6.5) recombinant OcSus was incubated with 0.5 mM UDP and 1.5 mM sucrose for 3 h at 50 °C (OcSus1), or 4.5 h at 37 °C (OcSus2), or 4.5 h at 50 °C (OcSus3). The reaction was terminated by heating at 100 °C for 5 min. The formation of UDP-D-Glc was determined by ion-pair reverse-phase high-performance liquid chromatography (RP-HPLC). The analyses were carried out on the Thermo Scientific Dionex Ultimate 3000 HPLC system (Thermo Scientific Dionex, America) using a C18 column [YMC-Pack ODS-A (5 μm, 12 nm, 250 × 4.6 mm)]. Two buffers were used for HPLC analysis. Buffer A, 8 mM tetrabutylammonium hydrogensulfate plus 17 mM KH2PO4, was used as pairing reagent (pH 6.5). Buffer B was 70% buffer A plus 30% methanol (MREDA Inc., Beijing, China) (pH 6.5). Buffer A and B were filtered on 0.2 μm pore-size filters. The elution gradient was as follows: 100% buffer A for 5 min, 0–77% buffer B linearly for 27 min, 77% B for 5 min, 100% A for 1 min. The flow rate was kept at 1 mL min−1 and substances were detected by UV detector at wavelength 260 nm.The newly formed products of recombinant OcSus proteins were further characterized by HPLC-MS. First of all, the reaction products of sucrose cleavage direction were isolated using ion-pair RP-HPLC. The obtained products was then desalted by HPLC on the Thermo Scientific Dionex Ultimate 3000 HPLC system (Thermo Scientific Dionex, America) using a C18 column [YMC-Pack ODS-A (5 μm, 12 nm, 250 × 4.6 mm)]. Gradient elution used 0.05% aqueous trifluoroacetic acid (solvent A) and CH3CN (solvent B). After pre-equilibration in 2% B, the sample was injected and chromatographed using an elution gradient: 2–50% buffer B linearly for 25 min, 100% B for 5 min, 2% B for 5 min. The flow rate was kept at 1 mL min−1 and substances were detected by UV detector at wavelength 260 nm.
HPLC-MS analysis of these products of desalination was performed using an Agilent 1200 RRLC series HPLC system (Agilent Technologies, Waldbronn, Germany) coupled to the QTRAP MS spectrometer (QTRAP 2000, Applied Biosystems/MDS SCIEX) tandem mass spectrometer equipped with a Turbo Ion spray ion source (Concord, ON, Canada), which was controlled by Analyst 1.5. UV spectra were recorded from 190 to 400 nm. The mass spectrometer was operated in negative ion mode and spectra were collected in the enhanced full mass scan mode from m/z 100–1000.
The cleavage activity of OcSus proteins was also tested with other nucleotide diphosphates including ADP, CDP, GDP and TDP, respectively.
2.8. Kinetic analyses of the recombinant OcSus proteins
Although the reaction catalyzed by Sus is readily reversible, there are good evidences that in vivo the enzyme functions primarily in the direction of sucrose degradation to provide sugar nucleotides for glycosylation of varied molecules.56,57 Thus, sucrose cleavage reaction is very valuable for biological application of Sus in metabolic engineering and synthetic biology. Therefore, unless otherwise stated, the biochemical analysis of sucrose synthase mainly refers to sucrose cleavage reaction hereinafter.
Various buffers, temperatures and cations were used to determine the optimal activities of recombinant OcSus proteins as previously described.47 Buffers, including citric acid/sodium citrate buffer (0.1 M, pH 3.0–6.6), Na2HPO4/NaH2PO4 buffer (0.2 M, pH 5.8–8.0) and Na2HPO4/NaOH buffer (0.1 M, pH 10.9–12), were used to determine pH profile of recombinant OcSus proteins. Assays were performed at a constant temperature of 50 °C (OcSus1, 3 h), 37 °C (OcSus2, 4.5 h) and 50 °C (OcSus3, 4.5 h).
For determination of the optimal temperature, reactions were performed in 0.2 M Na2HPO4/NaH2PO4 buffer (pH 7.0) at varied temperatures of 4, 20, 30, 37, 50, 60 and 80 °C for 3 h (OcSus1), 4.5 h (OcSus2) or 4.5 h (OcSus3), respectively. The formation of UDP-D-Glc in various buffers or temperatures was monitored by ion-pair RP-HPLC. Controls without enzymes were included and each experiment was performed in triplicate.
Different concentrations of divalent metal ions (Mg2+, Ca2+, Mn2+, Co2+, Cu2+ and Zn2+, all added in their chloride form) were added to the reaction mixture to investigate their influence on the cleavage reaction of sucrose synthase. Assays were performed at 50 °C (OcSus1, 3 h), 37 °C (OcSus2, 4.5 h) and 50 °C (OcSus3, 4.5 h), respectively. The formation of UDP-D-Glc was monitored by ion-pair RP-HPLC. Controls without metal ion were included and each experiment was performed in triplicate.
The kinetic constants for UDP (varied between 0.025 and 2.0 mM) at a constant concentration of 1.5 mM sucrose and for sucrose (varied between 0.15 and 9.0 mM) at a constant concentration of 0.5 mM UDP were determined at 50 °C (OcSus1, 50 mM Na2HPO4/NaH2PO4 buffer, pH 7.0, 3 h), 37 °C (OcSus2, 50 mM Na2HPO4/NaH2PO4 buffer, pH 7.0, 4.5 h) and 50 °C (OcSus3, 50 mM citric acid/sodium citrate buffer, pH 5.0, 4.5 h), respectively. The formation of UDP-D-Glc was monitored by ion-pair RP-HPLC. Kinetic constants values were determined from Lineweaver–Burk plots. All kinetic assays were performed in triplicate.
2.9. Tissue-specific expression analysis of OcSus genes by real-time quantitative PCR
Comprehensive analysis of the expression patterns of OcSus genes can often partly reveal their possible physiological functions. Tissue-specific expression analyses of OcSus genes, therefore, were performed in six O. caudatum tissues to explore their possible functions in glucose-containing polysaccharides biosynthesis. Specifically, total RNA was isolated from various tissues including roots, leaves, bulbs, flowers, bulblets and sterile bulbs of O. caudatum using an RNeasy Plant Mini Kit (Qiagen). One μg of total RNA was used for first-strand cDNA synthesis according to the protocol of ReverTra Ace (TOYOBO). Real-time quantitative PCR (RT-qPCR) was performed on Lightcycler® 480 II machine (Roche) using the Lightcycler® 480 SYBR Green I Master kit (Roche). The specific primers corresponding to OcSus gene family and internal control (glyceraldehyde-3-phosphate dehydrogenase, GAPDH)58 were designed using Primer Express 3.0 software and listed in Table S2.† The PCR program included an initial denaturation at 95 °C for 10 min, and 40 cycles of 15 s at 95 °C, 60 s at 60 °C, and a final melt-curve of 15 s at 95 °C, 60 s at 60 °C, 15 s at 95 °C, 15 s at 60 °C. The specificity of the amplified fragments was checked by the melting curves. All reactions were carried out in triplicate, and the data were analyzed using the Lightcycler® 480 software.
3. Results and discussion
3.1. Transcriptome analysis of O. caudatum unigenes
The transcriptome, a source for bioprospecting,22 is the universe of expressed transcripts within a cell at some particular state. Transcriptome sequencing is a high-throughput approach and can yield a tremendous amount of sequences in each run, far greater than that produced by traditional techniques. Transcriptome sequencing, therefore, can greatly accelerate full-length genes isolation. In the present study, a total of 104180 unigenes with an average length of 520 bp were acquired from transcriptome de novo assembly. These unigene sequences were firstly aligned by BLAST X to protein databases like nr, Swiss-Prot, KEGG and COG (e-value < 0.00001). A total of 5 unigenes showing high similarity with Sus were then retrieved from transcriptome sequence. Their transcript IDs are listed in Table 1. These unigenes were further analyzed by BLAST X for their ORF identification. Results revealed only one unigene, designated as unigene 317, contained full-length Sus ORF. The full-length unigene 317 was 3130 bp long with an ORF of 2, 448 bp encoding 815 amino acids and consisted of a 5′-untranslated region (UTR) of 437 bp and a 3′-UTR of 245 bp. The other four unigenes, unigenes 14779, 34936, 62182 and 62446, were predicted to contain partial sequences of Sus homologs. Among them, unigenes 14779 and 62446 both displayed similarity to 5′-end of sucrose synthase gene, while both unigenes 34936 and 62182 exhibited sequence homology with 3′-end of sucrose synthase gene (Table 1). Hence, at least two full-length Sus-like genes were generated by pair-wise combinations of the four unigenes. Together with these data, we assumed sucrose synthase in O. caudatum was encoded by a multi-gene family containing at least three members.
Table 1 Unigenes sharing high sequence identity with sucrose synthase. N, no sequences
Unigene ID |
Length (bp) |
Sequence structure (bp) |
5′-UTR |
ORF |
3′-UTR |
317 |
3130 |
437 |
2448 |
245 |
14779 |
258 |
126 |
132 |
N |
62446 |
939 |
82 |
857 |
N |
34936 |
2472 |
N |
2177 |
295 |
62182 |
2111 |
N |
1718 |
393 |
3.2. cDNAs isolation and sequences analyses of OcSus gene family
The first full-length OcSus-like cDNA was isolated from O. caudatum cDNA directly by nested PCR using the gene-specific primers corresponding to unigene 317 (Table S2†). The resulting ORF was then inserted into the cloning vector pEASY®-Blunt vector to generate pEASY-OcSus for sequencing. Sequencing verified that the first OcSus-like cDNA sequence was identity with unigene 317, which means a real gene in planta. The second full-length OcSus-like gene was amplified using the pair-wise primers corresponding to unigenes 14779 and 34936. The resulting sequence is 2863 bp long and contains a 2442 bp ORF encoding a protein of 813 amino acids with an ATG at position 126 and the stop codon TGA at position 2566. Sequence alignment showed the 5′-end and 3′-end of the second Sus-like cDNA were absolutely identical to unigenes 14779 and 34936, respectively, suggesting a bona fide gene present in O. caudatum genome. When forward primers matching unigene 62446 and reverse primers corresponding to unigene 62182 were paired to amplify the cDNA of O. caudatum, a specific fragment of 2893 bp including a 2418 bp full-length coding region was yielded. Alignment analysis showed the resulting sequence is nearly identical to that of unigenes 62446 and 62182, confirming the authenticity of the third Sus-like transcript in planta. Therefore, these three sequences were designated as OcSus1, OcSus2 and OcSus3, respectively, and then all were deposited in the GenBank database (Fig. 2, Table 2).
 |
| Fig. 2 Sketch of cDNAs isolation of OcSus family from O. caudatum. | |
Table 2 Comparison of the predicted O. caudatum Sus proteins as deduced from their cDNA sequences
Nucleotide |
Protein |
Gene |
Accession number |
Corresponding unigene(s) |
Length (bp) |
ORF (bp) |
a.a. |
kDa |
pI |
Identity (%) |
OcSus2 |
OcSus3 |
OcSus1 |
KT833617 |
Unigene 317 |
3130 |
2448 |
815 |
93.4 |
6.02 |
84.05 |
71.45 |
OcSus2 |
KT833618 |
Unigenes 14779 and 34936 |
2863 |
2442 |
813 |
92.5 |
5.84 |
100 |
70.47 |
OcSus3 |
KT833619 |
Unigenes 62446 and 62182 |
2893 |
2418 |
805 |
91.9 |
6.01 |
70.47 |
100 |
The domain prediction results showed that OcSus1–3 have two conserved domains, sucrose synthase and glycosyl transferase domains, which have been suggested to be typical signatures of Sus proteins and also identified in other plant Sus proteins (Fig. 3). Furthermore, the three Sus-like sequences shared the conserved Ser residue in the N-terminal regions, which has been documented to be phosphorylated by the Ser/Thr protein kinase in maize (Fig. 3).23 Together, these findings lead to an inference that the three new isolated genes encode various isoforms of sucrose synthase in O. caudatum. Multiple sequence alignment was performed using the DNAMAN algorithm (http://www.lynnon.com/), which also revealed the levels of similarities between the amino acid sequences of OcSus1–3 (Fig. 3, Table 2). The highest percentage of amino acid sequence identity was found between OcSus1 and OcSus2 (84.05%), followed by OcSus1 and OcSus3 (71.45%), and then by OcSus2 and OcSus3 (70.47%) (Table 2). Analysis by the TMHMM tool indicated that there are no predicted transmembrane helices present in OcSus1–3, suggesting their soluble expression in vivo. SignalP 4.1 showed that they have no signal peptide or signal peptide cleavage sites, which is consistent with the results predicted by TMHMM tool.
 |
| Fig. 3 Multiple sequence alignment for the predicted amino acid sequences of OcSus isoforms. The predicted conserved serine residue for phosphorylation by Ser/Thr protein kinase is indicated by a red star. The characteristic sucrose synthase domain (pink boxes) and a glycosyl transferases domain (orange boxes) were identified by the online tool (http://www.ebi.ac.uk/interpro/). | |
3.3. Phylogenetic analysis of sucrose synthase proteins
In order to analyze the phylogenetic relationships among Sus gene families between O. caudatum and other plant species, a total of 40 plant Sus amino acid sequences, representing 8 species were aligned and used to construct an unrooted tree using the neighbor-joining method in MEGA 5.1 software. As shown in Fig. 4, the 40 plant Sus amino acid sequences were clustered into four clades, namely monocot, dicot, M & D1 and M & D2 clades. Monocot clade is a monocot-specific group, all members coming from various monocotyledonous species. OcSus1 and OcSus2 are fallen into this monocot-specific group, forming two independent subgroups to the exclusion of other monocotyledonous proteins, suggesting that a single Sus gene has expanded through independent duplication within the O. caudatum lineages occurred after O. caudatum separation with other monocotyledonous species. Moreover, both the two sequences have long branches, indicating the duplications of the two Sus homologues occurred long time ago. Dicot clade contained only the proteins from dicotyledonous plants. As displayed in Fig. 4, this clade may be further subcategorized into diverse sub-groups. M & D1 and M & D2 clades are two mixed groups, including both monocot- and dicotyledonous species. OcSus3 was classified into M & D1 group with an independent branch having a relatively short distance. Moreover, unlike monocot and dicot clades, M & D1 and M & D2 clades could not be further classified into significant distinct sub-groups, suggesting that duplications occurring in the two mixed groups should be no earlier than the monocots/dicots split. Phylogenetic analysis revealed that apparent diversification has occurred within the Sus family in O. caudatum, likely indicating discrete biological roles for the paralogs despite their high sequence identity.
 |
| Fig. 4 Phylogenetic analysis of OcSus1–3 and other plant Sus homologs. The phylogenetic tree was constructed using the neighbor-joining method available in the MEGA5.1 program. Accession numbers are: Zea mays, ZmSh1, X02400; ZmSUS1, L22296; ZmSUS3, AY124703. Oryza sativa, OsSUS1, AK100334; OsSUS2, AK072074; OsSUS3, AK100306; OsSUS4, AK102158; OsSUS5, AK063304; OsSUS6, AK065549. Hordeum vulgare, HvSS1, X65871; HvSS2, X69931; HvSS3, AK249450; HvSS4, AK251329. Triticum aestivum, TaSUS1, AJ001117; TaSUS2, AJ000153. Bambusa oldhamii, BoSus1, AF412036; BoSus2, AF412038; BoSus3, AF412037; BoSus4, AF412039. Pisum sativum, PsSUS1, AJ012080; PsSUS2, AJ001071; PsSUS3, AJ311496. Arabidopsis thaliana, AtSUS1, X70990; AtSUS2, Q00917; AtSUS3, AL161494; AtSUS4, AL353871; AtSUS5, BAB11375; AtSUS6, AAG30975. Solanum tuberosum, StSUS1, P10691; StSUS2, P49039. Gossypium arboreum, GaSus1, JQ995522; GaSus2, JQ995523; GaSus3, JQ995524; GaSus4, JQ995525; GaSus5, JQ995526; GaSus6, JQ995527; GaSus7, JQ995528. Red triangle stands for the OcSus protein. | |
3.4. Expression and purification of recombinant OcSus proteins
Plasmids pCDFDuet-OcSus1, pCDFDuet-OcSus2 and pCDFDuet-OcSus3 were transformed into the E. coli strain Transetta (DE3) for heterologous expression, respectively. SDS-PAGE analysis indicated that the OcSus1 and OcSus2 can be expressed as a soluble form, while OcSus3 expressed in the form of inclusion body (Fig. S1†). Inclusion body formation during the course of heterologous expression of recombinant OcSus3 was indicative of its inability to form nature or correct tertiary structure. This protein misfold often requires the assistance of folding modulators, like molecular chaperones. It is widely recognized that co-expression of molecular chaperones can favor on-pathway folding and that in at least some cases this leads to increased production of active proteins.59,60 The expression plasmid pCDFDuet-OcSus3 was, therefore, co-transformed into E. coli strain BL21 (DE3) with chaperone plasmid pGro7 (Takara, Dalian, China) for soluble expression. As depicted in Fig. S2,† an intense band with an apparent molecular mass of 92 kDa was determined by SDS-PAGE detection, suggesting the successful expression of a soluble OcSus3 protein (Fig. S2†). Western-blot results (Fig. S3†) further verified the soluble expressions of these three Sus isoforms in E. coli. The resulting three soluble proteins were then purified to apparent homogeneity using immobilized metal affinity chromatography (IMAC) and subsequent ultrafiltration (Fig. S1 and S2†).
3.5. Functional characterization of the recombinant OcSus proteins
Sucrose synthase has the unique feature of catalyzing in vivo the synthesis and cleavage of sucrose. Therefore, functional characterization of Sus in both the two directions was performed in the present investigation.
Assays for Sus in the synthesis direction are typically based on the amount of sucrose or uridine diphosphate (UDP) formed.53,61–65 Sucrose can be produced when the substrates UDP-D-Glc and D-fructose were both present in the reaction system containing purified OcSus proteins. In this study, we utilized the anthrone procedure, a colorimetric method, to determine the sucrose formed. The anthrone-based method depends on destruction of reducing sugars with hot alkali, followed by determination of the fructose moiety of sucrose, using cold anthrone. As shown in Fig. 5(A), the obvious color change can be seen in reactive tubes containing the recombinant protein after addition of anthrone solution, which provides a visualized evidence of the existence of sucrose, indicating that all the three OcSus proteins can catalyze the synthesis of sucrose. Further observation revealed that the degree of color change in the three tubes containing respective OcSus proteins is not the same. Dark and light blue-green colors are respectively formed in the reaction system containing OcSus1 or OcSus2, while light olive-green color was obtained in the tube harboring OcSus3, which indicated that the three proteins have different synthetic activity. The synthetic activity of OcSus1 is deemed to be the strongest, followed by OcSus2, and OcSus3 has the weakest activity according to the color depth. Further experiments were carried out to explore pH profiles of sucrose synthesis reaction catalyzed by OcSus proteins. As illustrated in Fig. 5(B), OcSus1 and OcSus2 have similar pH profile and both of the two proteins can synthesize sucrose at pH 2–11. The yield of sucrose catalyzed by both of the two Sus proteins showed double peak shape with the change of pH. With pH from 2 to 5, the ability of these two enzymes to synthesize sucrose gradually increased. As pH continues to rise, a sharp decrease in the production of sucrose was observed. When pH reached about 6, the yield of sucrose was the least. With the increase of pH, the production of sucrose gradually increased and reached the maximum when pH was around 9. And then, the amount of sucrose turned to decrease with the continue increase of pH, and the content of sucrose was almost zero when pH was about 11. The pH optimum of the two proteins is at pH 9, which is consistent with other sucrose synthase isoenzymes reported previously.55,66–69 However, OsSus3 differed in its ability to synthesize sucrose in response to varying pH conditions. OcSus3 is active over a broader pH range of 2–12 and exhibits maximum activity at pH 3. This is the first sucrose synthase with optimal acidic pH in synthesis direction and indicates that OcSus3 is a unique sucrose synthase which is different from any previous sucrose synthase. Moreover, unlike that of OcSus1 and OcSus2 proteins, the pH profile of OcSus3 showed a three-spike shape (Fig. 5).
 |
| Fig. 5 Products formation catalyzed by OcSus proteins in the sucrose synthesis direction (panel A) and pH profiles of OcSus proteins in the sucrose synthesis direction (panel B). | |
The cleavage activity of sucrose synthase was monitored by a combination of Ion-pair RP-HPLC and LC-MS. Ion-pair RP-HPLC is one of the well-established techniques used for separation of nucleotides and nucleotide sugars. In the present investigation, negatively charged UDP-D-Glc is able to bind the ion-pairing reagent tetrabutylammonium hydrogensulfate, which significantly increase the retention time of the nucleotide sugar, thus leading to a well-shaped and clearly separated single peak as shown in Fig. 6. When substrates sucrose and UDP were incubated with a recombinant OcSus protein, a new peak, with the same retention time and UV spectra as the authentical UDP-D-Glc, was detected in the HPLC profile (Fig. 6, indicated by a dotted line). To further verify that the newly formed reaction product represented exactly UDP-D-Glc, the UDP-D-Glc standard was co-injected with the reaction mixture under the HPLC-based assay. Only a UDP-D-Glc peak with no shouldering was found by HPLC analysis, suggesting UDP-D-Glc was produced from breakdown reaction of sucrose and UDP in all three types of sucrose synthases (Fig. 6, panel D). Finally, the identity of UDP-D-Glc was confirmed by mass spectrometry. The cleavage products of sucrose and UDP catalyzed by OcSuss exhibited an ion at m/z 565.147, which is identical to that of UDPG standard.70 Taken together, these data unambiguously confirmed that the newly formed product via cleavage reaction catalyzed by three types of recombinant OcSus proteins is UDP-D-Glc.
 |
| Fig. 6 HPLC analysis of the breakdown products catalyzed by purified OcSus1 (A), OcSus2 (B) and OcSus3 (C). Trace 1 refers to HPLC analysis of reaction products catalyzed by purified OcSus protein; Traces 2 and 3 show HPLC profiles of the standard UDP and UDP-D-Glc; Trace 4 stands for HPLC profile of reaction products catalyzed by boiled OcSus protein as the control. (D) HPLC profiles of co-injection of breakdown products of OcSus1 with authentic standard UDPG. Trace 1 refers to HPLC analysis of reaction products catalyzed by purified OcSus1 protein; Traces 2 shows HPLC profile of co-injection of reaction products and the standard UDPG; Trace 3 stands for HPLC profile of the authentic standard UDPG. | |
To investigate the substrates preference of OcSus isoforms, other nucleotide substrates like ADP, CDP, GDP and TDP were also used to incubate with sucrose in the sucrose breakdown direction. The effect of varied nucleotide diphosphates on the sucrose cleavage activity is presented in Table 3. Among the substrates tested, only UDP facilitated sucrose cleavage for the three sucrose synthases. TDP is much less effective than UDP and able to only act as the substrate of OcSus1. Other nucleoside diphosphates, however, were completely inactive as the substrates for all the OcSus isoforms (Table 3). The preference for UDP of OcSuss is in agreement with that of other plant sucrose synthases.2,55 However, unlike UDP-specificity of OcSus2 and OcSus3, other plant Sus proteins are able to use ADP, CDP, GDP, and TDP as alternative acceptors to some extent.2,55
Table 3 Substrates specificity of OcSus proteins in the cleavage reaction with sucrose. −, no activity; +, detectable activity
Enzyme |
UDP |
ADP |
TDP |
GDP |
CDP |
OcSus1 |
+ |
− |
+ |
− |
− |
OcSus2 |
+ |
− |
− |
− |
− |
OcSus3 |
+ |
− |
− |
− |
− |
3.6. Effect of pH on OcSus isoform activities
The three sucrose synthase isoforms exhibited different pH profiles in their ability to cleave sucrose (Fig. 7). OcSus1 cleaved sucrose over a broader pH range and exhibited maximum activity at pH 7.0. OcSus1 held 20% activity when pH declined to 5 or increased to 11 (Fig. 7). As for OcSus2, when pH declined to 5, the cleavage activity was completely lost. The cleavage activity of OcSus2 improved as pH increased from 5 to 7 and reached the highest activity at pH 7.0 (Fig. 7). Their optimum pH is comparable to that of Sus proteins from other species such as Solanum tuberosum L. (pH 7.6),55 Thermosynechococcus elongatus (pH 7.0)71 and Daucus carota (pH 7.0).69 Unlike OcSus1 and OcSus2, OcSus3 displayed optimum cleavage activity at pH 5 (Fig. 7). Enzymatic activity of OcSus3 increased sharply from pH 4 to 5. With the further increase of pH from 5 to 10, the cleavage activity of OcSus3 decreased slowly. OcSus3 lost its activity completely when pH reached 10 (Fig. 7).
 |
| Fig. 7 Influence of assay pH on activity of OcSus proteins. | |
3.7. Effect of temperature on OcSus isoform activities
Temperature profiles of OcSus isoforms were made by determining the activity in the cleavage direction from 4 to 80 °C. As shown in Fig. 8, OcSus2 cleaved sucrose in the temperature range of 4–80 °C and displayed maximum activity at 37 °C. OcSus1 and OcSus3, however, exhibited different temperature profile from that of OcSus2 (Fig. 8). Both of two proteins display high-temperature optima of 50 °C (Fig. 8), which is consistent with that of sucrose synthases from Solanum tuberosum L. (56 °C),55 Daucus carota (55 °C),69 and Thermosynechococcus elongatus (60 °C).71
 |
| Fig. 8 Effect of temperature on sucrose cleaving activities of OcSus isoforms. | |
3.8. Effect of divalent cations on OcSus isoform activities
Different concentrations of divalent cations including Mg2+, Ca2+, Zn2+, Mn2+, Co2+ and Cu2+ were used to test the effect on sucrose breakdown reaction of OcSus isoenzymes. Related results are summarized in Fig. 9. Mg2+ has been frequently reported to have stimulatory29,47,72 or inhibitory29,67,73,74 effect on cleavage activity of Sus. In the present investigation, when different concentrations of Mg2+ was included in the reaction system, a slight inhibitory effect toward the direction of UDP-D-Glc synthesis of all the three isoforms was observed (Fig. 9). Ca2+ was also deemed to either positively47,69 or negatively67,72,74 influence the UDPG-synthesizing activity of varied Sus isoforms. This notion is consistent with our result. Ca2+ at 0.5–10 mM showed stimulatory effect on Suc-cleavage activity of OcSus1 and OcSus2. Moreover, the stimulatory effect is dependent on the concentrations of Ca2+. Ca2+ at 0.5 mM showed slight stimulation on OcSus1 and OcSus2 in the direction of UDPG synthesis. And these stimulations maintained with the increase of Ca2+ concentrations. A highly significant difference of stimulatory effect between OcSus1 (170%) and OcSus2 (10%) was occurred when 10 mM was included in reaction mixtures of OcSus1 and OcSus2. On the contrary, in the direction of sucrose cleavage, Ca2+ showed inhibitory effect on OcSus3 activity (Fig. 9). When different concentrations of Mn2+ were included in reaction mixtures, on the Suc-cleavage direction, three activities were weakly inhibited with almost the same degree. Similar effects were also reported for other Sus from Japanese Pear,67 Leleba oldhami,72 soybean47 and Daucus carota.69 Zn2+ showed inhibitory action on the sucrose cleavage activities of OcSus1–3. The inhibitory profiles of the three sucrose synthases varied significantly. The sucrose breakdown activities of OcSus1 and OcSus3 declined with the increase of Zn2+ concentrations. The maximum inhibition occurred when 10 mM Zn2+ was included in reaction mixtures of OcSus1 and OcSus3. Especially for OcSus3, when 10 mM Zn2+ was supplemented to the reaction mixture, the activity of OcSus3 was almost undetectable in the UDPG-forming direction. OcSus2 activity was also inhibited by different concentrations of Zn2+. However, the maximum inhibition of OcSus2 activity in the UDPG-synthesizing direction occurred at 8 mM Zn2+. Co2+ displayed inhibitory effect on sucrose cleavage activity of OcSus1–3. The maximum inhibitory concentrations of Co2+ on OcSus1–3 were different. Co2+ at 1 mM inhibited the Suc-cleavage activity of OcSus1 by 20%, while both OcSus2 and 3 lost 50% of their activities in the sucrose cleavage breakdown direction at 2 mM Co2+. Cu2+ displayed significant inhibitory effect on the cleavage reactions of all the three Sus isoforms. The Cu2+ tolerance of the three sucrose synthases, however, varied significantly. The sucrose cleavage activity of OcSus1 fell sharply at 0.5 mM Cu2+, reaching to 5% of the control activity. With the increase of Cu2+ concentrations, the activity of OcSus1 continued to drop. The cleavage activity of OcSus1 was undetectable when 2 mM Cu2+ was added to the reaction system. And then, the activity of OcSus1 began to rise with the increase of Cu2+ from 3 to 10 mM. Similar effects of OcSus2 exerted by various Cu2+ were also occurred. Unlike OcSus1 and OcSus2, OcSus3 displayed better tolerance toward Cu2+. As illustrated in Fig. 9, the cleavage activity of OcSus3 dropped gradually with the increase of Cu2+ and kept 20% residual activity at 10 mM of Cu2+. The strongly inhibitory effect on cleavage activity of Sus exerted by Zn2+, Co2+ and Cu2+ was also described previously.55,67,72
 |
| Fig. 9 Effect of divalent cations on the cleaving activities of OcSus proteins. | |
3.9. Kinetic parameters of OcSus isoforms
The Suc-cleavage activity of the three sucrose synthase nearly conformed to Michaelis–Menten kinetics (Fig. 10). Kinetic parameters of OcSus1–3 were analyzed by Lineweaver–Burk plots and summarized in Table 4. As shown in Table 4, the three Km values for UDP were all smaller than that for sucrose, suggesting a higher affinity for UDP than sucrose in the three Sus isoforms. These kinetics properties are similar to those observed for other sucrose synthases from plants like Beta vulgaris L.,66 Japanese Pear67 and Pisum sativum L.68 The Km value (0.09654 ± 0.01154 mM) for UDP of OcSus2 is the smallest among that of the three O. caudatum Sus, indicating OcSus2 has a highest affinity for UDP. On the other hand, OcSus1 has a highest affinity for sucrose, which is reflected by its small Km value for sucrose (2.228 ± 0.109 mM). The Vmax value of OcSus1 acting on either UDP or sucrose is the highest among the three sucrose synthase.
 |
| Fig. 10 Effect of substrates (UDP and sucrose) concentrations on the cleavage activities of OcSus1 (A and B), OcSus2 (C and D) and OcSus3 (E and F). Recombinant forms of three OcSus proteins purified from E. coli were assayed in the direction of sucrose cleavage. A, C and E are plots of initial velocity against UDP concentration for reactions of OcSus1, OcSus2 and OcSus3, respectively. B, D and F are plots of initial velocity against sucrose concentration for reactions of the three Sus enzymes. | |
Table 4 Kinetic parameters for OcSus isoforms for sucrose degradation reaction Km and Vmax were calculated using Lineweaver–Burk plots. Values are mean of three determinations ± SE
|
Substrate |
Km (mM) |
Vmax (mM h−1) |
OcSus1 |
UDP |
0.3131 ± 0.01151 |
0.1236 ± 1.325 × 10⁻³ |
Sucrose |
2.228 ± 0.109 |
0.1899 ± 3.983 × 10⁻³ |
OcSus2 |
UDP |
0.09654 ± 0.01154 |
0.01167 ± 3.824 × 10⁻⁴ |
Sucrose |
14.39 ± 1.104 |
0.07611 ± 4.074 × 10⁻³ |
OcSus3 |
UDP |
0.1553 ± 0.02 |
0.00667 ± 2.8 × 10⁻⁴ |
Sucrose |
15.26 ± 2.534 |
0.05914 ± 7.192 × 10⁻³ |
3.10. Determination of OcSus enzymes responsible for glucose-containing polysaccharides biosynthesis
Three OcSus genes were assumed to be responsible for UDP-D-glucose biosynthesis in O. caudatum. There are no exact evidences, however, to show which genes are involved in the biosynthesis of glucose-containing polysaccharides in O. caudatum. Preliminary activity screening assays indicated that polysaccharides crude from cultivated and sterile bulbs both exhibited potent cytostatic activities on various malignant tumor cells such as A549 human lung carcinoma cells (IC50 = 20.01 and 18.48 μg mL−1) and A2780 human ovarian carcinoma cells (both less than 0.5 μg mL−1), suggesting the presence of a common operating pathway of glucose-containing polysaccharides in the two bulbs. This finding provides a clue that genes highly expressed in both the two bulbs are the exact members responsible for biosynthetic pathway of glucose-containing polysaccharides.
Expression profiles of OcSus genes, therefore, were performed based on RT-qPCR analyses in various tissues including roots, leaves, bulbs, flowers, bulblets and sterile bulbs (Fig. 11). Fig. 12 illustrated the relative transcript level of the three OcSus genes standardized to the constitutive GAPDH gene expression level. As indicated in Fig. 12, the expression of the three OcSus genes was detected in all tissues tested, though at varied levels. This divergent expression pattern of Sus genes in one family was also described in previous reports.39,75 As illustrated in Fig. 12, highest levels of OcSus3 transcripts were found in the leaf, suggesting that this gene played a predominant role in sucrose metabolism during the leaf development. Moreover, compared to that in bulb, the transcript level of OcSus3 in bulblet, a growing stem, increased by about 9-fold, indicating a function of sucrose synthase in sucrose utilization for growth. Additionally, the transcript levels of OcSus3 in roots increased 4-fold than that in bulblets. Roots are heterotrophic sink organs for sucrose storage. Hence, the high expression of OcSus3 in roots revealed its possible role in sucrose utilization for growth. On the contrary, OcSus1 and OcSus2 were expressed predominately in sterile bulbs, which are cultivated in 6,7-V medium containing 80 g L−1 sucrose. The high levels of transcripts of OcSus1 and OcSus2 in sterile bulbs are, therefore, likely result from their sucrose-inducibility. Elevated activity had been found in association with starch storage11,22,49,76 and polysaccharides biosynthesis.27,77 Therefore, OcSus1 and OcSus2 were deemed to be responsible for the biosynthesis of glucose-containing polysaccharides, including OCAP-2-1, OCAP-2-2, OCAP-3-1 or OCAP-3-3 in O. caudatum.
 |
| Fig. 11 Plant tissues, including root, bulb, bulblet and leaf (A), flower (B) and sterile bulb (C) of O. caudatum used in this study. | |
 |
| Fig. 12 Real time quantitative PCR analysis of OcSus gene family in different tissues of O. caudatum. | |
4. Conclusions
OCAP-2-1, OCAP-2-2, OCAP-3-1 and OCAP-3-3, four glucose-containing polysaccharides from O. caudatum, exhibited an antitumor activity, suggesting their potential application as natural antitumor drugs. However, the cDNAs responsible for the conversion of sucrose to polysaccharides from O. caudatum have not been identified, including sucrose synthase genes. In this contribution, a total of three full-length cDNA encoding sucrose synthase were isolated for the first time from O. caudatum by a transcriptome-wide search. These candidates were then well characterized as the key enzyme participating in sucrose metabolism by in vitro enzyme catalysis. Most important, the present investigation first verified the involvement of OcSus1 and OcSus2 in biosynthesis of these four glucose-containing polysaccharides in O. caudatum.
Abbreviations
NDP | Nucleotide diphosphate |
NDPG | Nucleotide diphosphate glucose |
UDP-L-Ara | UDP-L-arabinose |
UDP-D-Gal | UDP-D-galactose |
UDP-D-GalA | UDP-D-galacturonic acid |
UDP-D-Glc | UDP-D-glucose |
UDP-D-GlcA | UDP-D-glucuronic acid |
UDP-D-Xyl | UDP-D-xylose |
Sus | Sucrose synthase |
Acknowledgements
The authors thank Prof. Cheng KD and Wang W for providing the sterile bulb of Ornithogalum caudatum. This work was supported by Independent Subject of Key Project of State Key Laboratory of Bioactive Substance and Function of Natural Medicines (GTZA201404) and Institute of Materia Medica Foundation (2016ZD01).
References
- L. Bungaruang, A. Gutmann and B. Nidetzky, Adv. Synth. Catal., 2013, 355, 2757–2763 CrossRef CAS PubMed.
- L. Elling, M. Grothus and M. R. Kula, Glycobiology, 1993, 3, 349–355 CrossRef CAS PubMed.
- C. H. Haigler, M. Ivanova-Datcheva, P. S. Hogan, V. V. Salnikov, S. Hwang, K. Martin and D. P. Delmer, Plant Mol. Biol., 2001, 47, 29–51 CrossRef CAS PubMed.
- G. Q. Tang and A. Sturm, Plant Mol. Biol., 1999, 41, 465–479 CrossRef CAS PubMed.
- X. Wen, W. Zhang, Y. Feng and X. Yu, Mol. Biol. Rep., 2010, 37, 695–702 CrossRef CAS PubMed.
- G. Cai, C. Faleri, C. Del Casino, A. M. C. Emons and M. Cresti, Plant Physiol., 2011, 155, 1169–1190 CrossRef CAS PubMed.
- D. Persia, G. Cai, C. Del Casino, C. Faleri, M. T. Willemse and M. Cresti, Plant Physiol., 2008, 147, 1603–1618 CrossRef CAS PubMed.
- M. C. Baier, M. Keck, V. Gödde, K. Niehaus, H. Küster and N. Hohnjec, Plant Physiol., 2010, 152, 1000–1014 CrossRef CAS PubMed.
- M. C. Baier, A. Barsch, H. Küster and N. Hohnjec, Plant Physiol., 2007, 145, 1600–1618 CrossRef CAS PubMed.
- H. D. Coleman, L. Beamish, A. Reid, J.-Y. Park and S. D. Mansfield, Transgenic Res., 2010, 19, 269–283 CrossRef CAS PubMed.
- Q. Jiang, J. Hou, C. Hao, L. Wang, H. Ge, Y. Dong and X. Zhang, Funct. Integr. Genomics, 2011, 11, 49–61 CrossRef CAS PubMed.
- X. Xiao, C. Tang, Y. Fang, M. Yang, B. Zhou, J. Qi and Y. Zhang, FEBS J., 2014, 281, 291–305 CrossRef CAS PubMed.
- H. D. Coleman, J. Yan and S. D. Mansfield, Proc. Natl. Acad. Sci. U. S. A., 2009, 106, 13118–13123 CrossRef CAS PubMed.
- A. Zervosen, U. Römer and L. Elling, J. Mol. Catal. B: Enzym., 1998, 5, 25–28 CrossRef CAS.
- L. Elling and M.-R. Kula, Enzyme Microb. Technol., 1995, 17, 929–934 CrossRef CAS.
- L. Elling, M. Grothus, A. Zervosen and M.-R. Kula, Ann. N. Y. Acad. Sci., 1995, 750, 329–331 CrossRef CAS PubMed.
- N. Brinkmann, M. Malissard, M. Ramuz, U. Römer, T. Schumacher, E. G. Berger, L. Elling, C. Wandrey and A. Liese, Bioorg. Med. Chem. Lett., 2001, 11, 2503–2506 CrossRef CAS PubMed.
- A. Gutmann, L. Bungaruang, H. Weber, M. Leypold, R. Breinbauer and B. Nidetzky, Green Chem., 2014, 16, 4417–4425 RSC.
- K. Terasaka, Y. Mizutani, A. Nagatsu and H. Mizukami, FEBS Lett., 2012, 586, 4344–4350 CrossRef CAS PubMed.
- M. H. Son, B. G. Kim, D. H. Kim, M. Jin, K. Kim and J. H. Ahn, J. Microbiol. Biotechnol., 2009, 19, 709–712 Search PubMed.
- S. Masada, Y. Kawase, M. Nagatoshi, Y. Oguchi, K. Terasaka and H. Mizukami, FEBS Lett., 2007, 581, 2562–2566 CrossRef CAS PubMed.
- R. Kodzius and T. Gojobori, Marine Genomics, 2015, 24(1), 21–30 CrossRef PubMed.
- C. Cardini, L. F. Leloir and J. Chiriboga, J. Biol. Chem., 1955, 214, 149–155 CAS.
- Z. Bieniawska, D. H. Paul Barratt, A. P. Garlick, V. Thole, N. J. Kruger, C. Martin, R. Zrenner and A. M. Smith, Plant J., 2007, 49, 810–828 CrossRef CAS PubMed.
- W. B. Chiu, C. H. Lin, C. J. Chang, M. H. Hsieh and A. Y. Wang, New Phytol., 2006, 170, 53–63 CrossRef CAS PubMed.
- M. A. Kolman, L. L. Torres, M. L. Martin and G. L. Salerno, Planta, 2012, 235, 955–964 CrossRef CAS PubMed.
- L. Curatti, L. E. Giarrocco, A. C. Cumino and G. L. Salerno, Planta, 2008, 228, 617–625 CrossRef CAS PubMed.
- L. Curatti, A. C. Porchia, L. Herrera-Estrella and G. L. Salerno, Planta, 2000, 211, 729–735 CrossRef CAS PubMed.
- M. Diricks, F. De Bruyn, P. Van Daele, M. Walmagh and T. Desmet, Appl. Microbiol. Biotechnol., 2015, 99, 8465–8474 CrossRef CAS PubMed.
- S. Baud, M. N. Vaultier and C. Rochat, J. Exp. Bot., 2004, 55, 397–409 CrossRef CAS PubMed.
- S. Chopra, J. Del-favero, R. Dolferus and M. Jacobs, Plant Mol. Biol., 1992, 18, 131–134 CrossRef CAS PubMed.
- C. Barrero-Sicilia, S. Hernando-Amado, P. Gonzalez-Melendi and P. Carbonero, Planta, 2011, 234, 391–403 CrossRef CAS PubMed.
- P. S. de la Hoz, J. Vicente-Carbajosa, M. Mena and P. Carbonero, FEBS Lett., 1992, 310, 46–50 CrossRef.
- M. Gupta, P. S. Chourey, B. Burr and P. E. Still, Plant Mol. Biol., 1988, 10, 215–224 CrossRef CAS PubMed.
- S. J. Carlson, P. S. Chourey, T. Helentjaris and R. Datta, Plant Mol. Biol., 2002, 49, 15–29 CrossRef CAS PubMed.
- D. H. Barratt, L. Barber, N. J. Kruger, A. M. Smith, T. L. Wang and C. Martin, Plant Physiol., 2001, 127, 655–664 CrossRef CAS PubMed.
- I. Horst, T. Welham, S. Kelly, T. Kaneko, S. Sato, S. Tabata, M. Parniske and T. L. Wang, Plant Physiol., 2007, 144, 806–820 CrossRef CAS PubMed.
- M. Z. Islam, X. M. Hu, L. F. Jin, Y. Z. Liu and S. A. Peng, PLoS One, 2014, 9, e113623 Search PubMed.
- X. An, Z. Chen, J. Wang, M. Ye, L. Ji, J. Wang, W. Liao and H. Ma, Gene, 2014, 539, 58–67 CrossRef CAS PubMed.
- T. Hirose, G. N. Scofield and T. Terao, Plant Sci., 2008, 174, 534–543 CrossRef CAS.
- J. I. Cho, H. B. Kim, C. Y. Kim, T. R. Hahn and J. S. Jeon, Mol. Cells, 2011, 31, 553–561 CrossRef CAS PubMed.
- A. Chen, S. He, F. Li, Z. Li, M. Ding, Q. Liu and J. Rong, BMC Plant Biol., 2012, 12, 85 CrossRef CAS PubMed.
- R. Chen, F. Meng, Z. Liu, R. Chen and M. Zhang, Carbohydr. Polym., 2010, 80, 845–851 CrossRef CAS.
- Y. Tang, B. Yu, J. Hu, T. Wu and H. Hui, J. Nat. Prod., 2002, 65, 218–220 CrossRef CAS.
- I. A. Veliky and S. M. Martin, Can. J. Microbiol., 1970, 16, 223–226 CrossRef CAS PubMed.
- J. Q. Kong, D. Lu and Z. B. Wang, Molecules, 2014, 19, 1608–1621 CrossRef PubMed.
- Z.-B. Wang, X. Chen, W. Wang, K.-D. Cheng and J.-Q. Kong, RSC Adv., 2014, 4, 27159–27175 RSC.
- L. Guo and J.-Q. Kong, Z. Naturforsch., C: J. Biosci., 2014, 69, 259–270 CAS.
- L. Guo, X. Chen, L.-N. Li, W. Tang, Y.-T. Pan and J.-Q. Kong, Microb. Cell Fact., 2016, 15, 27 CrossRef PubMed.
- M. A. Larkin, G. Blackshields, N. P. Brown, R. Chenna, P. A. McGettigan, H. McWilliam, F. Valentin, I. M. Wallace, A. Wilm, R. Lopez, J. D. Thompson, T. J. Gibson and D. G. Higgins, Bioinformatics, 2007, 23, 2947–2948 CrossRef CAS PubMed.
- K. Tamura, D. Peterson, N. Peterson, G. Stecher, M. Nei and S. Kumar, Mol. Biol. Evol., 2011, 28, 2731–2739 CrossRef CAS PubMed.
- E. M. Klann, R. T. Chetelat and A. B. Bennett, Plant Physiol., 1993, 103, 863–870 CAS.
- D. Miron and A. A. Schaffer, Plant Physiol., 1991, 95, 623–627 CrossRef CAS PubMed.
- E. van Handel, Anal. Biochem., 1968, 22, 280–283 CrossRef PubMed.
- U. Romer, H. Schrader, N. Gunther, N. Nettelstroth, W. B. Frommer and L. Elling, J. Biotechnol., 2004, 107, 135–149 CrossRef CAS PubMed.
- Y. Amor, C. H. Haigler, S. Johnson, M. Wainscott and D. P. Delmer, Proc. Natl. Acad. Sci. U. S. A., 1995, 92, 9353–9357 CrossRef CAS.
- P. Geigenberger, S. Langenberger, I. Wilke, D. Heineke, H. Heldt and M. Stitt, Planta, 1993, 190, 446–453 CrossRef CAS.
- J. Huggett, K. Dheda, S. Bustin and A. Zumla, Genes Immun., 2005, 6, 279–284 CrossRef CAS PubMed.
- K. Nishihara, M. Kanemori, M. Kitagawa, H. Yanagi and T. Yura, Appl. Environ. Microbiol., 1998, 64, 1694–1699 CAS.
- F. Baneyx and M. Mujacic, Nat. Biotechnol., 2004, 22, 1399–1408 CrossRef CAS PubMed.
- N. L. Hubbard, S. C. Huber and D. M. Pharr, Plant Physiol., 1989, 91, 1527–1534 CrossRef CAS PubMed.
- J. Willenbrink, G. Bonnett, S. Willenbrink and I. Wardlaw, New Phytol., 1998, 139, 471–478 CAS.
- B. Nguyen-Quoc, M. Krivitzky, S. C. Huber and A. Lecharny, Plant Physiol., 1990, 94, 516–523 CrossRef CAS PubMed.
- J. R. Nascimento, B. R. Cordenunsi and F. M. Lajolo, J. Agric. Food Chem., 1997, 45, 1103–1107 CrossRef CAS.
- S. Ajlouni and M. K. Hamdy, J. Food Sci., 1988, 53, 477–481 CrossRef CAS.
- K. L. Klotz, F. L. Finger and W. L. Shelver, Plant Physiol. Biochem., 2003, 41, 107–115 CrossRef CAS.
- K. Tanase and S. Yamaki, Plant Cell Physiol., 2000, 41, 408–414 CrossRef CAS PubMed.
- A. Dejardin, C. Rochat, S. Maugenest and J. P. Boutin, Planta, 1997, 201, 128–137 CrossRef CAS PubMed.
- V. Sebkova, C. Unger, M. Hardegger and A. Sturm, Plant Physiol., 1995, 108, 75–83 CAS.
- Y. Zou, M. Xue, W. Wang, L. Cai, L. Chen, J. Liu, P. G. Wang, J. Shen and M. Chen, Carbohydr. Res., 2013, 373, 76–81 CrossRef CAS PubMed.
- C. M. Figueroa, M. D. Asencion Diez, M. L. Kuhn, S. McEwen, G. L. Salerno, A. A. Iglesias and M. A. Ballicora, FEBS Lett., 2013, 587, 165–169 CrossRef CAS PubMed.
- J.-C. Su, J.-L. Wu and C.-L. Yang, Plant Physiol., 1977, 60, 17–21 CrossRef CAS PubMed.
- J. C. Su and J. Preiss, Plant Physiol., 1978, 61, 389–393 CrossRef CAS PubMed.
- D. Y. Huang and A. Y. Wang, Biochem. Mol. Biol. Int., 1998, 46, 107–113 CAS.
- Z. Wang, P. Wei, M. Wu, Y. Xu, F. Li, Z. Luo, J. Zhang, A. Chen, X. Xie, P. Cao, F. Lin and J. Yang, Planta, 2015, 242, 153–166 CrossRef CAS PubMed.
- Z. Wang, Y. Xu, T. Chen, H. Zhang, J. Yang and J. Zhang, Planta, 2015, 241, 1091–1107 CrossRef CAS PubMed.
- J. P. Gao, D. Wang, L. Y. Cao and H. F. Sun, PLoS One, 2015, 10, e0117342 Search PubMed.
Footnote |
† Electronic supplementary information (ESI) available. See DOI: 10.1039/c5ra27611j |
|
This journal is © The Royal Society of Chemistry 2016 |
Click here to see how this site uses Cookies. View our privacy policy here.