 Open Access Article
Creative Commons Attribution 3.0 Unported Licence
Directly deposited Nafion/TiO2 composite membranes for high power medium temperature fuel cells†
Niklas
Wehkamp
*ae,
Matthias
Breitwieser
a,
Andreas
Büchler
b,
Matthias
Klingele
a,
Roland
Zengerle
ac and
Simon
Thiele
ad
aLaboratory for MEMS Applications, IMTEK Department of Microsystems Engineering, University of Freiburg, Georges-Koehler-Allee 103, 79110 Freiburg, Germany. E-mail: Niklas.Wehkamp@uniklinik-freiburg.de
bFraunhofer Institute for Solar Energy Systems, Heidenhofstr. 2, 79110 Freiburg, Germany
cBIOSS – Centre for Biological Signalling Studies, University Freiburg, Germany
dFIT, University of Freiburg, Georges-Köhler-Allee 105, 79110 Freiburg, Germany
eDepartment of Radiology, Medical Physics, University Hospital Freiburg, Germany
First published on 26th February 2016
Abstract
This work presents a simple production method for TiO2 reinforced Nafion® membranes which are stable up to a 120 °C operation temperature. The novel TiO2 reinforced membranes yield a maximum power density of 2.02 W cm−2 at 120 °C; H2/O2; 0.5/0.5 L min−1; 90% RH, 300/300 kPaabs. This is 2.8 times higher than the highest power density for TiO2 reinforced membranes so far published in literature. The described membranes even exceed the maximum power density of a commercial Nafion® HP membrane in an identical measurement setup at 100 °C and 120 °C. Compared to the commercial Nafion® HP membrane the maximum power density was increased by 27% and 9% at 100 °C and 120 °C, respectively. The membrane is manufactured by drop-casting a dispersion of Nafion® and TiO2 nanoparticles onto both the anode and cathode gas diffusion electrodes. Furthermore pure Nafion® membranes manufactured by the same method had higher membrane resistances at temperatures >100 °C than TiO2-reinforced Nafion® membranes.
Introduction
Medium temperature polymer electrolyte membrane fuel cells (MT-PEMFC), typically operating at temperatures from 100 to 120 °C, bear several advantages compared to the more common low temperature PEM fuel cells (LT-PEMFC), operating at 80 °C.1–7 The fuel cell cooling systems, for instance in automotive applications, can be strongly simplified due to the higher temperature gradient from the fuel cell stack to ambient temperature.7 Moreover, the kinetics of the anode and cathode reactions are enhanced at elevated temperatures.3,6 Furthermore, the catalyst poisoning gas CO reacts to form CO2 more quickly at higher temperatures, effectively enhancing the catalyst poisoning tolerance.1,5,6 Consequently, operating fuel cells at even higher temperatures would be beneficial. However, at temperatures above 120 °C the fuel cell stack start-up procedure becomes time-consuming, and thus less suitable for automobile applications.6 Furthermore, Nafion based membranes proton conductivity diminishes at such temperatures.3 For this reason, MT-PEMFCs, typically operating at 100–120 °C are increasingly of interest and subject to significant recent research.5,8 Here, major issues are large deficits in terms of cell performance and durability.9,10Common approaches to meet the requirements of an MT-PEMFC include reinforcement of traditional Nafion® membranes by numerous additives such as inorganic nanoparticles, nanofibers, zeolites, or temperature-stable polymers.6,8,11–18 These additives were found to enhance mechanical and chemical stability at higher temperatures. This enables MT-PEMFC operation above 80 °C also with Nafion® as membrane ionomer. Furthermore, additives such as TiO2 nanoparticles are reported to improve membrane hydration at elevated temperatures.3,15,19 Without additives, Nafion® membranes operated above 80 °C typically show a strong decrease in proton conductivity with increasing temperature.9,17,19 In recent work, direct membrane deposition (DMD) was developed as novel fabrication method for LT-PEMFC membrane electrode assemblies (MEA).20 This method consists in replacing the conventional membrane foil by two Nafion® layers deposited directly on top of anode and cathode gas diffusion electrodes (GDEs). The fuel cell is assembled with the GDEs facing each other. Very low membrane resistances of 12.7 mΩ cm2 were reported, enabling high current densities of about 5 A cm−2 at 0.6 V and power densities of 4 W cm−2 (operation conditions: H2/O2; 0.5/0.5 L min−1; 70 °C; 100% RH, 300/300 kPaabs).20 In this work, a TiO2 reinforced, Nafion®-based MT-PEMFC is presented that was manufactured alike with a directly deposited membrane. By simple pipette drop-casting of a mixture of Nafion dispersion and TiO2 nanoparticles onto gas diffusion electrodes, a thin fuel cell membrane of only 15 μm thickness was realized, yielding a power density of more than 2 W cm−2 at 120 °C operation temperature.
Experimental
Drop-casting was used to coat gas diffusion electrodes (GDEs) of a proton exchange membrane fuel cell with a dispersion containing Nafion® as ionomer and TiO2 nanoparticles as additive. The GDEs (5 cm2, Paxitech SAS, France) contained a catalyst loading of 0.5 mg Pt cm−2 with 70% Pt/C on each anode and cathode side. The dispersion consisted of a 1![[thin space (1/6-em)]](https://www.rsc.org/images/entities/char_2009.gif) :
:![[thin space (1/6-em)]](https://www.rsc.org/images/entities/char_2009.gif) 3 mixture of Nafion® D2020 (Dupont) and 2-propanol. As additive, 5 wt% per Nafion® content of TiO2 nanoparticles were added to the dispersion. This mixture yields a final 20
3 mixture of Nafion® D2020 (Dupont) and 2-propanol. As additive, 5 wt% per Nafion® content of TiO2 nanoparticles were added to the dispersion. This mixture yields a final 20![[thin space (1/6-em)]](https://www.rsc.org/images/entities/char_2009.gif) :
:![[thin space (1/6-em)]](https://www.rsc.org/images/entities/char_2009.gif) 1 Nafion
1 Nafion![[thin space (1/6-em)]](https://www.rsc.org/images/entities/char_2009.gif) :
:![[thin space (1/6-em)]](https://www.rsc.org/images/entities/char_2009.gif) TiO2 ratio of solids. The TiO2 nanoparticles were purchased as nano-powder from Sigma-Aldrich with an average diameter of 21 nm, a surface area of 35–65 m2 g−1 and a crystal phase ratio of 80/20% anatase/rutile.
TiO2 ratio of solids. The TiO2 nanoparticles were purchased as nano-powder from Sigma-Aldrich with an average diameter of 21 nm, a surface area of 35–65 m2 g−1 and a crystal phase ratio of 80/20% anatase/rutile.
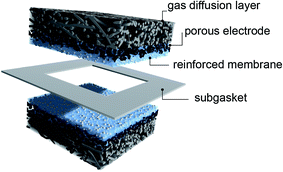
The ionomer solution was distributed manually by a pipette (Eppendorf) to cover the 5 cm2 sample area homogeneously with a 100 μL dosage. A 100 μL deposition of this dispersion resulted in an average deposited membrane loading (weight of membrane ionomer per cm2) of 1.04 ± 0.04 mg Nafion per cm2 on the GDE. This was in agreement with the calculated 1.05 mg of Nafion® in the 100 μL solution. From the average increase in mass of the GDE, we calculated an average membrane thickness gain of 5 μm per 100 μL deposition. In this work, the membrane thickness was varied in 5 μm steps, with subsequent annealing steps of 15 min at 80 °C in between. Accordingly, each drop-casting of 100 μL dispersion led to an increase of 5 μm membrane thickness. A schematic representation of the MEA investigated in this work is depicted in Fig. 1.
The ionomer-coated GDEs were assembled face to face with a 50 μm thin polytetrafluorethylene (PTFE) subgasket (Scribner, USA) in-between, as depicted in Fig. 1. The subgasket had a 2 × 2 cm2 opening in order to seal the GDE edges from internal shorting and gas crossover. Thus, the resulting active fuel cell area was 4 cm2. Two 200 μm thick rubber gaskets (Paxitech SAS, France) were used to obtain a suitable compression and sealing of the GDEs. We used graphite flow plates with serpentine flow channels (Scribner Associates Inc., USA). The assembly was torqued to 5 N m.
To investigate the beneficial impact of TiO2 reinforcement at temperatures beyond 80 °C, we compared the measurements to a reference cell with a pure Nafion® membrane that was also manufactured by direct membrane deposition. The reference dispersion consisted of a 1![[thin space (1/6-em)]](https://www.rsc.org/images/entities/char_2009.gif) :
:![[thin space (1/6-em)]](https://www.rsc.org/images/entities/char_2009.gif) 3 mixture of Nafion® D2020 (Dupont) and 2-propanol. First experiments with approximately 10 μm thick membranes showed a significantly reduced open circuit voltage (OCV) for experiments with the reference (pure Nafion®) directly deposited membrane at a temperature of 120 °C. In order to circumvent this loss in OCV and ensure comparability, membranes with a total thickness of 20 μm were produced and compared in this work.
3 mixture of Nafion® D2020 (Dupont) and 2-propanol. First experiments with approximately 10 μm thick membranes showed a significantly reduced open circuit voltage (OCV) for experiments with the reference (pure Nafion®) directly deposited membrane at a temperature of 120 °C. In order to circumvent this loss in OCV and ensure comparability, membranes with a total thickness of 20 μm were produced and compared in this work.
For further investigations, we reduced the thickness of the directly deposited TiO2 – reinforced Nafion membrane to 15 μm, as a reduction of the membrane thickness resulted in an improved fuel cell performance. All results from morphology analysis were performed using the 15 μm thick TiO2/Nafion composite DMD sample. A commercial reference MEA was purchased (Paxitech SAS) comprising a Nafion® HP membrane, identical gas diffusion media and equal catalyst loading as used for the DMD fuel cells. The 20 μm thick Nafion® HP membrane was the thinnest reinforced membrane commercially available. It is designed for high power densities at lower relative humidity environments and high operating temperatures, in accordance to the demands on the TiO2 reinforced DMD sample. This allowed a comparison of our novel reinforced directly deposited membrane to a high-performance reinforced commercial membrane.
To investigate cell performance and to evaluate the membrane resistance, a Scribner 850e fuel cell tester with integrated frequency response analyzer was used. The high frequency resistance (HFR) values were measured continuously within the 850e fuel cell tester at a frequency of 3.2 kHz. The fuel cell fixture was encased in two layers of 3.2 mm thick ceramic paper (Krager Industrieprodukte GmbH) in order to enable cell temperatures up to 120 °C. All measurements performed in this work were conducted with fixed flows of 0.5/0.5 L min−1 H2/O2. Relative humidity (RH) was adjusted to 90%. All experiments were performed at 300/300 kPaabs. These optimized operation conditions were chosen in order to exclude performance limitations due to mass transport issues and to achieve comparability between the different samples. The break in procedure consisted in cycling polarization curves until steady operation conditions were achieved (approximately after 4 h).
The polarization data was acquired by sweeping the current density in 500 mA cm−2 steps at 5 min pt−1 from OCV to low voltages, with additional steps of 25 mA cm−2 at 1 min pt−1 from OCV to 250 mA cm−2 to resolve the kinetic region. Electrochemical impedance spectroscopy was conducted at a constant cell voltage of 750 mV, with AC frequency swept from 10 kHz to 0.1 Hz.
Results & discussion
Morphology of the TiO2 reinforced directly deposited membrane
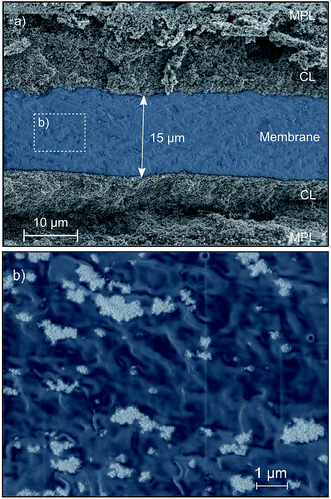
Scanning electron microscopy (SEM) was employed to investigate the morphology of the directly deposited TiO2 reinforced membrane, Fig. 2. The cross-sections were prepared by cryo-fracturing the sample in liquid nitrogen. A low electron acceleration voltage of 2 kV was used to image the sensitive polymer layer. Fig. 2 shows the cross-section of the reinforced membrane layer between anode and cathode GDEs. The SEM images were taken after fuel cell operation. As can be seen from the SEM image in Fig. 2a, the membrane had an approximate thickness of 15 μm. An SEM-image of the membrane cross-section with higher resolution is shown in Fig. 2b. Energy dispersive X-ray spectroscopy (EDX) measurements (shown in the ESI†) confirmed that the particles highlighted in white correspond to TiO2 agglomerates. These nanoparticles tended to form agglomerates in the micrometer range and were distributed inhomogeneously throughout the membrane. Similar agglomerates have been reported for Nafion/TiO2 nanocomposite membranes in the literature.23 One possible interpretation of this result is that stirring the ionomer dispersion for 24 h is insufficient to reach an agglomerate-free distribution of TiO2 particles. Alternatively, particle agglomeration may occur during the time-delay between removing the solution from the stirrer and dispensing it on the sample surface.Impact of TiO2 reinforcement
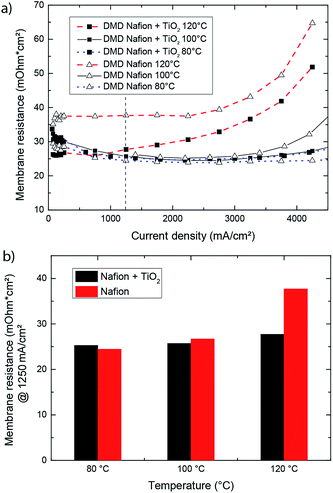
Nafion® direct deposited membranes with and without TiO2 additives were compared to prove the effectiveness of the TiO2 reinforcement. For comparison, we extracted the effective membrane resistance from the measured high frequency resistance. To calculate the effective membrane resistance it is important to take the resistance of the gas diffusion electrode into account.21 The membrane resistance was calculated by subtracting the electrical resistance of the gas diffusion electrodes and the setup from the measured high frequency resistance (Rmembrane = HFR − Relectrode). The electrical resistance of the gas diffusion electrode was determined to be 11.3 mΩ cm2, which was in accordance with reported values.20,22 The membrane resistance over current density depicted in Fig. 3a showed the influence of the TiO2 enforcement on the membrane resistance for 80, 100, and 120 °C.The pure Nafion® and TiO2-reinforced Nafion® DMD fuel cells had a similar membrane resistance at 80 °C. With increasing temperature, the effect of TiO2 reinforcement became apparent. As in Fig. 3a, the pure Nafion® DMD sample showed a stronger increase in membrane resistance with increasing temperature compared to the TiO2 reinforced Nafion® DMD cell. Fig. 3b illustrates the membrane resistance at a current density of 1250 mA cm−2 for 80 °C, 100 °C and 120 °C. At this current density, when temperature is increased from 80 °C to 120 °C, the membrane resistance of the TiO2-reinforced DMD increases by 10%, while the membrane resistance of a non-reinforced DMD sample increases by 54%. These results indicate that TiO2 reinforced Nafion® DMD cells have an enhanced temperature stability compared to pure Nafion® DMD fuel cells. Furthermore the experiment confirms the beneficial effect of TiO2 on Nafion® membrane performance at 100 °C and 120 °C as it was reported in the literature.23–25
Performance comparison to state-of-the-art reinforced membranes
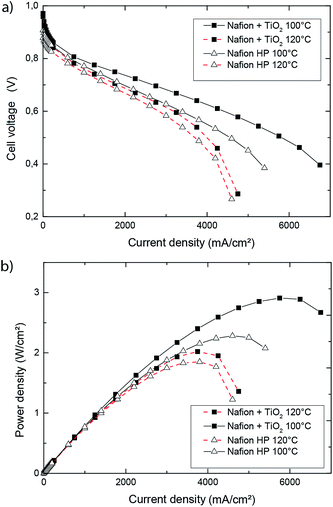
To compare the performance of the TiO2 reinforced membrane to state of the art commercial material, a Nafion® HP membrane was used as reference sample.In Fig. 4, the evolution of cell potential and power density over current density is presented for operation temperatures of 100 °C and 120 °C. As expected, the peak power densities dropped for both samples with raising temperatures. We obtained a maximum power density of 1.85 W cm−2 for the Nafion® HP reference sample at a temperature of 120 °C, whereas the TiO2 reinforced DMD fuel cell shows a peak power density of 2.02 W cm−2. At 100 °C, the Nafion® HP fuel cell had a maximum power density of 2.28 W cm−2, whereas the TiO2-reinforced DMD fuel cell had a maximum power density of 2.90 W cm−2. To our knowledge, this value is beyond any other published data for MT-PEMFCs in literature so far. These results confirm the high potential of directly deposited membranes with TiO2 reinforcement for fuel cell application in the temperature range between 100 °C and 120 °C. In the ESI† an additional comparison of the polarization data is provided, comprising all four fuel cells of this work (Nafion HP, 20 μm pure Nafion DMD, 20 μm TiO2/Nafion DMD, 15 μm TiO2/Nafion DMD) at 120 °C operation temperature. Comparing both 20 μm DMD samples, from this representation the beneficial impact of the addition of TiO2 nanoparticles can be observed. Moreover also the 20 μm thick TiO2/Nafion membrane shows higher performance compared the Nafion HP reference in spite of comparable thickness.
The superior performance of the fuel cells presented in this work becomes especially obvious if it is compared to the literature of TiO2–Nafion–PEMFC research. Table 1 lists recent results from literature. The maximum power density of the fuel cells assembled in this work reach 2.8 times the value of the best references found.
| E. Chalkova, et al.24 | M. Amjadi, et al.23 | E. I. Santiago, et al.25 | This work | |
|---|---|---|---|---|
| Operation temperature [°C] | 120 | 110 | 120 | 120 |
| Cell voltage [V] | 0.5 | 0.4 | 0.4 | 0.4 |
| Current density [A cm−2] | 1.38 | 0.2 | 1.2 | 4.2 |
| Max. power density [W cm−2] | 0.71 | 0.10 | 0.48 | 2.02 |
| TiO2 content | 10% | 5% | 10% | 5% |
Gas flow H2![[thin space (1/6-em)]](https://www.rsc.org/images/entities/char_2009.gif) : :![[thin space (1/6-em)]](https://www.rsc.org/images/entities/char_2009.gif) O2 [L min−1] O2 [L min−1] |
Not specified | 0.2![[thin space (1/6-em)]](https://www.rsc.org/images/entities/char_2009.gif) : :![[thin space (1/6-em)]](https://www.rsc.org/images/entities/char_2009.gif) 0.4 0.4 |
0.44![[thin space (1/6-em)]](https://www.rsc.org/images/entities/char_2009.gif) : :![[thin space (1/6-em)]](https://www.rsc.org/images/entities/char_2009.gif) 0.38 0.38 |
0.5![[thin space (1/6-em)]](https://www.rsc.org/images/entities/char_2009.gif) : :![[thin space (1/6-em)]](https://www.rsc.org/images/entities/char_2009.gif) 0.5 0.5 |
| Membrane thickness [μm] | 80 | 200 | Not specified | 15 |
| Gas pressure [atm] | 3 | 1.5 | 3 | 3 |
| Humidity | 50% | Not specified | 100% | 90% |
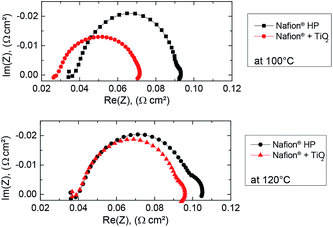
As revealed by electrochemical impedance spectroscopy measurements depicted in Fig. 5, we obtained a high frequency resistance (HFR) below 40 mΩ cm2 for the TiO2-reinforced DMD fuel cell and the Nafion® HP fuel cell at 120 °C. The diameter of the loop is a measure of the charge transfer resistance.26 The results showed that the TiO2-reinforced DMD fuel cell had a lower charge-transfer resistance compared to the Nafion® HP cell. Since identical catalyst layers were used, the improved charge transfer resistance indicated that the ionic connection between the catalyst layers and the membrane was improved. At 120 °C an emerging second loop could be observed in the low-frequency regime. This low-frequency arch is typically attributed to mass transport issues.26
Conclusion
A simple membrane production method for medium temperature TiO2 reinforced PEM fuel cells, based on the recently introduced concept of direct membrane deposition, is presented in this work. The membranes manufactured by the presented method enabled stable fuel cell operation with maximum power density of 2.90 W cm−2 at 100 °C and 2.02 W cm−2 at 120 °C (H2/O2; 0.5/0.5 L min−1; 90% RH, 300/300 kPaabs). This exceeds the maximum power density (2.28 W cm−2 at 100 °C and 1.85 W cm−2 at 120 °C) of a high performance state of the art Nafion® HP membrane in an identical measurement setup. It also proves the high potential of directly deposited membranes for fuel cell application in the temperature range between 100 °C and 120 °C. Furthermore, the maximum power density of the fuel cells assembled in this work reach 2.8 times the value of the best TiO2 reinforced membrane references found in the literature.By the introduction of TiO2 nanoparticles into the Nafion® membrane ionomer, fuel cell operation in the medium temperature range is significantly improved. The reinforcement leads to lower membrane resistances at 100 °C and 120 °C compared to a pure Nafion® directly deposited membrane. This behavior was related to improved humidification due to the hydrophilic character of the TiO2 nanoparticles and confirms the results of several research groups with conventionally casted composite membranes.23–25
The medium temperature range for fuel cell operation is of high interest for automotive and stationary applications. Therefore, direct membrane deposition might open the way for significantly reduced cost per watt ratio due to lower material consumption and higher cell power densities. Direct membrane deposition enables new possibilities in the design of high performance membranes: due to the easy manufacturing approach, various modifications of a single membrane layer can be realized. A next step could be the investigation of alternative hydrophilic additives such as SiO2 or zeolites.
Acknowledgements
This work was funded by the German Federal Ministry of Education BMBF within the project “Gecko” (03SF0454C). The authors would like to acknowledge Lukas Zielke for the illustrative artwork and Severin Vierrath, Kevin Holdcroft and Riko Moroni for valuable discussions. Furthermore the authors would like to thank Benjamin Britton (Simon Fraser University) for very fruitful comments and proof-reading of the manuscript.References
- V. P. McConnell, Fuel Cells Bull., 2009, 12, 12–16 Search PubMed.
- Q. Li, R. He, J. O. Jensen and N. J. Bjerrum, Chem. Mater., 2003, 15, 4896 CrossRef CAS.
- J. Zhang, Z. Xie, J. Zhang, Y. Tang, C. Song, T. Navessin, Z. Shi, D. Song, H. Wang, D. P. Wilkinson, Z.-S. Liu and S. Holdcroft, J. Power Sources, 2006, 160, 872 CrossRef CAS.
- J.-R. Kim, J. S. Yi and T.-W. Song, J. Power Sources, 2012, 220, 54 CrossRef CAS.
- C. H. Parka, C. H. Lee, M. D. Guivera and Y. M. Lee, Prog. Polym. Sci., 2011, 36, 1443 CrossRef.
- A. Chandan, M. Hattenberger, A. El-kharouf, S. Du, A. Dhir, V. Self, B. G. Pollet, A. Ingram and W. Bujalski, J. Power Sources, 2013, 231, 264 CrossRef CAS.
- S. Bose, T. Kuila, T. X. H. Nguyen, T. Xuan Hien, N. H. Kim, K.-T. Lau and J. H. Lee, Prog. Polym. Sci., 2011, 36, 813 CrossRef CAS.
- B. Smitha, S. Sridhar and A. A. Khan, J. Membr. Sci., 2005, 259, 10 CrossRef CAS.
- A. Stassi, I. Gatto, E. Passalacqua, V. Antonucci, A. S. Arico, L. Merlo, C. Oldani and E. Pagano, J. Power Sources, 2011, 196, 8925 CrossRef CAS.
- Z. Tu, H. Zhang, Z. Luo, J. Liu, Z. Wan and M. Pan, J. Power Sources, 2013, 222, 277 CrossRef CAS.
- P. Costamagna, C. Yang, A. B. Bocarsly and S. Srinivasan, Electrochim. Acta, 2002, 47, 1023 CrossRef CAS.
- T.-E. Kim, S. M. Juon, J. H. Park, Y.-G. Shul and K. Y. Cho, Int. J. Hydrogen Energy, 2014, 39, 16474 CrossRef CAS.
- H. Zarrin, D. Higgins, Y. Jun, Z. Chen and M. Fowler, J. Phys. Chem. C, 2011, 115, 20774 CAS.
- M. Amjadi, S. Rowshanzamir, S. J. Peighambardoust, M. G. Hosseini and M. H. Eikani, Int. J. Hydrogen Energy, 2010, 35, 9252 CrossRef CAS.
- E. I. Santiago, R. A. Isidoro, M. A. Dresch, B. R. Matos, M. Linardi and F. C. Fonseca, Electrochim. Acta, 2009, 54, 4111 CrossRef CAS.
- G. Alberti, M. Casciola, D. Capitani, A. Donnadio, R. Narducci, M. Pica and M. Sganappa, Electrochim. Acta, 2007, 52, 8125 CrossRef CAS.
- G. Alberti and M. Casciola, Annu. Rev. Mater. Res., 2003, 33, 129 CrossRef CAS.
- G. Alberti, M. Casciola, L. Massinelli and B. Bauer, J. Membr. Sci., 2001, 185, 73 CrossRef CAS.
- E. Chalkova, M. B. Pague, M. V. Fedkin, D. J. Wesolowski and S. N. Lvov, J. Electrochem. Soc., 2005, 152, A1035–A1040 CrossRef CAS.
- M. Klingele, M. Breitwieser, R. Zengerle and S. Thiele, J. Mater. Chem. A, 2015, 3, 11239 CAS.
- B. S. Pivovar and Y. S. Kim, J. Electrochem. Soc., 2007, 154, B739 CrossRef CAS.
- R. Jiang, C. K. Mittelsteadt and C. S. Gittleman, J. Electrochem. Soc., 2009, 156, B1440 CrossRef CAS.
- M. Amjadi, S. Rowshanzamir, S. J. Peighambardoust, M. G. Hosseini and M. H. Eikani, Int. J. Hydrogen Energy, 2010, 35, 9252 CrossRef CAS.
- E. Chalkova, M. V. Fedkin, D. J. Wesolowski and S. N. Lvov, J. Electrochem. Soc., 2005, 152(9), A1742–A1747 CrossRef CAS.
- E. I. Santiago, R. A. Isidoro, M. A. Dresch, B. R. Matos, M. Linardi and F. C. Fonseca, Electrochim. Acta, 2009, 54, 4111–4117 CrossRef CAS.
- X. Yuan, H. Wang, J. Colinsun and J. Zhang, Int. J. Hydrogen Energy, 2007, 32, 4365 CrossRef CAS.
Footnote |
| † Electronic supplementary information (ESI) available. See DOI: 10.1039/c5ra27462a |
| This journal is © The Royal Society of Chemistry 2016 |

