
Co-existence of amorphous and crystalline phases in Na-doped SrSiO3 system
Kapil Sood and
Suddhasatwa Basu*
Department of Chemical Engineering, Indian Institute of Technology Delhi, New Delhi 110016, India. E-mail: sbasu@iitd.ac.in; Tel: +91-11-2659-1035
First published on 12th February 2016
Abstract
The exceptionally high ionic conductivity of Na-doped SrSiO3 solid electrolytes has attracted widespread attention for their use in SOFCs. The structural features are investigated using techniques such as X-ray diffraction (XRD), SEM/EDS, HR-TEM, DSC/TGA and Raman spectroscopy. The amorphous phase co-formed with the crystalline phase has been visualized using HR-TEM and co-related well with the XRD results. The glass transition (762 °C), glass melting (815 °C) and enthalpy of fusion (12.5 J g−1) of the amorphous phase are reported for the first time using DSC analysis. The thermal stability of the synthesized samples has also been studied using TGA analysis. Na doping in this system leads to the formation of a Na-rich glassy phase, which segregates along the grain-boundaries and is responsible for high electrical conductivity. Among all synthesized samples, Sr0.6Na0.4SiO3−δ showed the highest conductivity of 22.8 mS cm−1 at 800 °C in air. Also, strontium silicate forms the monoclinic phase and behaves as an insulator in the measured temperature range (200–800 °C).
1. Introduction
The recent reports on the high oxygen-ion conductivity of doped SrSiO3 materials have attracted worldwide attention.1–8 Singh and Goodenough in 2012 (ref. 1) reported a new family (Sr1−xKxMO3, where M = Si/Ge) of superior oxide ion conductors, which exhibits competitive oxide-ion conductivity (σ ∼ 10−2 S cm−1 at 625 °C) in the intermediate temperature range (600–800 °C). According to them, Sr1−xKxMO3 systems are single phase in the interval 0.1 ≤ x ≤ 0.3 for M = Si and in 0 ≤ x ≤ 0.25 for M = Ge. The improved ionic conductivity is due to introduction of terminal oxygen vacancies on tetrahedral anion complexes. However, when Na is doped to Sr-site in SrSiO3, the conductivity was further improved.2 It was further reported that Sr0.55Na0.45SiO2.775 possessed ionic conductivity of ∼0.11 S cm−1 at 800 °C in air. The system is thermally stable and behaves as pure oxide-ion conductor in the operating temperature range for SOFC applications. Wei et al.3 claimed that Sr0.55Na0.45SiO2.775 exhibits the highest ionic conductivity with the lowest activation energy among all chemically stable solid oxide-ion conductors reported. They demonstrated the 294 μm thick symmetric cell based on Sr0.55Na0.45SiO2.775 electrolyte, which produced peak power density of 431 mW cm−2 at 600 °C. However, this claim was first contradicted by Bayliss et al.4,5 They found that the Na-doped SrSiO3 contains not only a crystalline phase but it demonstrate additional glassy phase. Furthermore, this material possessed much lower conductivity than reported by Goodenough group.2 They also mentioned total conductivity is not due to flow of oxygen-ions. But, they could not reveal the main cause of electrical conductivity in this system. Evans et al.6 further reported the chemical inhomogeneity in the Na-doped SrSiO3 system. They reported similar conclusions as claimed by Bayliss![[e with combining low line]](https://www.rsc.org/images/entities/i_char_0065_0332.gif)
![[t with combining low line]](https://www.rsc.org/images/entities/i_char_0074_0332.gif)
![[a with combining low line]](https://www.rsc.org/images/entities/i_char_0061_0332.gif)
![[l with combining low line]](https://www.rsc.org/images/entities/i_char_006c_0332.gif) .4,5 On the hand, Tealdi et al.7 reported that Na-is hardly substituted in the parent (SrSiO3) phase and the ionic conductivity is due to secondary phase formation (Na2Si2O5). However, they have not reported the glass transition, glass melting temperatures to justify their findings. Moreover, the cause of high conductivity was also not explained. Xu et al.8 claimed that doping of potassium in SrSiO3 leads to the formation of oxygen vacancies, which are responsible for high ionic conductivity of this system. Therefore, the phase study is still a controversial issue and needs further attention to verify phase, its stability with temperature and cause of high conductivity of this system.
.4,5 On the hand, Tealdi et al.7 reported that Na-is hardly substituted in the parent (SrSiO3) phase and the ionic conductivity is due to secondary phase formation (Na2Si2O5). However, they have not reported the glass transition, glass melting temperatures to justify their findings. Moreover, the cause of high conductivity was also not explained. Xu et al.8 claimed that doping of potassium in SrSiO3 leads to the formation of oxygen vacancies, which are responsible for high ionic conductivity of this system. Therefore, the phase study is still a controversial issue and needs further attention to verify phase, its stability with temperature and cause of high conductivity of this system.
In the light of these contradictory reports, it is worthwhile to investigate Na-doped SrSiO3 independently considering other techniques. In the present work, we have synthesized Na-doped SrSiO3 and characterized through XRD, Raman, HR-TEM, DSC/TGA and impedance measurements for detail investigation of the system. The Raman and DSC techniques have been used to justify the vitrification of the phases. With best of our knowledge, the glass transition, glass melting temperatures, enthalpy of fusion for the system has not been reported and we will present it for the first time using DSC/TG analysis. HRTEM has been used to visually verify the phase and is correlated with XRD data. The impedance spectroscopy results indicate the conductivity is mainly due to grain boundary contribution.
2. Experimental
Sr1−xNaxSrSiO3−δ (x = 0.0, 0.10, 0.20, 0.30, 0.40) were prepared by solid-state reaction method. Initially, the powders of SrCO3, SiO2, Na2CO3 (Sigma Aldrich, purity ≥99.9%) in stoichiometric amounts were ground in agate mortar pestle for 2 h. Except un-doped sample (SrSiO3), which was sintered at 1150 °C for 20 h, the procedure adopted for the synthesis of the samples was same as reported by Singh et al.2 These samples were named as SNS-0, SNS-10, SNS-20, SNS-30 and SNS-40 in terms of increasing concentration of Na. The phase study of the compounds were performed by X-ray diffraction (XRD) using Cu-Kα radiation (λ = 1.5406 Å, Rigaku, MiniFlex). The pattern was recorded at a scanning rate of 2° min−1. For further structural confirmation, Raman spectra was obtained using a Horiba, Lab RAM HR spectrometer coupled with Ar+ ion laser of wavelength 514.5 nm. The thermal behavior of the samples were analyzed by thermogravimetry (TG) and differential scanning calorimetry (DSC) using a Netzsch model STA 449 F3 Jupiter at a heating rate of 10° min−1 in air. The morphology and distribution of grains were determined by SEM and elemental mapping by energy dispersive X-ray spectroscopy (EDS) using model JEOL 6010 LA. The crystallinity of the material was investigated by high resolution transmission electron microscopy ((HR-TEM), FEI Technai G2 20 electron microscope). The AC conductivity measurements were performed in air by two-probe method using AUTOLAB (Model 302N) potentiostat in the frequency range from 1 MHz to 0.1 Hz with AC amplitude of 10 mV.3. Results and discussion
3.1 XRD analysis
XRD pattern of as-sintered SNS samples is shown in Fig. 1. The peaks are well matched with ICSD card number 01-087-0474 which confirms the polycrystalline phase formation in all samples. The absence of additional sharp peaks indicates that other crystalline phase is not present. In SNS-0, the flat tops are observed which corresponding to (110) (200) and (![[1 with combining macron]](https://www.rsc.org/images/entities/char_0031_0304.gif) 12) planes. The broad flat at 2θ ∼ 15° indicates that the SNS-0 sample contains voids or phase separated regions dispersed in an approximately homogenous medium.9,10 However, when doped with Na, the flat top becomes peaks in the XRD spectrum (Fig. 1). The relative peak intensity corresponding to these planes increases with Na-content and is largest for SNS-40 sample. In addition, with increasing Na-content, the peak splitting corresponding to higher 2θ (>45°) is also observed. As reported in literature,10 one of the cause of peak splitting is due to disorder exerted on parent SrSiO3 phase.
12) planes. The broad flat at 2θ ∼ 15° indicates that the SNS-0 sample contains voids or phase separated regions dispersed in an approximately homogenous medium.9,10 However, when doped with Na, the flat top becomes peaks in the XRD spectrum (Fig. 1). The relative peak intensity corresponding to these planes increases with Na-content and is largest for SNS-40 sample. In addition, with increasing Na-content, the peak splitting corresponding to higher 2θ (>45°) is also observed. As reported in literature,10 one of the cause of peak splitting is due to disorder exerted on parent SrSiO3 phase.
 | ||
| Fig. 1 XRD pattern for SNS-0 (SrSiO3), SNS-10 (Sr0.9Na0.1SiO3−δ), SNS-20 (Sr0.8Na0.2SiO3−δ), SNS-30 (Sr0.7Na0.3SiO3−δ) and SNS-40 (Sr0.6Na0.4SiO3−δ). | ||
The cause of disorder may be of stress, vacancy formation and/or aliovalent impurity substitution (Na-content). In SNS-0, the stress could be mainly caused by the confinement of neighboring SiO2 layers, whereas, in Na-doped systems, the growth of monoclinic phase is not only restricted by SiO2 layers but also could be due to amorphous SiO2 matrix around them (as discussed in Raman and SEM analysis later). So, the disorder in Na-doped samples should be higher than that of un-doped sample (SNS-0). The disorder in doped samples could be responsible for improved electrical properties as discussed in conductivity section.
3.2 Raman analysis
The short range order (SRO) in glassy phase is not detected by XRD. The Raman spectra compliment XRD due to its sensitivity towards glassy network. The glass network is based on the principles governing the structure of crystalline solid. In crystalline silicates, the Si is tetrahedrally coordinated by oxygen.11 It is generally assumed that in silicate glasses, the SiO4 tetrahedra are linked at the vertices to form the network while alkali (Na) occupies the interstitial sites in the network. The oxygen bonded to two silicon are called bridging oxygen and those bonded to single silicon are called non-bridging oxygen (NBOs). These features are generalization of the structure of crystalline SrSiO3 phase, which has alternate layers of ternary rings of SiO4 groups and Sr-atoms are close packed in [001] plane.12The sintering of SrSiO3 at 1150 °C crystallizes in space group C2/c with its associated factor 2/m. For this group, the total numbers of theoretical vibrational modes are:13
| Tvib = 44Ag + 44Bg + 46Au + 46Au. |
All g-modes are Raman active and all u-modes are IR active. It is expected that under un-polarized conditions used in our experiment, some of A and B modes overlap, resulting in lesser number of Raman bands. We have determined 17 bands in the un-doped (SrSiO3) sample at room temperature conditions. With Na-doping, slight modification in the Raman bands are expected, which are shown in Fig. 2a and b. The whole Raman spectra can be divided into three regions; low wavenumber (ν) range with ν < 500 cm−1, intermediate range with 500 ≤ ν ≤ 800 cm−1, and higher range 800 ≤ ν ≤ 1400 cm−1. In low ν region, vibrational modes are appeared, which are due to cation translations, lattice vibrations due to entire framework, ring rotations as well as deformation and δSi–O−.13 The bands at 290, 331, 490 cm−1 match with the bending vibrations peaks of Si–O–Si bonds of (SiO3)2− in SrSiO3 glass ceramics.14 However, in this region, except (SNS-40), least band dislodging takes place with Na-dopant. It supports that Na is least substituted at Sr-site in SrSiO3 system. However, SNS-40 shows an additional peak at 113 cm−1 may be due to partial Na-substitution at Sr-site for this system. In intermediate region (500 ≤ ν ≤ 800 cm−1), the band at 567 cm−1 is oxygen sensitive band.15 The splitting of this band for SNS-30 and SNS-40 (Fig. 2b), further indicates the increase in amorphous content in these compositions. In higher region (800 < ν ≤ 1400 cm−1), high intensity band 1122 cm−1 is attributed to the stretching vibration of SiO4.16,17 For SNS-0, the Raman peak at 550 cm−1 is assigned to the bending vibration of Si–O–Si bonds and peak at 974 cm−1 is due to symmetric stretching vibration of SiO4 tetrahedral with two non-bridging oxygen.14 The small intensity peaks at 285, 328, 466 and 495 cm−1 were matched with the bending vibration bands of Si–O–Si bonds of [SiO3]2− in MgSiO3.18,19 This indicates that the nano-crystals of SrSiO3 are formed in the present system. Similar observation of nano-crystallization were also indicated by Cui et al.14 This observation is further verified using HR-TEM analysis for the present system.
 | ||
| Fig. 2 (a) Raman spectra for SNS-0 (SrSiO3), SNS-10 (Sr0.9Na0.1SiO3−δ), SNS-20 (Sr0.8Na0.2SiO3−δ), SNS-30 (Sr0.7Na0.3SiO3−δ) and SNS-40 (Sr0.6Na0.4SiO3−δ) and (b) peak splitting and peak broadening of selective Raman bands. | ||
In addition, the higher Na-dopant does not indicate any major band formation or peak shift in the Raman spectra except peak splitting/broadening (Fig. 2b) and decrease in the band intensity. This indicates no soft mode behavior or any symmetry breaking transformation with Na-content in SrSiO3 system. However, the Raman spectra do reveal the vitrification of SNS system with increasing Na-content. There is an increase in disordering with increasing Na-content, which is marked by decrease in intensity of crystal bands and emergence of a glassy mode near 980 cm−1, which become clearly visible for SNS-30 and SNS-40. The presence of this mode is consistent with the formation of glassy phase for similar glassy system (MgSiO3).18,19 It is further interesting to note that the Raman bands are not shifted but slightly broadened by Na-content. Moreover, it is reported that the disorder acts as perturbation on the spectrum of an elementary vibrating unit from which the glass is largely constructed.11 Negligible shift of Raman bands indicates that lattice fringes of the polycrystalline system are not modified with Na-content. The possible explanation for these results is that the glassy phase melts at lower temperatures (as discussed in DSC results) than the crystalline phase (SrSiO3). So, during sintering process, the slow cooling rate (2 °C min−1) leads to uniform nucleation of glassy phase without perturbing the crystalline phase throughout the sample. Therefore, structural transformation is not created in the crystalline phase. Also, from the Raman data, the Na-rich glassy phase is structurally related to tetrahedral chain silicate glass. These investigations indicate that Na is hardly substituted within SrSiO3 system, which is also supported by XRD results (Fig. 1).
3.3 DSC and TG analysis
To further support the glassy-phase formation in SNS, DSC/TG analysis was used to measure the weight change and heat flow as temperature is increased (Fig. 3a and b). Only SNS-0 and SNS-40 were selected because they possess minimum and maximum Na-content, respectively in the present study. The sample “SNS-0” exhibits a total weight loss of 2.1% during the applied temperature program, which can be further separated into two individual weight loss steps of 0.4% and 1.7%. The temperature range of each individual weight loss step was determined according to the weight loss rate, which shows maxima in correspondence to the observed mass loss steps. The small weight loss (0.4%) between room temperature and 300 °C can be attributed to the vaporization of adsorbed water. The DSC curve also showed small endothermic peak in the same temperature range. The second weight loss (1.7%) indicated by TGA curve and endothermic peak by DSC curve, observed in the temperature range 300–750 °C may be related to the loss of lattice oxygen, i.e., the tendency towards a small oxygen non-stoichiometry at elevated temperatures. Similar findings has also been reported for doped-SrMnO3−δ system.19,20 | ||
| Fig. 3 DSC/TG plots for as-sintered (a) SNS-0 (SrSiO3) and (b) SNS-40 (Sr0.6Na0.4SiO3−δ) in air. | ||
For the sample SNS-40, a total weight loss of 6.5%, is the result of two combined weight loss steps of 3.5% and 3.0%. The corresponding rate of weight loss exhibits maxima at 98.1 °C, 113.4 °C and 688.3 °C. The weight loss from room temperature to 300 °C may be due to adsorbed water and two weight loss maxima (98.1 °C, 113.4 °C) in this range could be due to water loss from the two different phases present in the sample. The third weight loss at 688 °C is similar to the one appeared in SNS-0 sample. The higher weight loss (∼3%) indicates more loss of lattice oxygen and may be responsible for improved electrical conductivity for this system.
The DSC signal showed a variety of different signals which are mostly related to the observed weight loss steps (100.4 °C, 114.8 °C, 541.6 °C, 663.6 °C). However, two effects (762.4 °C and 814.6 °C) seems to be related to further intrinsic phase transitions, which are mostly based on a (partial) crystallization and a melting/softening of the sample. Furthermore, both these effects indicate a previous glassy transition of the sample in the temperature range of about 600–700 °C, which unfortunately can't be further assigned due to the overlaying weight loss step in this temperature range. With further increase in temperature (T > 850 °C), the slope of the DSC curve increases because the heat capacity of molten material increases with temperature. The heat of fusion calculated from DSC is 12.5 J g−1. Since the glass transition and glass melting features are absent in SNS-0, which confirms that Na-rich phase leads to a glassy phase formation in Na-doped SrSiO3.
3.4 SEM/EDS/HR-TEM analysis
The morphology of the fractured surfaces of selected samples (SNS-0 and SNS-40) are shown in Fig. 4a and b. The un-doped sample (SNS-0) shows non-uniform grains distribution separated by well-defined grain-boundaries (Fig. 4a). The grains of size ∼3 μm are well connected with each other (marked as A in Fig. 4a). Also, some porosity is also observed. Some of these grains seems to be agglomerated to form bigger size (marked as B), which may be due to the long sintering time (20 h) during synthesis process. The non-uniform grain size leads to higher grain boundaries, which may cause higher resistance in this sample. Na-doping causes the drastic changes in the microstructure and two different regions (marked as C and D) can be clearly seen (Fig. 4b). SNS-40 form larger grains with average grain size ∼6 μm. In addition, a liquid phase sintering (marked as D) is also observed. These features clearly indicate the formation of two different compositions in this system. Furthermore, the EDS analysis (Fig. 4c–f) again supports that the grains are Na-deficient and the liquid sintered phase is Na-rich in composition (Table 1).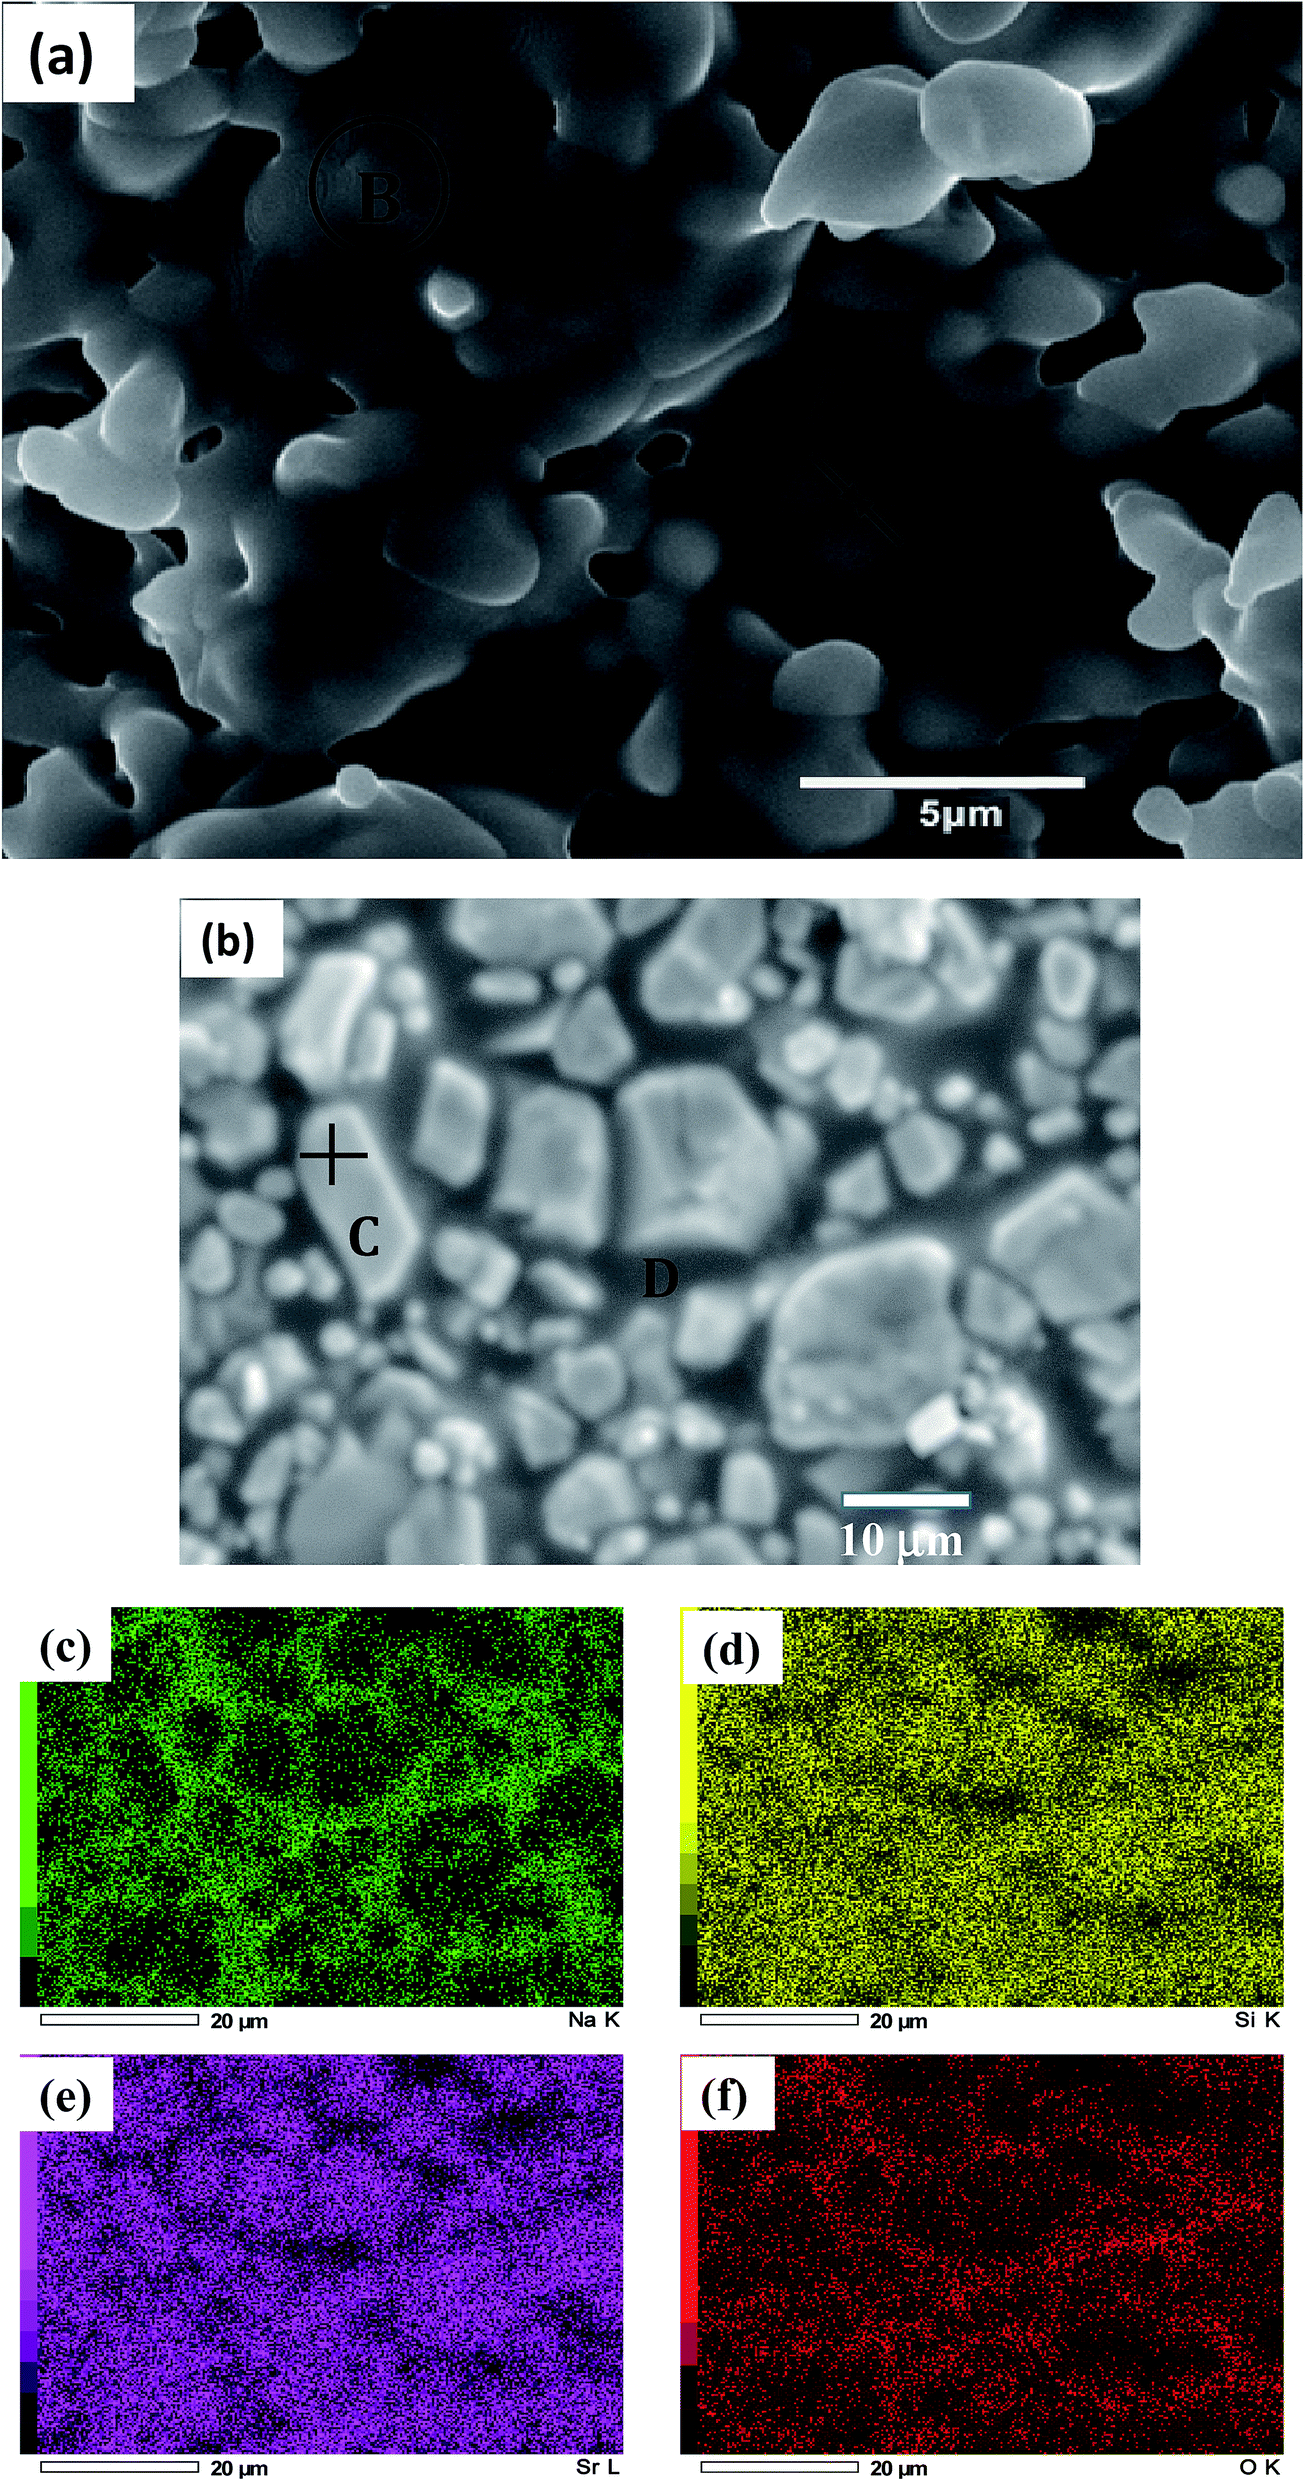 | ||
| Fig. 4 The SEM micrographs for (a) SNS-0 (SrSiO3), (b) SNS-40 (Sr0.6Na0.4SiO3−δ), mapping of SNS-40 sample (c) Na, (d) Si, (e) Sr and (f) O. | ||
| Element | Mass% | Atom% |
|---|---|---|
| O | 32.10 | 60.50 |
| Na | 2.01 | 2.80 |
| Si | 15.01 | 17.66 |
| Sr | 50.88 | 19.04 |
| Total | 100 | 100 |
Fig. 5(a–d) shows HR-TEM images of SNS-0 and SNS-40 systems with different magnifications. Fig. 5a shows the morphology of the as-sintered SNS-0 nanoparticles containing mainly rod-like particles. The distribution of lattice fringes indicted by white ovals (Fig. 5b) confirms the crystallinity of SNS-0 system. The interlayer distance between parallel fringes is equal to 2.82 Å, which corresponds to (![[2 with combining macron]](https://www.rsc.org/images/entities/char_0032_0304.gif) 22) plane. These findings also co-relate our XRD result (Fig. 1). For SNS-40, the monoclinic strontium silicate surrounded by amorphous phase are also observed (Fig. 5c and d). This kind of crystalline–amorphous phase formation is similar to the long-range and short-range order reported earlier.21,22 These structural features allow us to presume that the mixed structure is formed by the primarily solidification of the crystalline phase, followed by the solidification of the remaining liquid as amorphous phase. It further supports the composite phase formation in SNS-40.
22) plane. These findings also co-relate our XRD result (Fig. 1). For SNS-40, the monoclinic strontium silicate surrounded by amorphous phase are also observed (Fig. 5c and d). This kind of crystalline–amorphous phase formation is similar to the long-range and short-range order reported earlier.21,22 These structural features allow us to presume that the mixed structure is formed by the primarily solidification of the crystalline phase, followed by the solidification of the remaining liquid as amorphous phase. It further supports the composite phase formation in SNS-40.
 | ||
| Fig. 5 HR-TEM images for as-sintered (a and b) SNS-0 (SrSiO3) crystalline nanoparticles and (c and d) amorphous phase co-formed with crystalline in SNS-40 (Sr0.6Na0.4SiO3−δ). | ||
3.5 Electrical conductivity analysis
The impedance spectra of a common type of electroceramic material shows two well defined semicircular arcs in the narrow temperature regions.23,24 The semicircle at high frequency region indicates bulk response and the semicircle at intermediate range belongs to grain-boundary response. The spike at low frequency region indicates the metal-electrode response. In the present study, the AC conductivity of the SNS-0 and SNS-40 were measured from 200 to 800 °C in the frequency range of 1 MHz to 0.1 Hz. For SNS-0, no semicircular curve was obtained and all data points at different frequencies give impedance values at nearly same region. The calculated conductivity of SNS-0 at 300 °C and 600 °C are 1.3 × 10⁻⁸ and 2.5 × 10⁻⁸ S cm−1, respectively. It indicates that that the SNS-0 behaves as insulating material in the measured temperature range. Fig. 6a and b shows the Nyquist plots of the SNS-40 sample at 300 and 600 °C. These plots shows a complete semicircular arc and an inclined spike at low frequency region representing charge build-up at the blocking metal-electrodes. The characteristic relaxation time corresponding to the semicircle can be calculated using equation:23| ωmaxRC = 1 |
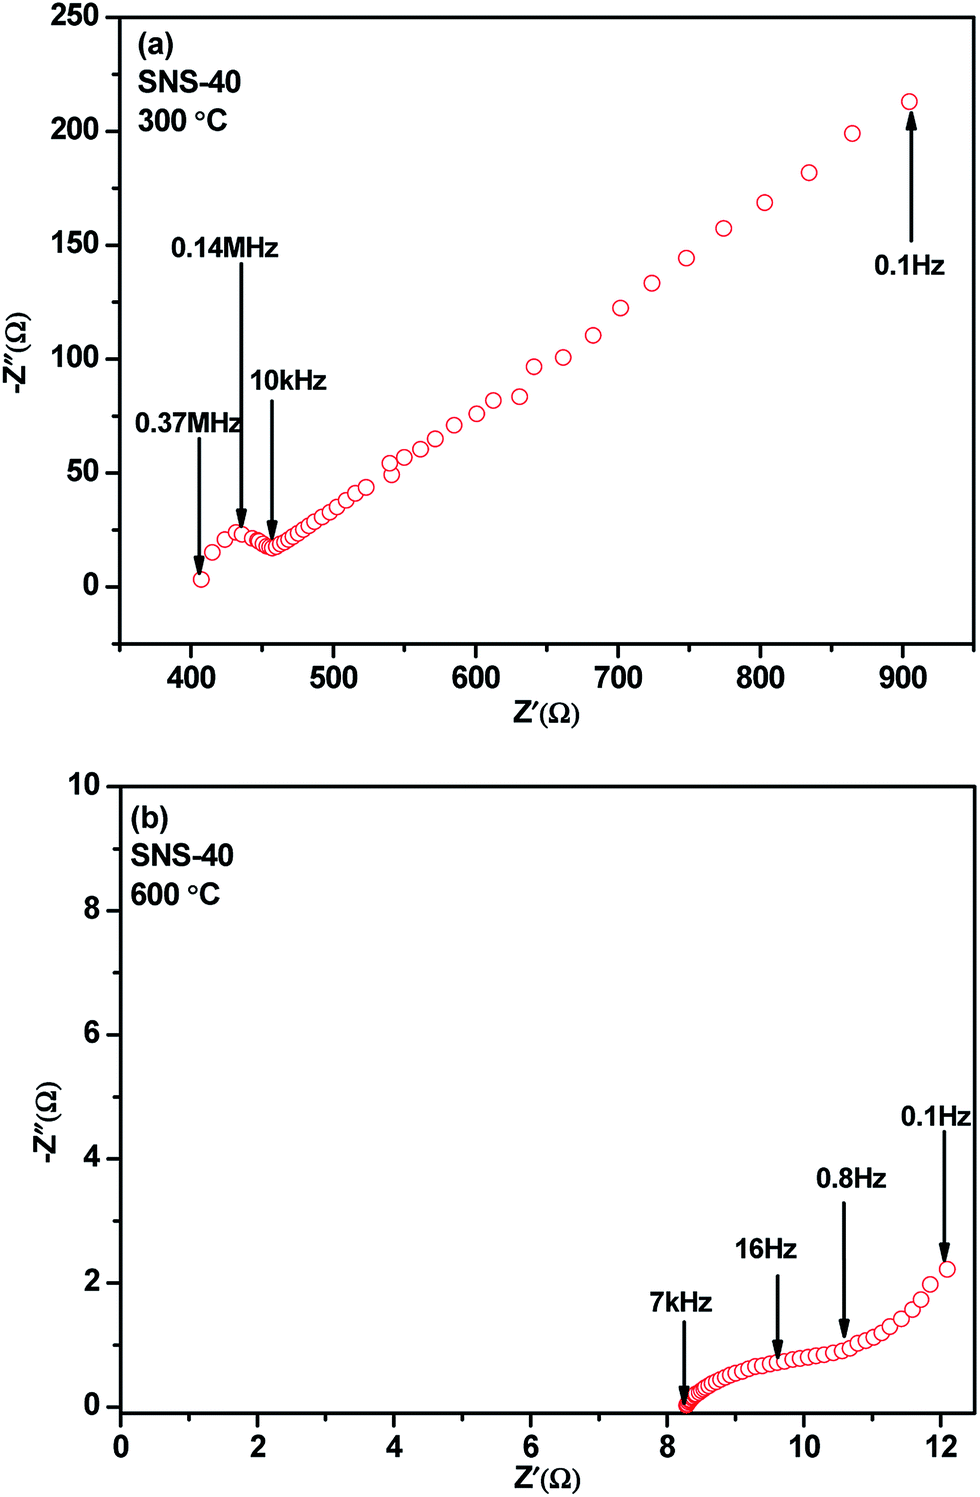 | ||
| Fig. 6 Impedance spectra of SNS-40 (Sr0.6Na0.4SiO3−δ) samples at (a) 300 °C and (b) 600 °C. | ||
At 300 °C, the capacitance value for SNS-40 comes out to be 3.6 × 10⁻¹⁰ F cm−1, which indicated that the semicircle is mainly due to inter-grain contribution.23
It is interesting to note that bulk response is not observed in the investigated temperature range. It indicates that the conductivity in the present system may be due to grain boundary regions and not due to bulk (intra-grain) region. It can be further supported by SEM/EDS study, which confirmed the fact that the grains are mainly Na-deficient regions, which belongs to parent insulating phase (SrSiO3). In addition, the grains boundaries are composed of mainly Na-rich regions, which could be mostly responsible for high conductivity of the system. Similar results for high electrical conductivity through grain boundaries in composite system has been recently reported by Lin et al.25 The Arrhenius plots for SNS-40 is shown in Fig. 7. The high and low temperature regions have different activation energies and the change in slope lies in the region 500–600 °C. This change may be due to either change in conduction behavior and/or some phase transition in this temperature region. However, our DSC results does not indicate any phase transition in this temperature region, which implies that the change in slope might be due to structural relaxation. Also, with the increase in temperature, the activation energy also decreases. Similar change in activation energy behavior is reported in literature.4,24 The electrical conductivity and its comparison with other electrolytes at selected temperature are given in Table 2.
 | ||
| Fig. 7 Arrhenius plot of SNS-40 (Sr0.6Na0.4SiO3−δ) sample. | ||
| Sample | Conductivity at 500 °C | Conductivity at 700 °C | Activation energy (eV) (600–800 °C) |
|---|---|---|---|
| SrSiO3 | 4.6 × 10⁻⁸ | 1.5 × 10⁻³ | 0.35 |
| Sr0.6Na0.4SiO3−δ | 2.7 × 10⁻³ | 1.4 × 10⁻² | 0.16 |
| Sr0.6Na0.4SiO3−δ2 | 1.7 × 10⁻² (at 550 °C) | 6.3 × 10⁻² | 0.49 |
| La0.9Ba0.1InO3−δ26 | 2.0 × 10⁻⁴ | 3.0 × 10⁻³ | 0.88 (from 500–700 °C) |
| La0.9Ca0.1InO3−δ27 | 8.4 × 10⁻⁵ | 1.6 × 10⁻³ | 0.81 (from 500–700 °C) |
| La0.9Sr0.1Ga0.83Mg0.17O3−δ28 | — | 8.0 × 10⁻² | 0.82 |
| Ce0.85Gd0.15O2−δ29 | — | 4.0 × 10⁻² | 0.62 (from 550–700 °C) |
The observed conductivity is nearly one order less than reported by Singh and Goodenough.2 The present data is comparable with the findings reported by Bayliss et al.5 It can be concluded that the conductivity in the present system is not due to doped-parent SrSiO3 phase, but due to the amorphous Na-rich phase, which segregates along grain-boundaries of the parent phase. Moreover, the inclined spike (Fig. 6) indicates that the conductivity in Na-doped system is mainly due to flow of ions not electrons. However, the nature of charge carriers is still to be investigated in future.
4. Conclusions
In this work, we have synthesized the Na-doped SrSiO3 material under similar conditions as reported by Singh and Goodenough. The Raman, DSC, SEM and HR-TEM clearly indicates that a Na-rich amorphous phase is co-formed with the parent SrSiO3 phase. The amorphous phase shows the glass transition and glass melting temperatures at 762 and 815 °C, respectively. The amorphous phase segregates along grain-boundaries and the electrical conductivity in the present system is due to the flow of charge carriers along grain boundaries. Moreover, the parent phase (SrSiO3) is electrically insulator within the measured temperature range.Acknowledgements
Authors are thankful to Mr G. Padmanabhan, General Manager, Netzsch A&T, India and M. Schoneich, NETZSCH-Gerätebau GmbH, Germany for providing DSC/TGA measurement facility in their lab.References
- P. Singh and J. B. Goodenough, Energy Environ. Sci., 2012, 5, 9626–9631 CAS.
- P. Singh and J. B. Goodenough, J. Am. Chem. Soc., 2013, 135, 10149–10154 CrossRef CAS PubMed.
- T. Wei, P. Singh, Y. Gong, J. B. Goodenough, Y. Huang and K. Huang, Energy Environ. Sci., 2014, 7, 1680 CAS.
- R. D. Bayliss, S. N. Cook, S. Fearn, J. A. Kilner, C. Greaves and S. J. Skinner, Energy Environ. Sci., 2014, 7, 2999–3005 CAS.
- R. D. Bayliss, S. N. Cook, D. O. Scanlon, S. Fearn, J. Cabana, C. Greaves, J. A. Kilner and S. J. Skinner, J. Mater. Chem. A, 2014, 2, 17919–17924 CAS.
- I. R. Evans, J. S. O. Evans, H. G. Davies, A. R. Haworth and M. L. Tate, Chem. Mater., 2014, 26, 5187–5189 CrossRef CAS.
- C. Tealdi, L. Malavasi, I. Uda, C. Ferrara, V. Berbenni and P. Mustarelli, Chem. Commun., 2014, 50, 14732–14735 RSC.
- J. Xu, X. Wang, H. Fu, C. M. Brown, X. Jing, F. Liao, F. Lu, X. Li, X. Kuang and M. Wu, Inorg. Chem., 2014, 53, 6962–6968 CrossRef CAS PubMed.
- P. D. Antonio and J. H. Konnert, Phys. Rev. Lett., 1979, 43, 1161–1163 CrossRef.
- J. Li, X. L. Wu, D. S. Hu, Y. M. Yang, T. Qiu and J. C. Shen, Solid State Commun., 2004, 131, 21–25 CrossRef CAS.
- S. A. Brawer and W. B. White, J. Chem. Phys., 1975, 63, 2421–2432 CrossRef CAS.
- F. Nishi, Acta Crystallogr., Sect. C: Cryst. Struct. Commun., 1997, 53, 534–536 Search PubMed.
- V. Kahlenberg, J. Konzett and R. Kaindl, J. Solid State Chem., 2007, 180, 1934–1942 CrossRef CAS.
- Z. Cui, R. Ye, D. Deng, Y. Hua, S. Zhao, G. Jia, C. Li and S. Xu, J. Alloys Compd., 2011, 509, 3553–3558 CrossRef CAS.
- T. Ohta, H. Yoshimura, S. Yoshioka, S. Aono and T. Kitagawa, J. Am. Chem. Soc., 2004, 126, 15000–15001 CrossRef CAS PubMed.
- N. Iwamoto, N. Umesaki and K. Dohi, Trans. JWRI, 1982, 11, 55–59 CAS.
- R. L. Frost, M. L. Weier and S. J. Mills, Spectrochim. Acta, Part A, 2006, 7, 1046–1072 Search PubMed.
- D. J. Durben and G. H. Wolf, Am. Mineral., 1992, 77, 890–893 Search PubMed.
- J. D. Kubicki, R. J. Hemley and A. M. Hofmeister, Am. Mineral., 77, 258–269 CAS.
- G. C. Kostogloudis and C. Ftikos, J. Eur. Ceram. Soc., 2007, 27, 273–277 CrossRef CAS.
- J. Richter, P. Holtappels, T. Graule and L. J. Gauckler, Solid State Ionics, 2008, 179, 2284–2289 CrossRef CAS.
- A. Inoue, Prog. Mater. Sci., 1998, 43, 365–520 CrossRef CAS.
- B. J. T. S. Irvine, D. C. Sinclair and A. R. West, Adv. Mater., 1990, 2, 132–138 CrossRef.
- K. Sood, K. Singh and O. P. Pandey, J. Renewable Sustainable Energy, 2014, 6, 063112 CrossRef.
- Y. Lin, S. Fang, D. Su, K. S. Brinkman and F. Chen, Nat. Commun., 2015, 6, 6824 CrossRef CAS PubMed.
- K. Sood, K. Singh and O. P. Pandey, Phys. B, 2015, 456, 250–257 CrossRef CAS.
- K. Sood, K. Singh, S. Basu and O. P. Pandey, Ionics, 2015, 21, 2839–2850 CrossRef CAS.
- K. Huang and J. B. Goodenough, J. Alloys Compd., 2000, 303–304, 454–464 CrossRef CAS.
- T. S. Zhang, J. Ma, H. Cheng and S. H. Chan, Mater. Res. Bull., 2006, 41, 563–568 CrossRef CAS.
| This journal is © The Royal Society of Chemistry 2016 |