 Open Access Article
Creative Commons Attribution 3.0 Unported Licence
A facile one pot synthetic approach for C3N4–ZnS composite interfaces as heterojunctions for sunlight-induced multifunctional photocatalytic applications†
P.
Suyana
ab,
Sneha
K. R.
a,
Balagopal N.
Nair
cd,
Venugopal
Karunakaran
be,
A. Peer
Mohamed
a,
K. G. K.
Warrier
a and
U. S.
Hareesh
 *ab
*ab
aMaterial Science and Technology Division, National Institute for Interdisciplinary Science and Technology (CSIR-NIIST), Thiruvananthapuram-695019, India. E-mail: hareesh@niist.res.in; Fax: +91 471 2491712; Tel: +91 471 2535504
bAcademy of Scientific and Innovative Research (AcSIR), New Delhi, India
cR&D Center, Noritake Co. Limited, Aichi 470-0293, Japan
dNanochemistry Research Institute, Department of Chemistry, Curtin University, GPO Box UI987, Perth, WA6845, Australia
eChemical Science and Technology Division, National Institute for Interdisciplinary Science and Technology (CSIR-NIIST), Thiruvananthapuram-695019, India
First published on 1st February 2016
Abstract
Herein, we report a facile one pot synthetic protocol for the creation of C3N4–ZnS composite interfaces by the co-pyrolysis of a precursor mix containing zinc nitrate, melamine, and thiourea at 550 °C in air. The organic–inorganic semiconductor heterojunctions thus formed displayed increased absorbance in the longer wavelength region and facilitated broad absorption of visible light compared to pure ZnS, C3N4 and conventionally synthesized hybrid samples. The decreased emission intensity, increased photocurrent generation and decreased fluorescence lifetime revealed reduced exciton recombinations in the co-pyrolysed sample containing C3N4–ZnS heterostructures. The samples displayed sunlight driven photocatalytic reduction of nitrophenol as well as hydrogen generation (4 mmol g−1 h−1) by water splitting.
1. Introduction
The design, synthesis, and utilization of semiconductor nanoparticles for various photocatalytic applications has been an intense field of research for the last few years.1–5 Visible light induced hydrogen production by new generation photocatalysts like C3N4 and MoS2 is actively pursued worldwide with the objective of developing alternate sources of sustainable energy.6 Graphitic carbon nitride (g-C3N4), an organic semiconductor having relatively high thermal and chemical stability, has generated widespread interest as a photoresponsive material for visible light induced photocatalytic hydrogen generation as well as dye degradation.7–10 The material, with a band gap of 2.7 eV, possesses the appropriate electronic band structure to qualify as a photocatalyst for water splitting reactions.11,12 It is easily synthesized by the polycondensation of organic precursors like cyanamide, dicyandiamide, and melamine. However, because of the planar cohesion of adjoining sheets through π–π aromatic stacking, it is often difficult to exfoliate bulk C3N4 into sheets of a few nm thicknesses (2–5 nm). Consequently the ‘as synthesized’ material possesses low surface area values of 5–20 m2 g−1 and a host of strategies are now being explored to increase the surface area of bulk C3N4. Another impediment to the effective use of C3N4 as a photocatalyst is the deleterious effect of exciton recombinations leading to reduction in photocatalytic and quantum efficiencies.13,14In C3N4, the highest occupied molecular orbital (HOMO) is more negative (−1.12 eV) than the conduction band of most inorganic semiconductors like TiO2, ZnO, ZnS etc. This favourable band structure facilitated the formation of semiconductor heterostructures with light absorption properties extended more to the visible region.1,15,16 The composite photocatalysts thus obtained displayed enhanced photocatalytic activity for both hydrogen generation and destruction of organic compounds. Diverse synthetic approaches are made in the synthesis of such C3N4 based composites and most of the reports referred to as ‘in situ’ utilized a two step methodology of first preparing the C3N4 followed by incorporating the second compatible semiconductor in a subsequent step.17–22 To the best of our knowledge there are only four reports on the g-C3N4–ZnS system synthesized using the two step methodology.23–26 For example, ZnS microsphere–g-C3N4 composites synthesized by a two step process involving the synthesis of g-C3N4 followed by the attachment of ZnS microspheres by precipitation from its precursors, generated 194 μmol h−1 g−1 of H2 under visible light radiation (four low power UV-LEDs 3 W, 420 nm, 50 mg of photocatalyst).23 Hydrothermally derived ZnS–g-C3N4 nanohybrids displayed higher photoluminescence quantum yields rendering them as promising candidates for fluorescence detection.24 g-C3N4 loaded with up to 2.89 wt% MoS2 generated H2 at the rate of 252 μmol g−1 h−1 (300 W Xe lamp with a UV cut off filter and 10 mg of photocatalyst) and no appreciable degradation was noticed in 18 h.27 The photocatalytic H2-production rate of 451 μmol h−1 g−1 reported for graphene/C3N4 composites (A 350 W Xe arc lamp through a UV-cut off filter and 80 mg photocatalyst) was three times more than that of pure g-C3N4 tested under identical conditions.28 Very recently, co-pyrolysis of cerium iodate and melamine was reported to synthesise CeO2/g-C3N4 composite photocatalyst of the n–n heterojunction type.20 The formation of cerium iodate, however, involved a tedious hydrothermal synthesis at 180 °C for 24 h. The two step processing methodologies often resulted in the inhomogeneous distribution of the second phases and formation of heterostructures in such cases was negligible. The preparative process was time consuming and broad spectrum absorbance was also absent in such nanocomposites. We have therefore explored the possibility of creating in situ dispersions of ultrafine ZnS second phases in the C3N4 sheets through the simultaneous decomposition of the constituent precursors in a one pot synthetic approach for the first time. The manuscript thus details the formation of g-C3N4–ZnS composite interfaces as heterojunctions and its application for enhanced photocatalytic hydrogen generation and organic degradation. The incorporation of ultra fine ZnS nanoparticles along the g-C3N4 sheets is demonstrated to be effective in reducing recombination rates and improving the separation efficiencies of charge carriers resulting in significant enhancement in photocatalytic properties.
2. Experimental section
2.1 Synthesis of C3N4–ZnS heterostructures
The C3N4–ZnS heterostructures were prepared by a one pot single step in situ method employing the precursors of melamine, thiourea and zinc nitrate. In a typical synthesis, calculated amounts of melamine, thiourea and zinc nitrate were mixed thoroughly in a pestle and mortar and transferred to an alumina crucible. The alumina crucible, partly closed, was treated in a furnace at 550 °C for 2 h in air at a ramp rate of 2.5 °C min−1. Different compositions were prepared by varying the amounts of precursors. The samples were designated as CZx where x = 5, 11, 14, 20, 67, and 72 represented the weight fraction of ZnS in the composites. Bulk C3N4 was prepared by the polymerization of melamine at 550 °C under air atmosphere for 2 h. The obtained samples were used as such for the characterization and application studies. For comparison, mechanical mixture of C3N4–ZnS represented as CZM and a composition representing conventional in situ method represented as (CZC) were also prepared. CZM was prepared by precipitating ZnS on C3N4 sheets under constant stirring. In the conventional in situ process, C3N4 obtained by the pyrolysis of melamine, was mixed with zinc nitrate and thiourea and heated at 250 °C.2.2 Characterization
Thermal stability and exact compositions of the photocatalysts were investigated by thermo gravimetric analysis (Perkin Elmer STA 6000, USA) in the temperature range of 50–800 °C at a heating rate of 5 °C min−1 in the air atmosphere. Crystal structure and phase analysis of the prepared samples were obtained by X-ray diffraction (XRD) using a Philips X'pert Pro diffractometer in the 2θ range 5–70° using Cu Kα radiation. Morphological and microstructural analyses of the prepared materials were done by high resolution transmission electron microscope (HRTEM, Tecnai G2, FEI, The Netherlands) at an accelerating voltage of 300 kV. The elemental composition of the samples was studied using energy dispersive spectroscopy (EDS) set up attached to the transmission electron microscope. The BET surface area measurements were done by nitrogen adsorption (Micromeritics Gemini 2375 surface area analyzer) after degassing each sample at 200 °C for 2 h. The UV-visible spectra of the prepared samples were recorded by a Shimadzu UV 2401 PC spectrophotometer in the range of 200–800 nm. The emission spectra of the prepared samples were obtained from a spectrofluorometer (Cary Eclipse, Varian, The Netherlands). Functional group identification of the prepared materials was investigated by Fourier transform infrared (FT-IR) spectra using a Bruker FT-IR spectrometer. The methylene blue (MB) degradation was monitored by a UV-visible spectrometer (UV-2401PC, Shimadzu, Japan) at different time intervals. X-ray photoelectron spectroscopy (XPS) was done on a VG Microtech Multilab ESCA 3000 spectrometer that was equipped with a Mg Kα X-ray source (hν = 1253.6 eV). The fluorescence lifetime experiments were performed by using an IBH picosecond single photon counting system employing the 375 nm nano LED as excitation sources and a Hamamatsu C4878-02 microchannel plate (MCP) detector. Decay in the fluorescence intensity (I) with time (t) was fitted by a triple-exponential function:| I = A1e−t/τ1 + A2e−t/τ2 + A3e−t/τ3 | (1) |
| 〈τ〉 = ∑τiAi | (2) |
The quality of the fits was checked by examining the residual distribution and the χ2 value. All the experiments were conducted at room temperature. Photocurrent measurements were performed on a homemade electrochemical set up using conventional three electrode system. Pt wire served as a counter electrode, standard calomel as a reference electrode and FTO coated with photocatalyst was used as the working electrode. 0.1 M Na2SO4 was employed as the electrolyte. The working electrode was prepared by doctor blade method as follows: 50 mg catalyst, 30 mg ethyl cellulose and 200 mg terpenol were ground well to obtain a slurry which was applied on a cleaned FTO substrate by the doctor blade method. The photocatalyst coating thus obtained was dried at 60 °C and annealed at 350 °C for 2 h.
2.3 Photocatalytic activity
3. Results and discussion
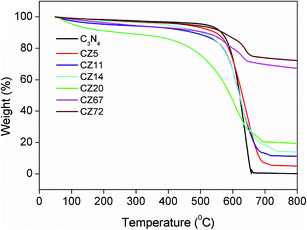
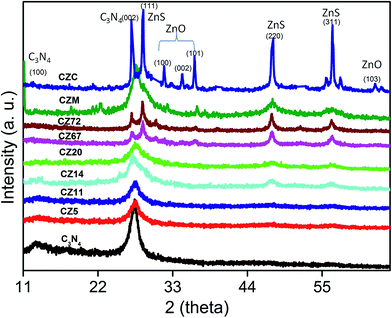
The content and thermal stability of g-C3N4 in the final compositions were evaluated by a post synthesis thermo gravimetric analysis (TGA) in the temperature range of 50 to 800 °C under air atmosphere. Fig. 1, providing a comparison of the decomposition profiles, indicated a gradual decrease in total weight loss depending on the amount of ZnS in the final compositions. The pure C3N4 sample synthesized at 550 °C decomposed completely on heating up to 650 °C. The weight loss was initiated at temperatures around 550 °C and was indicative of the stability of C3N4 in air. Based on this thermo gravimetric data, the composite preparation temperature was thus optimised at 550 °C and the residual weight after 650 °C provided the content of ZnS in the composites due to complete burn out of C3N4 in air. From the TGA patterns the final compositions contained 5, 11, 14, 20, 67 and 72 wt% of ZnS. Correspondingly, the samples were designated as CZx where x = 5, 11, 14, 20, 67, and 72 represented the weight fraction of ZnS in the composites.The crystal structure and phase purity of the prepared samples were evaluated by XRD. Fig. 2 representing pure C3N4 sample indicated broad peak at 13.1° and 27.4° indexed for (100) and (002) planes (JCPDS 87-1526).29–31 The weak peak at 13.1° corresponded to the in-plane structural packing motif of tris-triazine units with a d-spacing of 0.676 nm and the high intensity peak at 27.4 was related to the stacking of aromatic segments at an interlayer distance of 0.326 nm. For the nanocomposite samples CZ5 and CZ11, the peaks corresponding to ZnS were not observed. As the concentration was increased to 14 weight% and above, characteristic peaks of cubic sphalerite ZnS at 2θ values of 28.5, 47.5 and 56.7° corresponding to (111), (220) and (311) planes (JCPDS 65-1691) respectively were identified.24 Though the samples exhibited diffraction peaks corresponding to both g-C3N4 and ZnS, the characteristic peak of g-C3N4 (27.4°) and ZnS (28.5°) overlapped each other and appeared as a single peak. Moreover, the C3N4 rich compositions (CZ14 and CZ20) were relatively free of any impurity phases. The merged 100 intensity peaks of C3N4 and ZnS observed in the C3N4 rich compositions were resolved into two distinct and sharp peaks in the ZnS rich compositions CZ67 and CZ72. Additionally certain impurity peaks due to traces of ZnO formed by the oxidation of ZnS in a nitrate rich environment was observed at 2θ values of 31.7, 34.4, and 36.30. ZnS is prone to oxidation in air atmosphere at temperatures greater than 250 °C. However, the one pot synthetic approach involving the simultaneous formation of C3N4 and ZnS yielded ZnS phases with no oxide impurity for the C3N4 rich compositions (upto 20 weight% ZnS) even at the synthesis temperature of 550 °C in air. In the presence of a mixture of precursors, an ammonia rich atmosphere during the polymerization process facilitates ZnS formation without any oxide phases. The XRD patterns of nanocomposites were also compared with that obtained by the conventional in situ process (CZC) and with the mechanical mixture (CZM) of C3N4 and ZnS. The pattern of CZM resembled the nanocomposites except for the traces of impurities presumably from the milling process. The CZC sample represented a crystalline material with sharp well defined peaks of constituent raw materials of C3N4 and ZnS. Although the CZC composition matched with that of the CZ20 sample, the conventional in situ process yielded ZnO also as impurity phases even at a temperature as low as 250 °C. Moreover the use of mixture of precursors (melamine and thiourea) for the synthesis of C3N4 rich CZ phases (CZ14 and CZ20) presumably reduced the chances of surface oxidation of nanosized ZnS. Thus, the XRD analysis categorically supported the present synthetic protocol of simultaneous decomposition for obtaining phase pure C3N4–ZnS mixtures in air atmosphere.
The absorption spectra of C3N4–ZnS compositions were measured by diffuse reflectance method and are shown in Fig. 3. The spectra of pure C3N4 showed shoulder around 455 nm and the corresponding band gap was 2.72 eV. The spectra of the compositions with varying ZnS content showed that the compositions with lower amounts of ZnS (CZ11, CZ14, and CZ20) have absorbance extended more towards the visible region than that compared to pure C3N4. ZnS is not a visible active semiconductor and therefore the extended absorption is presumably due to the synergistic effect between g-C3N4 and ZnS leading to chemically bonded interfaces as has been reported earlier for systems like C3N4–ZnO.32,33 Absorption of CZ11 and CZ20 showed same absorption wavelength and appeared as overlapped though the absorbance value is maximum for CZ20. The bandgaps of CZ14 and CZ20 were calculated as 2.60 and 2.65 eV respectively and thus favoured solar light utilization. Likewise, the absorption wavelength of CZ5 and pure C3N4 were same. The ZnS rich compositions (CZ67 and CZ72), showed only a slight extension in absorption wavelength. The samples prepared by conventional in situ process and mechanical mixing showed absorption in the lower wavelength region compared to pure C3N4. These observations clearly indicated that the heterostructure formation occurred effectively only for the compositions containing smaller amounts of nanosized ZnS incorporated in situ by the one pot thermal decomposition process. The longer wavelength absorption in C3N4–ZnS heterojunctions could be due to the stronger bonding and synergistic effects between C3N4 and ZnS. C3N4 rich compositions (CZ14 and CZ20) and ZnS rich compositions (CZ67 and CZ72) were selected as representative candidates for further studies.
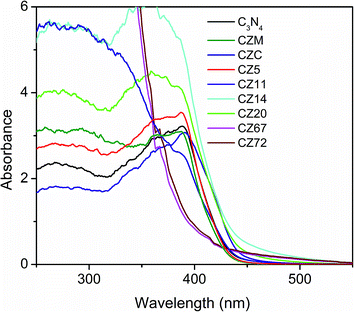 | ||
| Fig. 3 UV-vis absorption spectra of pure C3N4, CZ compositions with varying amounts of ZnS, CZM and CZC obtained by diffuse reflectance method. | ||
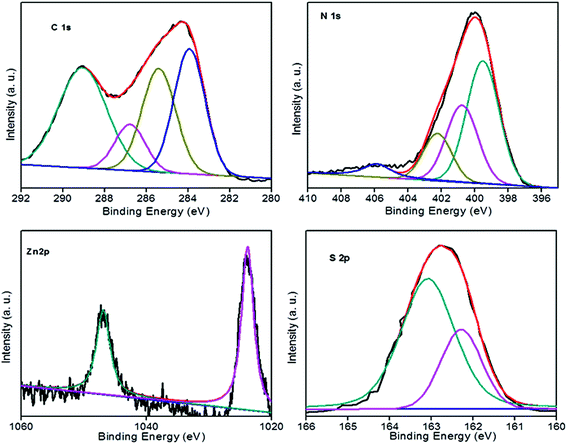
To confirm the surface chemical compositions of the prepared heterostructures, X-ray photoelectron spectra (XPS) were recorded. The C 1s spectrum was de-convoluted into five peaks located around 290.4, 288.5, 286.2, 285.3, and 284.6 eV. A less intense peak at 290.4 revealed the presence of sp2 C–N, i.e. s-triazine-pyridine-like structure.34 The peak at 288.5 indicated the sp2 hybridized carbon bonded to N in C–N–C network35–37 and the peak at 286.2 was attributed to C–NH2 species.38 The two peaks at 285.3 and 284.6 eV were assigned to reference carbon i.e. graphitic carbon adsorbed to the surface of sheets39 and pure graphitic sites in graphitic carbon respectively.40,41 The peak at 284.6 eV could also correspond to adventitious carbon. The N 1s peaks were deconvoluted into three peaks at 399.8, 401.4 and 404.5 and the 399.8 peak corresponded to the bridging nitrogen atoms in N(–C)3 or nitrogen bonded with hydrogen atoms.40,42–44 C–N–H groups originating from the defective condensation of melon structures or ![[double bond, length as m-dash]](https://www.rsc.org/images/entities/char_e001.gif) NH groups44–47 were represented by the peak at 401.4 eV. The charging effects or positive charge localization in the heterocycles were indicated by the peak at 404.4 eV.48,49 A new N 1s peak at 403.5 indicated the formation of N–Zn bonds.32 The Zn 2p spectrum contained a doublet at the binding energy values of 1046.8 and 1023.8 eV and was slightly higher than that expected for Zn 2p (1044.9 and 1021.9 eV values of Zn 2p1/2 and Zn 2p3/2 lines respectively). A binding energy difference of 23 eV indicated that Zn ions are in the +2 oxidation state.50–52 An upward shift of 1.93 eV in the binding energy of Zn 2p was due to the interfacial interaction between ZnS and g-C3N4 and formation of N–Zn bonds.32,53 The peaks at 162.9 and 161.9 showed the S 2p1/2 and S 2p3/2 lines of sulphur anions in the lattice of ZnS23 (Fig. 4).
NH groups44–47 were represented by the peak at 401.4 eV. The charging effects or positive charge localization in the heterocycles were indicated by the peak at 404.4 eV.48,49 A new N 1s peak at 403.5 indicated the formation of N–Zn bonds.32 The Zn 2p spectrum contained a doublet at the binding energy values of 1046.8 and 1023.8 eV and was slightly higher than that expected for Zn 2p (1044.9 and 1021.9 eV values of Zn 2p1/2 and Zn 2p3/2 lines respectively). A binding energy difference of 23 eV indicated that Zn ions are in the +2 oxidation state.50–52 An upward shift of 1.93 eV in the binding energy of Zn 2p was due to the interfacial interaction between ZnS and g-C3N4 and formation of N–Zn bonds.32,53 The peaks at 162.9 and 161.9 showed the S 2p1/2 and S 2p3/2 lines of sulphur anions in the lattice of ZnS23 (Fig. 4).
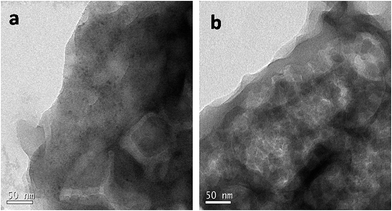
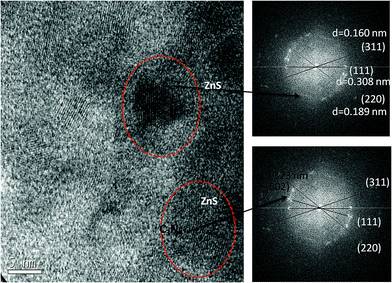
The morphology and microstructure of the prepared materials were analyzed by TEM (Fig. 5). TEM images confirmed the sheet like morphology, a characteristic feature of graphitized C3N4 (Fig. S2a and b†). The present method of simultaneous decomposition facilitated the homogeneous distribution of nanosized ZnS particles along C3N4 sheets in compositions containing up to 20 wt% ZnS. TEM studies indicated that the average particle size of the ZnS nanoparticles was 4–7 nm and an increase in ZnS loading in the compositions lead to an increase in the size of the ZnS particles (Fig. S2c and d†). High resolution TEM (HRTEM) micrographs of the C3N4–ZnS samples showed more or less spherical morphology of the embedded ZnS nanoparticles (Fig. S4†). The HRTEM micrographs of CZ14 vividly revealed composite interfaces of C3N4 and ZnS (Fig. S5†), confirming the heterostructure formation. The effective anchoring of ZnS nanoparticles on C3N4 sheets were signified by the lattice fringes (indicated by circles Fig. 6). The lattice fringes spaced by 0.160, 0.308 and 0.189 nm corresponded to the (311), (111) and (220) planes of cubic sphalerite ZnS and were supplementary to the XRD data. The well-defined interfaces between C3N4 sheets and ZnS nanoparticles were clearly seen in the HRTEM images and signified strong interaction of ZnS nanoparticles on C3N4 sheets. However, due to the indistinct in-plane diffraction (100), it was very difficult to obtain the lattice fringes of C3N4 (Fig. 6). EDAX patterns of the samples revealed the elemental compositions (Fig. S3†) of the composite interfaces. Effective heterostructure formation was observed only for compositions containing low concentrations of ZnS. The very low ZnS amounts in CZ11 and CZ5 were not observed in XRD analysis; however EDAX of CZ11 showed the presence of ZnS on the C3N4 sheets (Fig. S6†).
The photocatalytic activity was primarily investigated by using methylene blue (MB) as a model pollutant (Fig. S9†) and the most effective composition were further evaluated for the degradation of nitrophenol. The methylene blue degradation upon solar light illumination presented in Fig. S9† showed that the self photolysis of MB was negligible under sunlight illumination. The enhanced photocatalytic activity by different compositions of heterostructures of CZ was evident in the effective degradation of MB and the compositions with a lower amount of nanosized ZnS dispersions (CZ14 and CZ20) displayed highest activities by degrading more than 93% of the dye in 40 minutes of time. The compositions CZ67 and CZ72 showed 77.8 and 81.9, % dye degradation respectively while pure C3N4 and pure ZnS showed only 48% and 30% degradation respectively.
Quantitative estimation of MB degradation was done using pseudo first order reaction kinetics using the rate equation ln(C0/C) = kt, where k, C0 and C represented the rate constant, the initial concentration of MB and the actual concentration of MB at time t respectively. The k values obtained for pure C3N4, CZ72, CZ67, CZ20, CZ14 and ZnS were 0.0144, 0.0411, 0.03639, 0.06744, 0.07827 and 0.0057 min−1 respectively. The heterostructure composition CZ14 displayed a reaction rate 5.4 times higher than the bulk C3N4 (Fig. S10†).
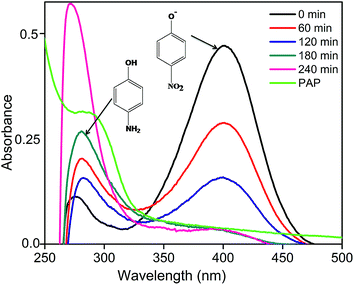
The effective composition CZ14 was also studied for the photocatalytic reduction of para nitrophenol (PNP) to para amino phenol (PAP) using sodium sulphite as hole scavenger under sunlight irradiation. PNP, one of the by-products of many chemical industries is toxic to the environment while PAP obtained by the reduction of PNP is a useful starting material for the preparation of many important products like paracetamol, acetanilide, phenacetin etc.54 The UV-visible absorption spectra of samples obtained during the photo reduction of PNP were shown in Fig. 7. In the alkaline condition of sulphite ions, phenolate ion (400 nm) was the predominant species. During photocatalytic reaction, the phenolate peak gradually diminished while a new absorption band around 285–295 nm indicated the formation of PAP.55 Upon irradiation, the photogenerated holes combined with sulphite ions (SO32−) to form sulphite radicals (SO32−*) while the electrons were trapped by the PNP to form radical nitrophenolate which finally got reduced to aminophenol. The heterostructure formation in CZ14 favoured the effective separation and migration of charge carriers and hence exhibited better photocatalytic reduction of PNP to PAP. The reaction can be written as follows56
| PNP + 3SO32− + H2O → PAP + 3SO42− |
Photocatalytic water splitting trials for the generation of H2 were carried out under visible light and sunlight, without using any noble co-catalysts. Control experiments revealed that no appreciable amount of hydrogen production was observed in the absence of photocatalyst or irradiation (not shown here). The results presented in Fig. 8a indicated the amount of hydrogen produced upon visible light irradiation using different photocatalysts. The composition CZ14 showed highest H2 production of 3484 μmol g−1 and was 30% higher compared to bare C3N4 samples (2680 μmol g−1). The same composition CZ14 was further tested for sunlight induced hydrogen generation for 2 h and the data presented in Fig. 8b indicated hydrogen generation values of up to 9.352 mmol g−1. This value is significantly higher compared to values obtained for similar compositions23,57,58 and is ascribed primarily to the generation of effective heterojunctions through the ultra fine ZnS dispersions in C3N4 sheets. The remarkable increase in hydrogen generation under sunlight indicated the utility of such photocatalysts for efficient outdoor applications. The hydrogen evolution was found increasing with increasing irradiation time and the composition CZ14 thus emerges as a promising photocatalyst for hydrogen generation applications. The fact that CZ14 can be engaged without a noble metal cocatalyst like Pt enables the photocatalyst to be an economically viable candidate.
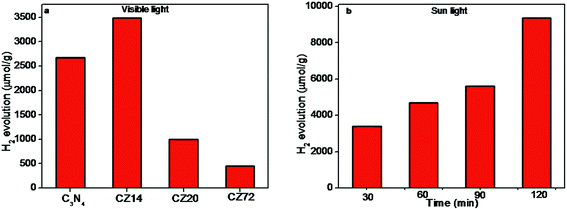 | ||
| Fig. 8 Photocatalytic hydrogen production over (a) C3N4–ZnS under visible light irradiation for 4 h and (b) hydrogen amount over the sample CZ14 under 2 h sunlight irradiation. | ||
3.1 Mechanism of improved photocatalytic activity
High surface area, enhanced light absorption capability, and reduced electron–hole recombination are the primary properties essential to have high photocatalytic efficiencies. In the present study, the samples with 14–20 wt% of ZnS showed maximum hydrogen generation and highest activity for organic degradation. This was attributed to the formation of C3N4–ZnS composite interfaces as revealed by TEM observations and validated by the extended absorption of visible light in UV-vis absorption studies. As the amount of ZnS increased beyond 20 wt%, there were particle agglomeration effects and the heterojunction formations were hindered. Trace amounts of impurity phases were also present in these compositions as indicated by XRD. The enhanced photocatalytic activity under solar light irradiation for CZ14 could be due to extended absorption in the longer wavelength region.Nitrogen adsorption–desorption analysis was used to determine the surface area of the prepared photocatalysts (Fig. S8†). An increase in surface area was observed with increased amount of ZnS in the compositions and was a natural consequence of the increased amounts of ultra fine ZnS particulates. All the prepared compositions indicated higher surface area values compared to bulk C3N4 (7.7 m2 g−1). The band gap, surface area, and MB degradation activity for the prepared compositions are summarized in Table 1.
| Sample | Surface area, m2 g−1 | Bandgap, eV | Activity, % |
|---|---|---|---|
| C3N4 | 7.8 | 2.72 | 47 |
| CZ72 | 26.0 | 3.05 | 82 |
| CZ67 | 18.9 | 3.03 | 78 |
| CZ20 | 12.3 | 2.65 | 94 |
| CZ14 | 11.9 | 2.60 | 95 |
CZ14 and CZ20 indicated highest activity for MB degradation under sunlight irradiation though the surface area values of these compositions were low compared to the ZnS rich compositions. The synergistic effect induced by composite interfaces of C3N4–ZnS heterojunctions lead to an extended absorption in the visible region and was presumed to be the primary factor responsible for this enhanced photocatalytic activity. The ZnS rich compositions possessed higher surface area but these compositions were characterized by higher band gap values (>3.0 eV) with minimum extension of absorption in the visible region. Minimum amount of ZnS in C3N4–ZnS compositions favoured the heterostructure formation by incorporating the fine sized ZnS particle within the graphitic C3N4 sheets. The exciton formation under sunlight irradiation was enhanced and a higher activity was thus obtained. Heterojunction formation and extended absorption in the visible light region was observed in compositions containing 14 and 20 wt% of nanosized ZnS. Higher amounts of ZnS in CZ67 and CZ72 induced particle agglomeration effects and in turn has led to the formation of islands of ZnS particles in such compositions.
The enhanced light absorption in the visible region leading to the generation, separation, and migration of the charge carriers are believed to be the primary characteristics that lead to improved photocatalytic activity of the heterojunctions. The band structure of the photocatalyst played also a vital role in these mechanistic pathways. The valence band edge position and conduction band edge position of the photocatalyst was estimated using the empirical formula59–62
| EVB = χ − Ee + 0.5Eg |
| ECB = EVB − Eg |
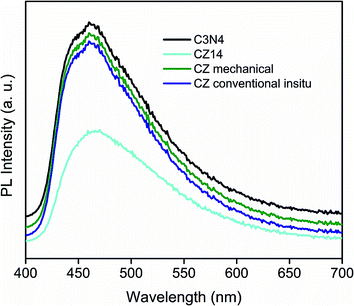
The increase of PL emission intensity represented higher recombination rates of free charge carriers leading to lowering of photocatalytic performance. The availability of photogenerated electron–hole pairs for the creation of reactive species responsible for catalytic activity can be evaluated by PL measurements. Fig. 9 showed the photoluminescence (PL) emission of pure C3N4, CZ14, CZM and CZC obtained by excitation at 380 nm. The PL patterns of CZ heterostructures were similar to that of the pure C3N4. For all the samples, the main emission peak was centred at around 450 nm due to the band–band phenomena attributed to the n–π* electronic transitions involving lone pairs of nitrogen atom in C3N4.65 In the CZ14 photocatalyst with C3N4–ZnS composite interfaces, PL intensity was much lower than that of the pure C3N4 indicating reduced recombination of electron–hole pairs when compared to bulk C3N4. The intensity of emission peaks of CZC and CZM almost matched with that of pure C3N4 indicating exciton recombinations to the level of pure C3N4. This emphasized that the electron–hole recombination effects commonly observed as a deleterious effect in C3N4 based photocatalysts can be effectively alleviated by the introduction of semiconductor nanoparticles with appropriate values of band gap. The present method of in situ incorporation of the ZnS nanoparticles into C3N4 sheets thus formed an efficient method of preparing photocatalysts with enhanced sunlight induced activity. The reduced recombination rate under sunlight irradiation was mainly due to the fact that the excited electrons from valence band to the conduction band of C3N4 were subsequently transferred to ZnS particles thereby preventing a direct recombination of electrons and holes. The schematic representation of this electron transfer process is depicted in Fig. S15.†
The suppression of electron–hole recombination and effective separation of the charge carriers were further evaluated by photocurrent measurements. Fig. 10 indicated that the photocurrent generation was more for CZ14 compared to pure C3N4. The synergistic effect between C3N4 and ZnS aided reduced recombination as well as improved separation of excitons at the interface of the heterojunctions leading to increased photo current generation.66,67
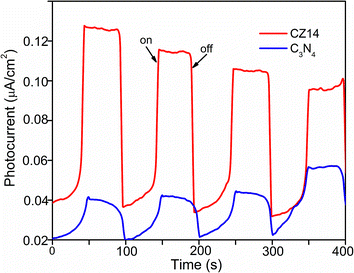 | ||
| Fig. 10 Transient photocurrent responses of CZ14 and pure C3N4 under continuous ON/OFF visible light irradiation. | ||
Further investigations to elucidate the photocatalytic mechanisms of the C3N4–ZnS heterostructures were done by the trapping experiments for hydroxyl radicals, superoxide anions and holes. The hydroxyl radical detection was done by PL analysis using terephthalic acid as the probe molecule.61 (Fig. S11a†) showed the photoluminescence (PL) intensity of CZ14 under sunlight irradiation for 40 minutes. The PL patterns revealed an increase in PL intensity as a function of the irradiation time and were a measure of the hydroxyl radicals generated in the solution due to the formation of 2-hydroxy terephthalic acid under sunlight irradiation. The measurement clearly substantiated the role of hydroxyl radicals in the photocatalytic process. The superoxide anion can be monitored by a luminol chemiluminescent probe method. CZ14 photocatalyst in luminol solution was irradiated under sunlight and the chemiluminescence was measured. The PL intensity of the luminol treated sample increased with irradiation time (Fig. S11b†) due to the successful trapping of superoxide anion radicals by the non fluorescent luminol to form fluorescent 3-aminophthalate (425 nm).68 The role of hydroxyl radicals again proved by isopropyl alcohol (IPA) as scavenger. The role of holes in the dye degradation process was investigated by employing EDTA as a scavenger. The role of super oxide anion radicals again proved with the help of para benzoquinone (PBQ) as the scavenger. Fig. S12† showed that the degradation is affected by superoxide anion > hydroxyl radical > holes. Therefore, the trapping experiments clearly evidenced the role of hydroxyl radicals, holes and superoxide anion radicals in the photocatalytic activity of the heterostructure photocatalyst.
On the basis of results and discussions above, the mechanism of sunlight induced MB degradation could be depicted as in Fig. S14.† Under light irradiation, the C3N4 could be excited easily since its bandgap lies in the visible region (2.72 eV). However, excitation of ZnS under sunlight irradiation was difficult as its band gap corresponded to UV absorption (3.6 eV). As the calculated CB edge potential of C3N4 is more negative than that of ZnS, the photoinduced electrons in the conduction band of C3N4 is easily transferred to the conduction band of ZnS. The type II staggered alignment of the heterostructure facilitated spatial separation between photoexcited charge carriers. At the same time holes in the VB of ZnS was injected to the VB of C3N4 leading to the formation of internal electrostatic potential which aided a prominent electron–hole separation with reduced recombination rates. The well separated charge carriers were transferred to the surface of the heterostructure photocatalyst and reaction with water molecule and oxygen lead to the formation of reactive species like hydroxyl radicals that degraded the dye efficiently. The generated holes directly oxidized the MB dye to CO2 and H2O. The photoexcited electrons reduced PNP to PNA, whereas the holes oxidised the sulphite ions to sulphate ions. Therefore, the heterostructure photocatalyst CZ14 have a well-defined interface and an effective charge separation leading to high activity for MB degradation and PNP reduction under sunlight irradiation. In the case of H2 generation from water, the photoinduced electrons reduced water to H2 and the holes oxidized the sacrificial methanol for the completion of the cycle. The enhanced activity of heterostructures was attributed to (1) the larger surface area of the prepared CZx heterostructures that facilitated better contact between the organic molecules and catalyst. (2) The extended absorption of the photocatalyst improving the light absorption capacity and the number of charge carriers available for the photocatalytic reaction. (3) The more or less uniform anchoring of nano ZnS on the C3N4 sheets providing a hierarchical type II staggered heterostructure leading to reduced recombination of excitons.
In order to understand the excited state dynamics of these compositions, the fluorescence lifetimes were measured by using time correlated single photon counting spectrometer. The fluorescence decay of C3N4 with various percentages of ZnS in water was measured by exciting at 375 nm and probed at 460 nm (Fig. S13†). The fluorescence kinetic traces were fitted with three-exponential decay and average lifetime was also calculated. The fitted results are shown in Table S1.† The average lifetime of 5.71 ns observed for C3N4 was decreased with the addition of ZnS. From the Table S1,† it was also observed that the amplitude of longer lifetime component decreased and that of the short lived component increased simultaneously in C3N4–ZnS compositions compared to pure C3N4. The decrease of emission intensity and average lifetime of heterostructures reflected that the electronic decay from excited state to ground state occurred through the non-radiative path, probably by the way of charge transfer of electron and holes to new localized/surface states as reported earlier by Antonietti et al.2
The recyclability of photocatalyst is an important aspect for practical applications. The stability of the heterostructure photocatalyst was measured by repeating dye degradation tests under similar conditions as shown in Fig. S15.† The photocatalytic activity of CZ14 for MB degradation had no significant reduction in the activity even after four cycles reiterating the suitability of such photocatalysts for practical applications under sunlight irradiation.
4. Conclusions
C3N4–ZnS heterojunction photocatalysts obtained by the one pot thermal decomposition of a precursor mix containing melamine, zinc nitrate, and thiourea displayed enhanced catalytic activity for hydrogen generation by water splitting (4 mmol g−1 h−1) as well as for the reduction of nitrophenol (>90% in 240 minutes). The formation of C3N4–ZnS composite interfaces led to the formation of type II staggered heterostructures that facilitated extended absorption in the visible region. Photoluminescence analysis and photocurrent measurements indicated reduced exciton recombinations leading to enhanced photocatalytic activity in the sunlight. The present study thus offers a simple and efficient synthesis protocol for obtaining highly efficient photocatalysts based on the g-C3N4 system.Associated content
FTIR spectrum of CZ compositions, TEM images of pure g-C3N4, CZ72, and CZ67, EDAX spectrum of CZ14, TEM image and EDAX of CZ11, N2 sorption isotherms, MB degradation graph and its rate constants with R2 value, photoluminescence spectra of CZ14 with terephthalic acid, MB degradation with EDTA, photoluminescence spectrum of CZ14 with luminol, and fluorescence decays of CZx heterostructures obtained by 375 nm excitation, mechanism of photocatalytic activity of CZ heterostructures under sunlight illumination, cycle runs of CZ 14 heterostructures for MB degradation under sunlight.Conflict of interest
The authors declare no competing financial interest.Acknowledgements
Acknowledgments are due to Dr R. Nandini Devi, Ms Leena George and Dr K Sreekumar of CSIR National Chemical Laboratory, Pune for the water splitting trials and XPS analysis respectively. Mr Kiran Mohan is thankfully acknowledged for the HRTEM micrographs. The authors are grateful to Council of Scientific and Industrial Research (CSIR, Government of India) for the 12th five year plan project on “IntelCoat” (CSC0114). Authors S. P. and S. K. R. thank CSIR and INSA respectively for the research fellowships.References
- S. J. A. Moniz, S. A. Shevlin, D. J. Martin, Z.-X. Guo and J. Tang, Energy Environ. Sci., 2015, 8, 731–759 CAS.
- M. Shalom, M. Guttentag, C. Fettkenhauer, S. Inal, D. Neher, A. Llobet and M. Antonietti, Chem. Mater., 2014, 26, 5812–5818 CrossRef CAS.
- D. A. Keane, K. G. McGuigan, P. F. Ibanez, M. I. Polo-Lopez, J. A. Byrne, P. S. M. Dunlop, K. O'Shea, D. D. Dionysiou and S. C. Pillai, Catal. Sci. Technol., 2014, 4, 1211–1226 CAS.
- P. Suyana, S. Nishanth Kumar, N. Madhavan, B. S. Dileep Kumar, B. N. Nair, A. P. Mohamed, K. G. K. Warrier and U. S. Hareesh, RSC Adv., 2015, 5, 76718–76728 RSC.
- F. E. Osterloh, Chem. Soc. Rev., 2013, 42, 2294–2320 RSC.
- Q. Li, N. Zhang, Y. Yang, G. Wang and D. H. L. Ng, Langmuir, 2014, 30, 8965–8972 CrossRef CAS PubMed.
- S. Cao, J. Low, J. Yu and M. Jaroniec, Adv. Mater., 2015, 27, 2150–2176 CrossRef CAS PubMed.
- J. Zhu, P. Xiao, H. Li and S. A. C. Carabineiro, ACS Appl. Mater. Interfaces, 2014, 6, 16449–16465 CAS.
- Y. Wang, X. Wang and M. Antonietti, Angew. Chem., Int. Ed., 2012, 51, 68–89 CrossRef CAS PubMed.
- X. Wang, S. Blechert and M. Antonietti, ACS Catal., 2012, 2, 1596–1606 CrossRef CAS.
- S. Cao and J. Yu, J. Phys. Chem. Lett., 2014, 5, 2101–2107 CrossRef CAS PubMed.
- P. Wu, J. Wang, J. Zhao, L. Guo and F. E. Osterloh, Chem. Commun., 2014, 50, 15521–15524 RSC.
- J. Zhang, J. Sun, K. Maeda, K. Domen, P. Liu, M. Antonietti, X. Fu and X. Wang, Energy Environ. Sci., 2011, 4, 675–678 CAS.
- Y. Zheng, J. Liu, J. Liang, M. Jaroniec and S. Z. Qiao, Energy Environ. Sci., 2012, 5, 6717–6731 CAS.
- M. Reza Gholipour, C.-T. Dinh, F. Beland and T.-O. Do, Nanoscale, 2015, 7, 8187–8208 RSC.
- X. Zou and Y. Zhang, Chem. Soc. Rev., 2015, 44, 5148–5180 RSC.
- K. Dai, L. Lu, C. Liang, G. Zhu, Q. Liu, L. Geng and J. He, Dalton Trans., 2015, 44, 7903–7910 RSC.
- J. Su, P. Geng, X. Li, Q. Zhao, X. Quan and G. Chen, Nanoscale, 2015, 7, 16282–16289 RSC.
- T. Han, Y. Chen, G. Tian, J.-Q. Wang, Z. Ren, W. Zhou and H. Fu, Nanoscale, 2015, 7, 15924–15934 RSC.
- N. Tian, H. Huang, C. Liu, F. Dong, T. Zhang, X. Du, S. Yu and Y. Zhang, J. Mater. Chem. A, 2015, 3, 17120–17129 CAS.
- D. Jiang, L. Chen, J. Xie and M. Chen, Dalton Trans., 2014, 43, 4878–4885 RSC.
- D. Jiang, L. Chen, J. Zhu, M. Chen, W. Shi and J. Xie, Dalton Trans., 2013, 42, 15726–15734 RSC.
- F. Shi, L. Chen, C. Xing, D. Jiang, D. Li and M. Chen, RSC Adv., 2014, 4, 62223–62229 RSC.
- Y. Shi, S. Jiang, K. Zhou, B. Wang, B. Wang, Z. Gui, Y. Hu and R. K. K. Yuen, RSC Adv., 2014, 4, 2609–2613 RSC.
- J. Wang, P. Guo, Q. Guo, P. G. Jonsson and Z. Zhao, CrystEngComm, 2014, 16, 4485–4492 RSC.
- Q. Wang, Y. Shi, Z. Du, J. He, J. Zhong, L. Zhao, H. She, G. Liu and B. Su, Eur. J. Inorg. Chem., 2015, 2015, 4108–4115 CrossRef CAS.
- H. Zhao, Y. Dong, P. Jiang, H. Miao, G. Wang and J. Zhang, J. Mater. Chem. A, 2015, 3, 7375–7381 CAS.
- Q. Xiang, J. Yu and M. Jaroniec, J. Phys. Chem. C, 2011, 115, 7355–7363 CAS.
- X. Wang, K. Maeda, A. Thomas, K. Takanabe, G. Xin, J. M. Carlsson, K. Domen and M. Antonietti, Nat. Mater., 2009, 8, 76–80 CrossRef CAS PubMed.
- P. Niu, L. Zhang, G. Liu and H.-M. Cheng, Adv. Funct. Mater., 2012, 22, 4763–4770 CrossRef CAS.
- G. Dong and L. Zhang, J. Mater. Chem., 2012, 22, 1160–1166 RSC.
- J.-X. Sun, Y.-P. Yuan, L.-G. Qiu, X. Jiang, A.-J. Xie, Y.-H. Shen and J.-F. Zhu, Dalton Trans., 2012, 41, 6756–6763 RSC.
- Y.-P. Zhu, M. Li, Y.-L. Liu, T.-Z. Ren and Z.-Y. Yuan, J. Phys. Chem. C, 2014, 118, 10963–10971 CAS.
- F. Yang, M. Lublow, S. Orthmann, C. Merschjann, T. Tyborski, M. Rusu, S. Kubala, A. Thomas, R. Arrigo, M. Hävecker and T. Schedel-Niedrig, ChemSusChem, 2012, 5, 1227–1232 CrossRef CAS PubMed.
- L. Ge, F. Zuo, J. Liu, Q. Ma, C. Wang, D. Sun, L. Bartels and P. Feng, J. Phys. Chem. C, 2012, 116, 13708–13714 CAS.
- A. Thomas, A. Fischer, F. Goettmann, M. Antonietti, J.-O. Muller, R. Schlogl and J. M. Carlsson, J. Mater. Chem., 2008, 18, 4893–4908 RSC.
- M. Rong, L. Lin, X. Song, T. Zhao, Y. Zhong, J. Yan, Y. Wang and X. Chen, Anal. Chem., 2015, 87, 1288–1296 CrossRef CAS PubMed.
- M. Wu, J.-M. Yan, X.-N. Tang, M. Zhao and Q. Jiang, ChemSusChem, 2014, 7, 2654–2658 CrossRef CAS PubMed.
- X. Zhang, X. Xie, H. Wang, J. Zhang, B. Pan and Y. Xie, J. Am. Chem. Soc., 2013, 135, 18–21 CrossRef CAS PubMed.
- Y. Li, J. Zhang, Q. Wang, Y. Jin, D. Huang, Q. Cui and G. Zou, J. Phys. Chem. B, 2010, 114, 9429–9434 CrossRef CAS PubMed.
- Q.-F. Deng, L. Liu, X.-Z. Lin, G. Du, Y. Liu and Z.-Y. Yuan, Chem. Eng. J., 2012, 203, 63–70 CrossRef CAS.
- A. Vinu, Adv. Funct. Mater., 2008, 18, 816–827 CrossRef CAS.
- Y. Cui, J. Zhang, G. Zhang, J. Huang, P. Liu, M. Antonietti and X. Wang, J. Mater. Chem., 2011, 21, 13032–13039 RSC.
- B. Chai, T. Peng, J. Mao, K. Li and L. Zan, Phys. Chem. Chem. Phys., 2012, 14, 16745–16752 RSC.
- X. Bai, L. Wang, Y. Wang, W. Yao and Y. Zhu, Appl. Catal., B, 2014, 152–153, 262–270 CrossRef CAS.
- X. Bai, R. Zong, C. Li, D. Liu, Y. Liu and Y. Zhu, Appl. Catal., B, 2014, 147, 82–91 CrossRef CAS.
- G. Zhang, J. Zhang, M. Zhang and X. Wang, J. Mater. Chem., 2012, 22, 8083–8091 RSC.
- Y. Sun, C. Li, Y. Xu, H. Bai, Z. Yao and G. Shi, Chem. Commun., 2010, 46, 4740–4742 RSC.
- Y.-S. Xu and W.-D. Zhang, ChemCatChem, 2013, 5, 2343–2351 CrossRef CAS.
- C.-M. Huang, K.-W. Cheng, Y.-R. Jhan and T.-W. Chung, Thin Solid Films, 2007, 515, 7935–7944 CrossRef CAS.
- V. L. Mukta, G. Shubha, S. A. Acharya and S. K. Kulkarni, Nanotechnology, 2008, 19, 415602 CrossRef PubMed.
- D. K. Mishra, J. Mohapatra, M. K. Sharma, R. Chattarjee, S. K. Singh, S. Varma, S. N. Behera, S. K. Nayak and P. Entel, J. Magn. Magn. Mater., 2013, 329, 146–152 CrossRef CAS.
- M. Futsuhara, K. Yoshioka and O. Takai, Thin Solid Films, 1998, 322, 274–281 CrossRef CAS.
- P. Praus, M. Turicová, M. Karlíková, L. Kvítek and R. Dvorský, Mater. Chem. Phys., 2013, 140, 493–498 CrossRef CAS.
- A. Hernández-Gordillo, A. G. Romero, F. Tzompantzi and R. Gómez, J. Powder Technol., 2013, 250, 97–102 CrossRef.
- A. Hernández-Gordillo, A. G. Romero, F. Tzompantzi, S. Oros-Ruiz and R. Gómez, J. Photochem. Photobiol., A, 2013, 257, 44–49 CrossRef.
- M. Wu, J.-M. Yan, X.-W. Zhang, M. Zhao and Q. Jiang, J. Mater. Chem. A, 2015, 3, 15710–15714 CAS.
- H. Liu, Z. Jin and Z. Xu, Dalton Trans., 2015, 44, 14368–14375 RSC.
- J. Cao, B. Xu, H. Lin, B. Luo and S. Chen, Dalton Trans., 2012, 41, 11482–11490 RSC.
- Z. Wu, L. Chen, C. Xing, D. Jiang, J. Xie and M. Chen, Dalton Trans., 2013, 42, 12980–12988 RSC.
- Y. Chen, W. Huang, D. He, Y. Situ and H. Huang, ACS Appl. Mater. Interfaces, 2014, 6, 14405–14414 CAS.
- T. Yan, Q. Yan, X. Wang, H. Liu, M. Li, S. Lu, W. Xu and M. Sun, Dalton Trans., 2015, 44, 1601–1611 RSC.
- Z. Wang, Y. Liu, B. Huang, Y. Dai, Z. Lou, G. Wang, X. Zhang and X. Qin, Phys. Chem. Chem. Phys., 2014, 16, 2758–2774 RSC.
- H. Li, Y. Zhou, W. Tu, J. Ye and Z. Zou, Adv. Funct. Mater., 2015, 25, 998–1013 CrossRef CAS.
- V. N. Khabashesku, J. L. Zimmerman and J. L. Margrave, Chem. Mater., 2000, 12, 3264–3270 CrossRef CAS.
- J. Lim, D. Monllor-Satoca, J. S. Jang, S. Lee and W. Choi, Appl. Catal., B, 2014, 152–153, 233–240 CrossRef CAS.
- Y. Bi, S. Ouyang, J. Cao and J. Ye, Phys. Chem. Chem. Phys., 2011, 13, 10071–10075 RSC.
- Y. Nosaka, Y. Yamashita and H. Fukuyama, J. Mater. Chem. B, 1997, 101, 5822–5827 CAS.
Footnote |
| † Electronic supplementary information (ESI) available. See DOI: 10.1039/c5ra27427c |
| This journal is © The Royal Society of Chemistry 2016 |

