A green technology for the synthesis of cellulose succinate for efficient adsorption of Cd(II) and Pb(II) ions
Xingzhen Qin,
Jierong Zhou,
Aimin Huang,
Jialin Guan,
Qinglong Zhang,
Zuqiang Huang*,
Huayu Hu,
Yanjuan Zhang*,
Mei Yang,
Juan Wu,
Yuben Qin and
Zhenfei Feng
School of Chemistry and Chemical Engineering, Guangxi University, Nanning 530004, China. E-mail: huangzq@gxu.edu.cn; xianquan919@163.com; Fax: +86 771 3233718; Tel: +86 771 3233728
First published on 7th March 2016
Abstract
Cellulose succinate, which was used for efficient adsorption of heavy metals, was directly prepared by mechanical activation (MA)-assisted solid-phase synthesis in a stirring ball mill with bagasse pulp and succinic acid as materials without the use of organic co-reagents and solvents. FTIR, XRD, SEM, and specific surface area analysis were used to characterize the structural characteristics of cellulose succinate. Furthermore, the effects of different degrees of esterification of modified cellulose on the adsorption of Cd2+ and Pb2+ were investigated. A surface charge characteristic was used to prove the effect of pH on the adsorption ability of cellulose succinate. It was found that the adsorption kinetics of Cd2+ and Pb2+ onto cellulose succinate fitted well with the pseudo-second-order model. The adsorption of Cd2+ and Pb2+ onto cellulose succinate was well described by the monolayer adsorption of the Langmuir isotherm model rather than the multilayer adsorption of the Freundlich isotherm model. The E values for the adsorption of Cd2+ and Pb2+ by cellulose succinate calculated by the Dubinin–Radushkevich equation were all in the range of 8–16 kJ mol−1, suggesting that the adsorption process mainly proceeded by ion exchange. The MA-assisted solid-phase synthesis method can produce efficient and environmental-friendly adsorbents.
1. Introduction
The rapid development of industry has made our lives more comfortable, but it has also resulted in heavy metal pollution from industrial discharges, such as mining, smelting, electroplating, etc.1,2 Heavy metals are highly toxic and nonbiodegradable,3 which pose great threats to human health and can be considered as a serious pollution problem.4,5 Therefore, efficient treatment of hazardous heavy metals is urgent and important.Traditional treatment methods for the removal of heavy metals include chemical precipitation, redox, ion exchange, membrane separation, and adsorption.6 Among these technologies, adsorption is considered to be the most efficient and suitable method for removing heavy metals from wastewater.7,8 Agricultural wastes, which are rich in lignocellulose, can be used as cheap adsorbents for heavy metals. Wheat straw, rice bran, wood sawdust, pineapple peel, etc. have been successfully applied to remove heavy metals from water.9,10
However, the capacity of natural cellulose to adsorb metal ions is limited. Therefore, natural cellulosic materials need to be modified to increase their adsorption capacities for heavy metal ions.11 There exist a large number of intermolecular and intramolecular hydrogen bonds between the molecular chains of cellulose, forming a network structure and severely inhibiting the contact and reaction between reagents and the hydroxyl groups in cellulose molecules.12 Researches on modifying cellulose for the adsorption of heavy metals normally involve the pretreatment of raw cellulose with sodium hydroxide to improve its reactivity and the grafting of functional groups with strong adsorption for metal ions, such as amine and carboxyl groups, to the cellulose surface in organic solvent reaction system.11,13–15 However, these conventional preparation methods are complex and usually require a long time, and the used organic solvent is harmful to environment. It has important significance to develop a simple, fast, and solvent-free technology for the preparation of cellulose-based adsorbents.
Mechanical activation (MA) changes the crystal structure and the physicochemical properties of solid materials by using high-energy ball milling and is normally used in the pretreatment of solid materials to improve their reactivity. Because MA does not require any solvent or organic medium, it is considered to be a simple and environmentally friendly pretreatment method.16 In recent years, our laboratory has developed a high-energy ball mill as a solid-phase reactor for the modification of natural polymers, and it has been successfully applied to the modification of lignocellulose with combining MA and chemical reaction in the same equipment.17–20 Based on these previous studies, this study investigated the preparation of cellulose succinate in the solid phase for simultaneous activation and esterification induced by MA. Fourier transform infrared spectroscopy (FTIR), X-ray diffractometry (XRD), scanning electron microscopy (SEM), and specific surface area analysis were used to measure the changes in the functional groups, crystal structure, microstructure, and specific surface area of the cellulose before and after modification. The cellulose succinates with different degrees of esterification, which were prepared in different MA time, were used as adsorbents for the adsorption of Cd(II) and Pb(II) ions from aqueous solution. By investigating the effect of different MA time on the adsorption ability of modified cellulose, the optimal cellulose-based adsorbent was selected, and its adsorption behavior and kinetics for heavy metal ions were detailedly investigated.
2. Experimental
2.1. Materials
Bleached pulp (BP), which had been treated by pulping and bleaching processes to remove lignin and chromophores, was obtained from a local paper mill (Nanning, China). It had about 86% cellulose and a degree of polymerization of 1300. Other chemical reagents were of analytical grade without further purification and obtained commercially.2.2. Preparation of adsorbents
The preparation of modified BP (MBP) was performed in a high-energy stirring ball mill. In a typical experiment, 10.0 g of BP, 20.0 g of succinic acid, and 1.5 g of sodium hypophosphite were evenly mixed and then were put in a milling tank. The milling was carried out at the speed of 300 rpm and a constant temperature of 90 °C for all the batch experiments. After milled for different reaction times (reaction time = milling time), the resulting powdered products were washed in sequence with 95% ethanol, deionized water, 98% ethanol, deionized water, and acetone. After drying at 50 °C for 2 h, the modified cellulose with three different degrees of esterification, which named MBP1, MBP2, and MBP3 (milling time = 0.5, 1.0, and 2.0 h, respectively), were obtained. To obtain more carboxylate functions for a better chelating function than the carboxylic groups, the cellulose succinates were treated with a saturated sodium bicarbonate solution for 30 min under a constant stirring, and then they were filtered and rinsed with deionized water to neutrality. The final products were dried and stored in a desiccator.2.3. Determination of degree of esterification
The degree of esterification of the MBPs was calculated by measuring the amount of carboxylic groups (CCOOH). The CCOOH was measured as follows: 0.1 g of MBP was precisely weighed and placed in a 250 mL conical flask, and then 100 mL of 0.01 mol L−1 sodium hydroxide solution was added to the flask. The solution was stirred at a constant temperature of 30 °C for 1 h. Finally, the solution was filtered, and 25 mL of filtrate was titrated with standard 0.01 mol L−1 HCl. The CCOOH (mmol g−1) in the adsorbent was calculated by using the following equation:21
 | (1) |
2.4. Characterization of structures
FTIR spectra of the samples (BP, MBP1, MBP2, and MBP3) were recorded with a Spectrum One FTIR Spectrometer (FTIR-8400S, SHIMADZU Corporation, Japan) at a resolution of 4 cm−1 from 400 to 4000 cm−1. Pressed pellets were prepared by grinding the powder specimens with KBr in an agate mortar.Wide angle XRD measurement was carried out on a D/MAX2500V diffractometer (Rigaku, Japan). The patterns with Cu Kα radiation (λ = 0.154 nm) at 40 kV and 30 mA were recorded in the range from 5° to 40°. The crystallinity (CrI) of the samples was estimated by using the following equation:22
 | (2) |
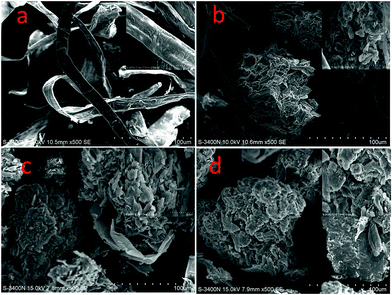
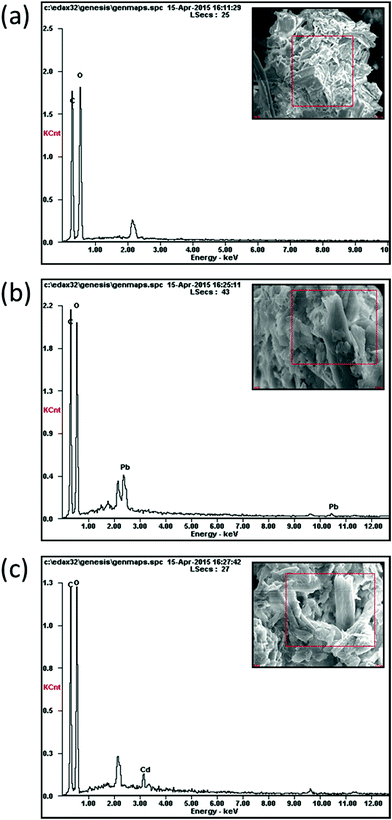
The surface morphologies of the samples (BP, MBP1, MBP2, and MBP3) and energy dispersive X-ray (EDX) spectra of MBP2 before and after the adsorption of heavy metal ions were observed by using a scanning electron microscope (S-3400N, Hitachi, Japan). The surfaces of the samples were coated with carbon and gold to be observed and photographed.
BET surface area analyzer (Gemini VII 2390, Micromeritics Corporation, USA) was used to determine the specific surface area of BP, MBP1, MBP2, and MBP3.
2.5. Characteristics of surface charge
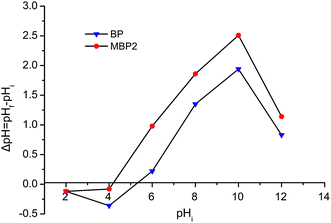
Samples of 1.0 g of BP or MBP2 were mixed with 50 mL of 0.1 mol L−1 NaNO3 solution. HNO3 or NaOH solution (0.1–1.0 mol L−1) was added to the mixed solution to adjust the initial pH (pH0) to 2.0, 4.0, 6.0, 8.0, 10.0, and 12.0. Then, the suspensions were intermittently shaken to mix and allowed to stand for 48 h until they reached equilibrium. The final pH (pHf) was measured, and then ΔpH = pHf − pH0 was calculated. The curve of ΔpH versus pH0 was plotted to determine the point of zero charge (pHZPC) of the samples.232.6. Adsorption experiments
Samples of 25.0 mg of BP, MBP1, MBP2, or MBP3 were placed in the 50 mL conical flasks, which 25 mL of metal ion solution (Cd2+ or Pb2+) was added. NaOH or HCl solution (0.01–1.0 mol L−1) was added to adjust the pH. The flasks were then placed in a constant-temperature shaking bath. The rotation speed and temperature were set at 150 rpm and 25 °C, respectively. Sufficient time was allowed for complete mixing and adsorption. After adsorption, the solution was filtered, and single sweep oscillopolarography was used to determine the concentration of metal ions in solution.24 The amount of metal ions adsorbed onto adsorbents was calculated by using the following equation:
 | (3) |
3. Results and discussion
3.1. Characterization
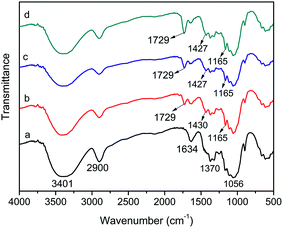
![[double bond, length as m-dash]](https://www.rsc.org/images/entities/char_e001.gif) O and C–O–C in ester groups, respectively, which suggest that the cellulose had been successfully esterified. Moreover, with the increase of milling time, the absorption intensity of the peak at 1729 cm−1 also increased, indicating that the degree of esterification improved with increasing the reaction time. A new weak absorption peak appearing at 1427 cm−1 could be attributed to the bending vibration of OH in carboxyl groups, suggesting that –COOH was introduced to cellulose after the modification. The wide vibration absorption peak at 3401 cm−1 did not show a significant change in intensity because of the presence of unreacted hydroxyl groups in MBPs.17 However, the area at this peak position became wide, likely caused by the introduced –COOH groups. The FTIR analysis reveals that BP was successful esterified by MA-assisted solid-phase reaction with different milling times, and a large amount of –COOH groups had been introduced to cellulose, which possess strong adsorption for heavy metal ions.
O and C–O–C in ester groups, respectively, which suggest that the cellulose had been successfully esterified. Moreover, with the increase of milling time, the absorption intensity of the peak at 1729 cm−1 also increased, indicating that the degree of esterification improved with increasing the reaction time. A new weak absorption peak appearing at 1427 cm−1 could be attributed to the bending vibration of OH in carboxyl groups, suggesting that –COOH was introduced to cellulose after the modification. The wide vibration absorption peak at 3401 cm−1 did not show a significant change in intensity because of the presence of unreacted hydroxyl groups in MBPs.17 However, the area at this peak position became wide, likely caused by the introduced –COOH groups. The FTIR analysis reveals that BP was successful esterified by MA-assisted solid-phase reaction with different milling times, and a large amount of –COOH groups had been introduced to cellulose, which possess strong adsorption for heavy metal ions.
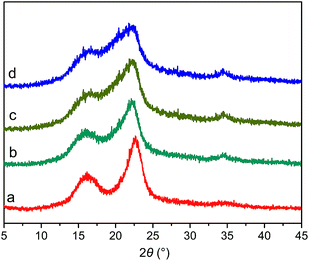
![[1 with combining macron]](https://www.rsc.org/images/entities/char_0031_0304.gif) , and 002 crystal planes for cellulose I, respectively.18 The diffraction intensity was weak for the 101 and 10
, and 002 crystal planes for cellulose I, respectively.18 The diffraction intensity was weak for the 101 and 10![[1 with combining macron]](https://www.rsc.org/images/entities/char_0031_0304.gif) crystal planes and these two peaks overlap with each other because BP contains a certain amount of lignin and semicellulose, resulting in the amorphous state of BP.17 It can be directly observed from the XRD patterns that with the increase of milling time, the 002 crystallization peak gradually decreased and the 10
crystal planes and these two peaks overlap with each other because BP contains a certain amount of lignin and semicellulose, resulting in the amorphous state of BP.17 It can be directly observed from the XRD patterns that with the increase of milling time, the 002 crystallization peak gradually decreased and the 10![[1 with combining macron]](https://www.rsc.org/images/entities/char_0031_0304.gif) crystallization peak widened with weak intensity. The crystallinity of BP, MBP1, MBP2, and MBP3 can be calculated by eqn (2), and the results are shown in Table 1. The crystallinity of BP was 76.4%, and it decreased to 52.6%, 42.2%, and 33.7% after milled for 0.5, 1.0, and 2.0 h, respectively. These results indicate that MA can significantly disrupt the intramolecular and intermolecular hydrogen bonds in cellulose and effectively destroy the crystal structure of cellulose, leading to the decrease of crystallinity and the increase of amorphous regions.26 Cellulose consists of crystalline and amorphous regions. Chemical reagents are difficult to enter into the crystalline region because of its stable structure, and chemical reactions mainly occur in the amorphous region. On one hand, the intense ball-milling destroys the stable hydrogen bonds, generating free hydroxyl groups and increasing the reactivity of cellulose. On the other hand, ball-milling transforms the stable crystalline structure to an easily accessible and penetrable amorphous structure, thereby enhancing the accessibility of cellulose.
crystallization peak widened with weak intensity. The crystallinity of BP, MBP1, MBP2, and MBP3 can be calculated by eqn (2), and the results are shown in Table 1. The crystallinity of BP was 76.4%, and it decreased to 52.6%, 42.2%, and 33.7% after milled for 0.5, 1.0, and 2.0 h, respectively. These results indicate that MA can significantly disrupt the intramolecular and intermolecular hydrogen bonds in cellulose and effectively destroy the crystal structure of cellulose, leading to the decrease of crystallinity and the increase of amorphous regions.26 Cellulose consists of crystalline and amorphous regions. Chemical reagents are difficult to enter into the crystalline region because of its stable structure, and chemical reactions mainly occur in the amorphous region. On one hand, the intense ball-milling destroys the stable hydrogen bonds, generating free hydroxyl groups and increasing the reactivity of cellulose. On the other hand, ball-milling transforms the stable crystalline structure to an easily accessible and penetrable amorphous structure, thereby enhancing the accessibility of cellulose.
| Sample | Milling time (h) | CrI (%) | Surface area (m2 g−1) | CCOOH (mmol g−1) | qe (mg g−1) | |
|---|---|---|---|---|---|---|
| Cd2+ | Pb2+ | |||||
| BP | — | 76.4 | 1.5609 | 0.65 | 9.67 | 13.82 |
| MBP1 | 0.5 | 52.6 | 1.7168 | 3.72 | 40.96 | 82.40 |
| MBP2 | 1.0 | 42.2 | 2.0992 | 5.35 | 87.56 | 187.65 |
| MBP3 | 2.0 | 33.7 | 1.9451 | 5.86 | 82.85 | 180.96 |
3.2. Adsorption studies
Fig. 5 shows the pHZPC curve for BP and MBP2. The pHZPC values obtained at ΔpH = 0 for BP and MBP2 were 5.3 and 4.2, respectively. For pH < pHZPC, the adsorbent surface carries a positive charge, whereas for pH > pHZPC, the adsorbent surface carries a negative charge.23 The results suggest that the potential at the point of zero charge for BP decreased after esterification, resulting in more negative charges on the surface of MBP2, which enhanced the adsorption of metal cations.
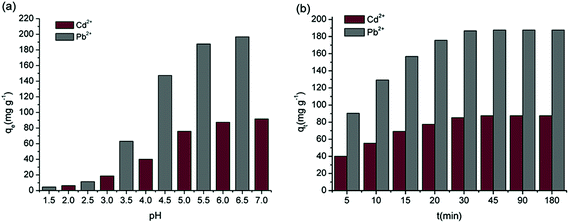
For the pH in the range of 2–7 and 1.5–6.5, the adsorption of Cd2+ and Pb2+ by MBP2 is shown in Fig. 6a. The adsorption capacities of Cd2+ and Pb2+ by MBP2 increased with increasing pH. The largest adsorption capacities were 91.73 and 196.67 mg g−1 at pH 7.0 and 6.5, respectively, which agree well with the results obtained by Gurgel et al.15 For pH < 3.0, the adsorption capacity of Cd2+ and Pb2+ was very small because a large amount of H+ compete with heavy metal ions at low pH, leading to protonation reactions with the functional groups on the surface of adsorbents.14 Under this condition, pH < pHZPC, and the adsorbent surfaces carried positive charges, which generated electrostatic repulsion to metal cations.29 With increasing pH, this competition weakened; when pH > pHZPC, the adsorbent surfaces carried negative charges and easily adsorbed positively charged metal ions. For pH > 6, Cd2+ and Pb2+ may form hydroxide precipitates, which cannot be efficiently adsorbed by the adsorbents.30 Therefore, the optimum pH for investigating the adsorption ability and behavior of MBP2 is around 6.0.
3.3. Adsorption kinetics
To investigate the kinetic mechanism of the adsorption of Cd2+ and Pb2+ by MBP2 and the adsorption rate and rate-controlling steps, the experimental data were fitted by using pseudo-first order model, pseudo-second order model, intra-particle diffusion model, and Elovich model.The expression for the pseudo-first order model is shown in eqn (4):31
ln(qe − qt) = ln![[thin space (1/6-em)]](https://www.rsc.org/images/entities/char_2009.gif) qe − k1t qe − k1t
| (4) |
The expression for the pseudo-second order model is shown in eqn (5):32
 | (5) |
 | ||
| Fig. 7 Fitting experimental date of absorption kinetics: (a) pseudo-first order model, (b) pseudo-second order model, (c) intra-particle diffusion model, and (d) Elovich model. | ||
The expression for the intra-particle diffusion model is shown as follows:33
| qt = Kit0.5 + C | (6) |
The Elovich model is a two-parameter model, and its expression is shown in eqn (7):34
 | (7) |
![[thin space (1/6-em)]](https://www.rsc.org/images/entities/char_2009.gif) t (Fig. 7d).
t (Fig. 7d).
The parameters of these four aforementioned kinetic models are shown in Table 2. Based on the correlation coefficients (R2), the pseudo-second order model fitted the experimental kinetic data best (R2 > 0.999). In addition, compared with the pseudo-first order model, values of qe(cal) calculated from the pseudo-second order model were in better agreement with the experimental values, qe(exp). Moreover, the pseudo-first order model can only be applied to describe the initial stage of adsorption. In contrast, the pseudo-second order model can predict the entire period of the adsorption behaviors. Therefore, the pseudo-second order model can better describe the adsorption behavior of heavy metal ions by MBP2.
| Kinetic model | Parameters | Metal ion | |
|---|---|---|---|
| Cd2+ | Pb2+ | ||
| Pseudo-first order | qe(exp) (mg g−1) | 87.56 | 187.65 |
| qe(cal) (mg g−1) | 90.78 | 273.34 | |
| k1 (min−1) | 0.117 | 0.177 | |
| R2 | 0.9841 | 0.9552 | |
| Pseudo-second order | qe(exp) (mg g−1) | 87.56 | 187.65 |
| qe(cal) (mg g−1) | 89.37 | 190.48 | |
| k2 (g mg−1 min−1) | 0.0034 | 0.0022 | |
| R2 | 0.9993 | 0.9994 | |
| Intra-particle diffusion | Ki (mg g−1 min−1) | 12.50 | 28.40 |
| C (mg g−1) | 15.06 | 32.69 | |
| R2 | 0.9079 | 0.8986 | |
| Elovich model | α (mg g−1 min−1) | 42.932 | 106.164 |
| β (mg g−1) | 0.0535 | 0.0250 | |
| R2 | 0.9077 | 0.8745 | |
The R2 value was very small for fitting the whole process by using the intra-particle diffusion model, suggesting that the whole adsorption process did not agree with the intra-particle diffusion model. If separate fittings were performed, an excellent linear relationship could be obtained. These results suggest that the adsorption process consisted of two stages.35 If the fitted line passes through the origin, the adsorption is controlled by internal diffusion. However, whether whole-process fitting or separate-stage fitting was performed, the line did not pass through the origin, suggesting that internal diffusion was not the only controlling step for the adsorption.
The R2 values were 0.9077 and 0.8745 for fitting the Cd2+ and Pb2+ adsorption by using the Elovich model, suggesting that the adsorption did not agree with the Elovich model.
3.4. Adsorption isotherms
Usually, adsorption isotherms describe the relationship between the amount of the solute that is adsorbed and solute concentration of the solution at equilibrium at a certain temperature and pH. Three adsorption isotherm models were used to fit the experimental data of the adsorption of Cd2+ and Pb2+ by MBP2.The expression for the Freundlich isotherm is shown in eqn (8):36
 | (8) |
![[thin space (1/6-em)]](https://www.rsc.org/images/entities/char_2009.gif) qe versus ln
qe versus ln![[thin space (1/6-em)]](https://www.rsc.org/images/entities/char_2009.gif) Ce shown in Fig. 8a, the parameters of the Freundlich isotherm can be obtained (as shown in Table 3).
Ce shown in Fig. 8a, the parameters of the Freundlich isotherm can be obtained (as shown in Table 3).
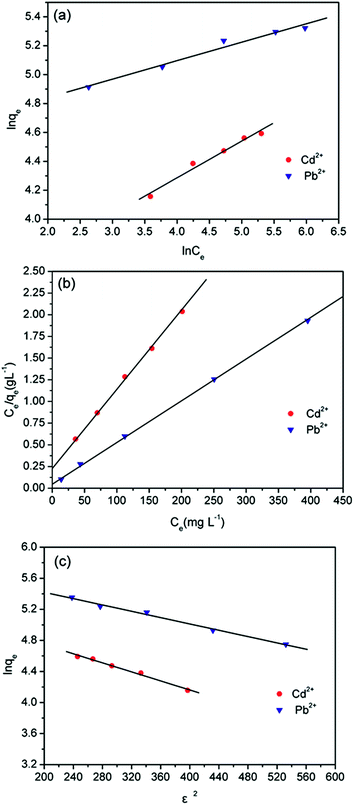 | ||
| Fig. 8 Fitting experimental date of absorption isotherms: (a) Freundlich isotherm, (b) Langmuir isotherm, and (c) Dubinin–Radushkevich isotherm. | ||
| Equilibrium model | Parameters | Metal ion | |
|---|---|---|---|
| Cd2+ | Pb2+ | ||
| Freundlich isotherm | 1/n | 0.254 | 0.128 |
| Kf (L mg−1) | 26.32 | 8.12 | |
| R2 | 0.9777 | 0.9742 | |
| Langmuir isotherm | Qmax (mg g−1) | 109.41 | 207.90 |
| KL (L mg−1) | 0.041 | 0.106 | |
| R2 | 0.9999 | 1.0000 | |
| Dubinin–Radushkevich isotherm | Qmax (mg g−1) | 112.91 | 227.15 |
| Kd (mol2 kJ−2) | 0.0029 | 0.0020 | |
| E (kJ mol−1) | 13.13 | 15.81 | |
| R2 | 0.9908 | 0.9914 | |
The R2 values were 0.9777 and 0.9742 as using Freundlich isotherm model to fit the adsorption of Cd2+ and Pb2+ by MBP2, respectively. The 1/n values were 0.254 and 0.128 for the adsorption of Cd2+ and Pb2+, respectively. The 1/n values between 0.1 and 0.5 indicate that the adsorption is easy to occur; by contrast, values of 1/n > 2.0 indicate that it is difficult to adsorb. This can effectively explain the phenomenon that the adsorption could quickly reach equilibrium. However, the Freundlich isotherm is an empirical model that cannot explain the adsorption mechanism.
The expression of the Langmuir isotherm is shown as follows:37
 | (9) |
Table 3 shows that the R2 values were 0.9999 and 1.0000 as using the Langmuir isotherm to fit the adsorption of Cd2+ and Pb2+ by MBP2, respectively, which suggest that the adsorption was in excellent agreement with the Langmuir isotherm model. However, the calculated Qmax values for Cd2+ and Pb2+ were 109.41 and 207.90 mg g−1, respectively, which were larger than the experimental values. The Langmuir isotherm can well explain the phenomenon that the adsorption rate was fast in the initial stage but slowed down thereafter. The Langmuir isotherm assumes that the adsorption mechanism is single-layer adsorption, and the binding sites accordingly decrease with the increase of adsorption time.
The expression for the Dubinin–Radushkevich isotherm is shown in eqn (10):38
ln![[thin space (1/6-em)]](https://www.rsc.org/images/entities/char_2009.gif) qe = ln qe = ln![[thin space (1/6-em)]](https://www.rsc.org/images/entities/char_2009.gif) Qmax + Kdε2 Qmax + Kdε2
| (10) |
 | (11) |
![[thin space (1/6-em)]](https://www.rsc.org/images/entities/char_2009.gif) qe versus ε2 in Fig. 8c. The mean adsorption energy (E) can be calculated with the following equation by using Kd:39
qe versus ε2 in Fig. 8c. The mean adsorption energy (E) can be calculated with the following equation by using Kd:39
 | (12) |
The parameters and the linear correlation coefficient for the Dubinin–Radushkevich isotherm are listed in Table 3. The E values for the adsorption of Cd2+ and Pb2+ by MBP2 were 13.13 and 15.81 kJ mol−1, respectively. The E value is very useful for determining the adsorption mechanism. Usually, a value of E < 8 kJ mol−1 indicates the physical adsorption, while a E value between 8 and 16 kJ mol−1 is associated with ion exchange adsorption.40,41 In this study, the E values for the adsorption of Cd2+ and Pb2+ by MBP2 were between 8 and 16 kJ mol−1, suggesting that the adsorption was mainly governed by ion exchange, which is attributed to the introduction of a large number of carboxyl groups to BP by MA-assisted modification.
As comparing the parameters of the isothermal adsorption models for the adsorption of metal ions by MBP2, it can be found that the values of n, Qmax, KL, and E for Pb2+ were all greater than those for Cd2+, suggesting that the adsorption of Pb2+ is stronger than that of Cd2+. There are two possible reasons for this difference. Firstly, compared with Cd2+, the ionic radius and molecular weight of Pb2+ are larger, so Pb2+ has a larger physical surface area and is easy to be captured.42 Secondly, the chemical stability constants (log![[thin space (1/6-em)]](https://www.rsc.org/images/entities/char_2009.gif) K) of metal–MBP2 are Pb2+ (7.45) > Cd2+ (5.73), which lead to the easier adsorption of Pb2+.43
K) of metal–MBP2 are Pb2+ (7.45) > Cd2+ (5.73), which lead to the easier adsorption of Pb2+.43
4. Conclusions
BP was successfully modified to produce cellulose succinate adsorbents by MA-assisted solid-phase reaction, and large amounts of carboxyl groups were introduced. FTIR, XRD, SEM, and specific surface area analysis were used to characterize the structural characteristics of cellulose succinate and investigate the process and mechanism of the MA-assisted modification. By investigating the effects of different degrees of esterification of modified cellulose on the adsorption of Cd2+ and Pb2+, MBP2, which had the best adsorption, was selected as the adsorbent to study the factors that influenced the adsorption and the adsorption mechanism. The results of equilibrium adsorption showed that the adsorption rate of MBP2 was fast and reached equilibrium for Cd2+ and Pb2+ at 45 and 40 min, respectively. The kinetic study indicated that the adsorption process of MBP2 was well-described by the pseudo-second order model, and internal diffusion was not the only controlling step for adsorption. The studies of adsorption isotherms suggested that the Langmuir isotherm model well explained the experimental data of Cd2+ and Pb2+ adsorption onto MBP2, and the adsorption capacities Qmax for Cd2+ and Pb2+ were 109.41 and 207.90 mg g−1, respectively. The E values for the adsorption of Cd2+ and Pb2+ by MBP2 calculated by the Dubinin–Radushkevich equation were all in the range of 8–16 kJ mol−1, suggesting that the adsorption was mainly governed by ion exchange. In summary, the MA-assisted solid-phase synthesis method can produce efficient and environmental-friendly adsorbents.Acknowledgements
This research was supported by National Natural Science Foundation of China (No. 51163002 and 51463003), Guangxi Natural Science Foundation of China (No. 2013GXNSFDA019004, 2013GXNSFBA019028, and 2014GXNSFBA118057), the Foundation of Guangxi Department of Education, China (YB2014015), Guangxi Distinguished Experts Special Foundation of China, and the Scientific Research Foundation of Guangxi University, China (Grant No. XTZ140787).References
- Z. A. Al-Othman, M. Naushad and Inamuddin, Chem. Eng. J., 2011, 172, 369–375 CrossRef CAS.
- M. C. Tomei, D. M. Angelucci, M. C. Annesini and A. J. Daugulis, J. Hazard. Mater., 2013, 262, 31–37 CrossRef CAS PubMed.
- F. Zhao, E. Repo, D. Yin and M. E. T. Sillanpää, J. Colloid Interface Sci., 2013, 409, 174–182 CrossRef CAS PubMed.
- A. M. Alsabagh, M. Fathy and R. E. Morsi, RSC Adv., 2015, 5, 55774–55783 RSC.
- P. C. Nagajyoti, K. D. Lee and T. V. M. Sreekanth, Environ. Chem. Lett., 2010, 8, 199–216 CrossRef CAS.
- M. Islam and R. Patel, J. Hazard. Mater., 2009, 172, 707–715 CrossRef CAS PubMed.
- E. Repo, J. K. Warchoł, A. Bhatnagar and M. Sillanpää, J. Colloid Interface Sci., 2011, 358, 261–267 CrossRef CAS PubMed.
- C. Cheng, J. Wang, X. Yang, A. Li and C. Philippe, J. Hazard. Mater., 2014, 264, 332–341 CrossRef CAS PubMed.
- T. A. H. Nguyen, H. H. Ngo, W. S. Guo, J. Zhang, S. Liang, Q. Y. Yue, Q. Li and T. V. Nguyen, Bioresour. Technol., 2013, 148, 574–585 CrossRef CAS PubMed.
- M. Ghasemi, M. Naushad, N. Ghasemi and Y. Khosravi-fard, J. Ind. Eng. Chem., 2014, 20, 2193–2199 CrossRef CAS.
- F. V. Pereira, L. V. A. Gurgel and L. F. Gil, J. Hazard. Mater., 2010, 176, 856–863 CrossRef CAS PubMed.
- A. T. W. M. Hendriks and G. Zeeman, Bioresour. Technol., 2009, 100, 10–18 CrossRef CAS PubMed.
- Z. Sun, Y. Liu, Y. Huang, X. Tan, G. Zeng, X. Hu and Z. Yang, J. Colloid Interface Sci., 2014, 434, 152–158 CrossRef CAS PubMed.
- S. Hokkanen, E. Repo and M. Sillanpää, Chem. Eng. J., 2013, 223, 40–47 CrossRef CAS.
- L. V. A. Gurgel, R. P. D. Freitas and L. F. Gil, Carbohydr. Polym., 2008, 74, 922–929 CrossRef CAS.
- P. Baláž and E. Dutková, Miner. Eng., 2009, 22, 681–694 CrossRef.
- H. Hu, H. Li, Y. Zhang, Y. Chen, Z. Huang, A. Huang, Y. Zhu, X. Qin and B. Lin, RSC Adv., 2015, 5, 20656–20662 RSC.
- Z. Huang, Y. Tan, Y. Zhang, X. Liu, H. Hu, Y. Qin and H. Huang, Bioresour. Technol., 2012, 118, 624–627 CrossRef CAS PubMed.
- Y. Zhang, T. Gan, Y. Luo, X. Zhao, H. Hu, Z. Huang, A. Huang and X. Qin, Compos. Sci. Technol., 2014, 102, 139–144 CrossRef CAS.
- Y. Zhang, Q. Li, J. Su, Y. Lin, Z. Huang, Y. Lu, G. Sun, M. Yang, A. Huang, H. Hu and Y. Zhu, Bioresour. Technol., 2015, 177, 176–181 CrossRef CAS PubMed.
- K. A. G. Gusmão, L. V. A. Gurgel, T. M. S. Melo, C. D. F. Carvalho and L. F. Gil, J. Environ. Manage., 2014, 133, 332–342 CrossRef PubMed.
- S. Kim and M. T. Holtzapple, Bioresour. Technol., 2006, 97, 583–591 CrossRef CAS PubMed.
- L. B. L. Lim, N. Priyantha and N. H. M. Mansor, Environ. Earth Sci., 2015, 73, 3239–3247 CrossRef.
- D. Monticelli, E. Ciceri and C. Dossi, Anal. Chim. Acta, 2007, 594, 192–198 CrossRef CAS PubMed.
- A. M. Adel, Z. H. A. El Wahab, A. A. Ibrahim and M. T. Al Shemy, Bioresour. Technol., 2010, 101, 4446–4455 CrossRef CAS PubMed.
- W. Zhang, M. Liang and C. Lu, Cellulose, 2007, 14, 447–456 CrossRef CAS.
- Z. Huang, N. Wang, Y. Zhang, H. Hu and Y. Luo, Composites, Part A, 2012, 43, 114–120 CrossRef.
- O. Karnitz, L. V. A. Gurgel, J. C. P. de Melo, V. R. Botaro, T. M. S. Melo, R. P. de Freitas Gil and L. F. Gil, Bioresour. Technol., 2007, 98, 1291–1297 CrossRef CAS PubMed.
- D. H. K. Reddy, K. Seshaiah, A. V. R. Reddy and S. M. Lee, Carbohydr. Polym., 2012, 88, 1077–1086 CrossRef CAS.
- D. Zhou, L. Zhang, J. Zhou and S. Guo, Water Res., 2004, 38, 2643–2650 CrossRef CAS PubMed.
- Y. Ho, Scientometrics, 2004, 59, 171–177 CrossRef CAS.
- Y. Ho, J. Hazard. Mater., 2006, 136, 681–689 CrossRef CAS PubMed.
- W. J. Weber and J. C. Morris, J. Sanit. Eng. Div., Am. Soc. Civ. Eng., 1963, 89, 31–60 Search PubMed.
- S. H. Chien and W. R. Clayton, Soil Sci. Soc. Am. J., 1980, 44, 265–268 CrossRef CAS.
- Q. Zhong, Q. Yue, Q. Li, B. Gao and X. Xu, Carbohydr. Polym., 2014, 111, 788–796 CrossRef CAS PubMed.
- D. H. K. Reddy, Y. Harinath, K. Seshaiah and A. V. R. Reddy, Chem. Eng. J., 2010, 162, 626–634 CrossRef CAS.
- I. Langmuir, J. Am. Chem. Soc., 1916, 38, 2221–2295 CrossRef CAS.
- M. M. Dubinin and L. V. Radushkevich, Proc. Acad. Sci. USSR, Phys. Chem. Sect., 1947, 55, 331–333 Search PubMed.
- M. M. Dubinin, Chem. Rev., 1960, 60, 235–266 CrossRef CAS.
- A. S. Singha and A. Guleria, J. Environ. Chem. Eng., 2014, 2, 1456–1466 CrossRef CAS.
- L. Mihaly-Cozmuta, A. Mihaly-Cozmuta, A. Peter, C. Nicula, H. Tutu, D. Silipas and E. Indrea, J. Environ. Manage., 2014, 137, 69–80 CrossRef CAS PubMed.
- M. A. Hossain, H. H. Ngo, W. S. Guo, L. D. Nghiem, F. I. Hai, S. Vigneswaran and T. V. Nguyen, Bioresour. Technol., 2014, 160, 79–88 CrossRef CAS PubMed.
- C. R. Adhikari, D. Parajuli, K. Inoue, K. Ohto and H. Kawakita, Chemosphere, 2008, 72, 182–188 CrossRef CAS PubMed.
| This journal is © The Royal Society of Chemistry 2016 |

