Theoretical and experimental investigations of the Li storage capacity in single-walled carbon nanotube bundles

G. Ramos-Sancheza, G. Chenb, A. R. Harutyunyanb and P. B. Balbuena*a
aDepartment of Chemical Engineering, Texas A&M University, College Station, TX 77843, USA. E-mail: balbuena@tamu.edu
bHonda Research Institute USA Inc., Columbus, OH 43212, USA

Received 19th December 2015 , Accepted 7th March 2016

First published on 11th March 2016


Abstract

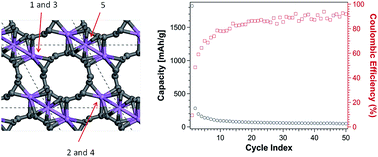
Single-walled carbon nanotube bundles are investigated as Li-ion battery anode materials using a theoretical and experimental approach. Density functional theory yields Li binding energies and the intercalation capacity of a fixed density bundle of identical tubes. Two nanotube diameters are tested to explore the size effect on Li storage capacity. An infinite bundle model represents low surface area and a bundle with open tubes describes high surface area tuned by edges terminated in low-coordinated sites or functionalized with hydrogen. Charge and discharge curves are measured during the first 5 cycles and the chemistry of intercalation and interfacial reactions are characterized via in situ Raman spectroscopy. A significantly high capacity at the first discharge featuring Li intercalation and products from interfacial reactions evident from Raman spectroscopy is dramatically reduced at the 2nd cycle and still decreases during successive cycles. The experimentally observed irreversible capacity loss is explained by the density functional theory analyses that demonstrate a much lower capacity of the nanotube bundle compared to graphite, in agreement with the results obtained in the 2nd cycle. The excess capacity measured in the first cycle is attributed to the presence of defects and unsaturated edges and to the formation of a solid-electrolyte interphase.

Introduction

Carbon materials are still among the most practical and effective alternatives to the use of a Li metal as negative electrode in Li-ion batteries. Graphite can store Li up to a theoretical capacity of 372 mA h g−1.1 For other carbon structures a slightly better theoretical capacity can be achieved with more or less effectiveness depending on the carbon structure, which in turn depends on the pre-treatment to which the electrode material is subjected to before cell assembly.2 Thermal and chemical pre-treatments are able to modify the carbon crystalline structure and its surface area.3 Both structure and surface area determine not only the storage capacity but also most importantly the stability which is manifested by the storage reversibility upon cycling.4 For example, high surface area carbons show an impressive capacity during the first cycle, followed by a dramatic reduction of such capacity in the 2nd and successive cycles. In recent work4 we have thoroughly analyzed using experimental and theoretical methods the reasons for such behavior. It was concluded that high surface area carbons have a large number of defects and exposed low-saturated (highly reactive) sites which contribute to develop a large irreversible capacity loss (ICL) and consequently to reducing the cell coulombic efficiency. Moreover, we demonstrated that the SEI layer reactions are affected not only by the largest surface area but also by the specific surface chemistry since highly reactive sites are able not only to irreversibly bind Li ions but also promote SEI reactions thus irreversibly capturing Li-containing SEI compounds that contribute to the ICL.

Among the variety of carbon allotropes, carbon nanotubes (CNTs) appear as promising materials for various applications including energy storage.5 Carbon nanotubes are synthesized using various techniques, the most popular is chemical vapor deposition (CVD) where a C-containing species (for example CO, acetylene, methane) is decomposed over a transition-metal catalyst at high temperatures (in the order of 1000 K) and moderate to high pressures.6 Depending on the temperature and pressure and on the type of catalyst/support and additives employed during the synthesis process, the synthesis can be tuned to obtain single-walled carbon nanotubes (SWCNTs), or other products such as double or multiple-walled CNTs or even carbon fibers.7 SWCNTs can grow in vertically aligned forests, horizontally patterned over substrates, or randomly arranged forming spaghetti bundles.8 The use of carbon nanotubes as anode materials in Li-ion batteries have been the subject of numerous theoretical and experimental studies.9–13 For applications in batteries, both forests or spaghetti patterns may offer good surface areas.14 Moreover the bundle density might be tuned to improve capacity and/or decrease reactivity.15 Previous reports have indicated that good storage capacities in SWCNT bundles may result from Li intercalation both inside and in the interstitial space between tubes10 especially after certain treatments such as chemically etching the nanotubes to short segments12 although these treatments may also originate capacity fading.13 Thus, a better understanding of the intercalation mechanisms may help addressing many issues related to the microscopic lithiation and reaction processes that are needed to tune the experimental design.

The goal of this work is to elucidate the Li intercalation capacity and SEI formation on an anode consisting of SWCNTs arranged in “spaghetti” configurations under the Li-ion battery operation conditions. Density functional theory (DFT) analysis consists of characterization of the maximum intercalation capacity of (a) infinite nanotube bundles composed of single (4,4) and (12,12) tubes of 0.56 and 1.62 nm diameters respectively; and (b) open finite nanotubes with unsaturated edges and edges terminated in H, O, and OH. The DFT results are compared with the experimental voltage–capacity curves in the 1st and 2nd cycle and with in situ Raman experimental observations. We are interested in distinguishing between the remnant charge transfer and SEI formation impacts on battery performance; i.e., the differences in capacity in the 1st and 2nd cycling and revealing the contribution of the SEI formation to ICL owed to the SWCNT configuration, assuming the tubes are perfect (no defects).

Computational methods and models

The initial structures were first relaxed using DFT calculations as implemented in the Vienna ab initio simulation package (VASP).16–19 For the Exchange–Correlation (EC) functional and core treatment, the Perdew–Burke–Ernzerhof functional (GGA-PBE)20 and projector augmented wave (PAW) pseudopotentials were used, respectively.21,22 The PBE is one of the widely used non-empirical GGA functionals, which combines the exact results for the exchange part of the functional with approximations of the correlation part. Meanwhile, the PAW method reproduces the effect of the core electrons on the valence electrons. The Grimme-D2 method23,24 was used to incorporate the van der Waals (vdW) interactions into the systems with a cutoff of 6 Å. For all simulations, we employed a plane-wave cutoff energy of 400 eV, at which the energies converge to approximately 0.01 meV. For the electronic minimization, the Davidson method25 is considered to be very reliable for the convergence of the wave function at the initial stage of iteration, which led to a convergence of the electronic relaxation in the order of 0.1 meV. Atomic positions were relaxed until the forces on each atom were smaller than 1 meV Å−1.

The k-point sampling in the irreducible Brillouin-zone (IBZ) integrations were automatically generated using the Monkhorst–Pack (MP)26 scheme. For item a, the k-points mesh of 1 × 1 × 9, whereas for items b and c, we used only one k-point at the Γ (gamma)-point. For item a, we used the Methfessel–Paxton smearing method26 with a broadening width of 0.2 eV. Similarly, for items b and c, the Gaussian smearing method27 with a broadening width of 0.2 eV was employed. The Bader method was used to perform charge calculations.28,29 Within this method, the total electronic charge of an atom is approximated by the charge enclosed within the Bader volume defined by zero flux surfaces.

Experimental methods

The experiments were done on an ECC-Opto-Std test cell (from EL-CELL GmbH) with ∼50 μm thick SWCNT film as the cathode and a 380 μm thick lithium metal foil as the anode. The surfactant-free SWCNT film, in the form of buckey paper, was composed of high purity randomly oriented spaghetti bundled nanotubes (IsoNanotubes-S95% from NanoIntegris). Note that no binder or conductive additive was used in the SWCNT electrode. 1 M LiPF6 dissolved in a 1[thin space (1/6-em)]:[thin space (1/6-em)]1 volume mixture of ethylene carbonate and diethyl carbonate (from BASF Co.) was used as the electrolyte. A 25 μm thick Celgard polypropylene was used as the separator. The battery test was carried out on a Solartron Multistat system at a constant current density of 50 mA g−1-carbon. In situ first-order Raman scattering was used to study the time evolution of Li intercalation into the same SWCNT electrode. The experiments were performed simultaneously with battery charge/discharge using a Renishaw inVia micro-Raman spectrometer with 632.8 nm laser excitation through a quartz optical window at room temperature. The laser spot was ∼1 μm with a 50× objective. The laser power was kept at ∼1 mW in order to avoid heating.

Results and discussion

Nanotube size effect on intercalation energies in SWCNT bundles

We determined the intercalation capacity of infinite length nanotube bundles at a fixed nanotube density (densities of 1.48 × 10¹⁴ tubes per cm2 for the (4,4) model and 2.99 × 10¹³ tubes per cm2 for the (12,12) model). The infinite length bundle is obtained via periodic boundary conditions in the 3 spatial dimensions (Fig. 1). Similarly to graphite, the separation between nanotubes is mediated by van der Waals (vdW) forces and Li intercalation is possible in the interstitial space between tubes. The SWCNT model in Fig. 1 depicts two sizes (diameters of 5.6 and 16.2 Å) studied to characterize nanotube size effects on SWCNT/Li interactions. The choice of the largest nanotube size was based on the experimental information, as discussed below. Cell shape and size were allowed to change in the simulation cell as the amount of Li atoms was raised.
image file: c5ra27225d-f1.tif
Fig. 1 Model used to investigate the intercalation in SWCNT bundles. Values of the indicated distances are in Å. The nanotube heights are given by three rows of hexagons. Gray spheres represent carbon atoms.

When the first Li atom is allowed to interact with 5.6 and 16.2 Å diameter SWCNTs at various sites, the optimized geometries leading to the strongest intercalation energies for each site are shown in Fig. 2. Intercalation energies are calculated according to the following equation:

 
Eint = ECNTnLi − (ECNT + nELi) (1)
where ECNTnLi is the energy of the nanotube system with nLi atoms, ECNT is the energy of the nanotube system without Li atoms and ELi is the energy of a Li atom in the Li bcc crystal.


image file: c5ra27225d-f2.tif
Fig. 2 Li intercalation sites. Left: (4,4) SWCNT; Right: (12,12) SWCNT. Main distances (in Å) and positions with respect to the closest SWCNTs are depicted. Nomenclature: middle of the hexagon (H), Li close to only one C atom (b1), Li close to two C atoms (b2). Purple spheres represent lithium atoms.

Table 1 shows the Li intercalation energy at each of the sites and the corresponding geometries are displayed in Fig. 2. In the small diameter (4,4) nanotube, the most favorable sites are those in which Li interacts with three SWCNTs (1Lia and 1Lib in Fig. 2); the same geometry is impossible in the larger diameter (12,12) SWCNT. However, comparing the two nanotube sizes, a stronger interaction is found for the larger diameter (Table 1). The small diameter tube yields relatively strong energies only when Li interacts with three nanotubes, whereas interacting with only two the intercalation energy is quite small (1Lic) or even repulsive (positive) (1Lie). The stronger intercalation energy for Li ions interacting with three SWCNTs is in agreement with previous reports.11 An alternative configuration (1Lid) tested in the small tube is not shown because after optimization it is found in the same geometry as 1Lic. On the other hand, in the (12,12) SWCNTs different initial geometries as well as changes in the nanotube–nanotube interaction result in geometries 1Lia and 1Lic as the most favorable sites; however all sites show favorable attractive interactions.

Table 1 Intercalation energy (eV) of the first Li atom for the small (4,4) and large diameter (12,12) SWCNTs. The sites for intercalation from 1Lia to 1Lie are depicted in Fig. 1
Configuration Nanotube
(4,4) (12,12)
1Lia −0.13 −0.53
1Lib −0.20 −0.33
1Lic −0.02 −0.46
1Lid −0.01 −0.37
1Lie +0.76 −0.23


The calculated total capacity in both tubes is obtained by sequentially adding nLi atoms and graphing the intercalation energy (calculated according to eqn (1)) vs. the amount (x) of Li in LixC6 as shown in Fig. 3. The maximum capacity for each tube diameter is the value where the intercalation energy yields its strongest (most negative) value. Fig. 3 shows that the calculated capacity for nanotubes is lower than that found in graphite,4 and the highest intercalation energy is found at concentration values of about x = 0.5 in LixC6 for nanotube (4,4) and x = 0.32 for the (12,12) tube. Final intercalation geometries for each tube are depicted in Fig. S1 and S2 of ESI.


image file: c5ra27225d-f3.tif
Fig. 3 Intercalation energy as function of the concentration x in LixC6 for (a) (4,4) and (b) (12,12) SWCNTs.

Effect of SWCNT edge functionalization

In our previous work we demonstrated via DFT analyses that functionalizing the carbon edges resulted in a reduction of the ICL. Here the open surface effect was simulated by allowing interaction of Li with low-coordinated unsaturated nanotube edges (Fig. S3–S5), and by edges terminated with H atoms (Fig. S6). For nanotubes with unsaturated sites at the edges, the intercalation energies and geometries reported in Fig. S4 and S5 show that interstitial sites are preferred. The intercalation energy for edges terminated by H atoms is reported in Table 2, with edge sites named h-I for intercalation inside and h-O for intercalation outside of the nanotube (Fig. S6). In open tubes, intercalation at the external wall of the nanotube (S site in Table 2) leads to a positive (unfavorable) intercalation energy value, with almost identical values for (4,4) and (12,12) nanotubes. Intercalation energy in H-terminated edges is enhanced in the outside owed to the presence of the hydrogen terminations (Table 2). On the other hand, Li intercalation inside of the nanotube is weaker and only possible in the (4,4) SWCNT while it is forbidden in the (12,12) SWCNT (Fig. S6). Weaker intercalations inside the nanotubes compared to those outside were also reported by Zhao et al.10
Table 2 Model of SWCNT bundles with high surface area. S represents intercalation sites on the external wall of the SWCNT; h-I and h-O are sites with Li intercalation inside or outside the nanotube respectively
Sites Models
(4,4) (12,12)
S +0.26 +0.25
h-I −0.36 +0.24
h-O −0.77 −0.50


Other reports30 suggested that the interaction of Li with graphene layers is weaker than the interaction between Li atoms in Li metal. Therefore, we can infer that for individual SWCNTs in which the interaction with other SWCNTs is lower than 6 (hexagonal arrangement) the intercalation capacity will be even weaker. For the same reason, if the nanotubes are arranged in spaghetti configuration, only the sites in which the nanotubes interact with other nanotubes will lead to reversible Li intercalation. Fig. 4 shows the intercalation capacities in open nanotubes terminated with H. The calculated values show a maximum value of x = 0.083 (in LixC6) for the open (12,12) nanotube, and a value between 0.25 and 0.5 for the open (4,4) nanotube.


image file: c5ra27225d-f4.tif
Fig. 4 Li intercalation capacity of (a) (12,12) and (b) (4,4) SWCNT surfaces interacting in a high surface area bundle.

Discussion in relation to the experimental results

Fig. 5a shows the SWCNT storage capacity during the first 5 cycles. In the first cycle, the nanotube electrode displays a high capacity of the order of 1800 mA h g−1 (∼4.8 times the theoretical capacity of graphite corresponding to LiC6) that is dramatically reduced to ∼280 mA h g−1 (∼Li0.75C6) in the 2nd cycle and keeps becoming smaller in successive cycles (∼Li0.46C6 in the 5th cycle). The high storage capacity found in the first cycle can be explained by the intercalation of Li in a high surface area carbon which in the case of the nanotube bundle may include open edges and defects.4 As previously shown, high surface area carbons are able to irreversibly store a significant amount of Li in sites that cannot be further occupied in successive cycles.4 Interestingly, the DFT results show an extremely low capacity of the SWCNTs. For example, Fig. 3 shows a maximum capacity of Li0.5C6 for the (4,4) nanotube and even lower capacity for the (12,12). Given the simplicity of the model that ignores interconnections existent in a spaghetti bundle as well as the size distribution of tube diameters, the agreement of the calculated capacities (Fig. 3) with those observed in the 2nd and successive cycles (Fig. 5) is quite good. Thus, the excess capacity detected in the first cycle should be due to the presence of sites that are able to irreversible capture Li, such as surface defects and unsaturated carbon sites. It is interesting that our high surface area model where nanotube open edges are saturated with H atoms yielded similar and only slightly lower capacities (Fig. 4) than the low-surface area model (Fig. 3) suggesting that the main irreversibilities in nanotube bundles are less associated with unsaturated sites than could be with other surface roughness or surface defects. In addition, the first cycle involves the formation of a solid–electrolyte interphase (SEI) layer due to electrochemical reduction of the electrolyte (solvent and salt). As discussed in our previous study,4 the huge irreversible capacity in high surface area carbons is due not only to the presence of unsaturated carbon atoms at edges but also to the incorporation of a significant amount of Li ions into the formation of the SEI layer. Our assumption is strongly supported by the long plateau at ∼0.9 V in the first Li lithiation cycle (Fig. 5a), a feature commonly observed in other carbon materials used in Li ion batteries.31–33 Fig. 5b illustrates that while the capacity reduces dramatically from the 1st to the 2nd cycle, the coulombic efficiency increases upon cycling, again suggesting that most of the irreversibilities are due to interfacial phenomena taking place during the 1st cycle.
image file: c5ra27225d-f5.tif
Fig. 5 (a) Voltage vs. capacity of the SWCNT electrode during the first 5 cycles of battery charge/discharge. The red line corresponds to the first discharge. (b) Capacity (left) and coulombic efficiency (right) vs. cycle index of the SWCNT electrode.

Fig. 6 shows the low-frequency radial breathing mode (RBM) and the high frequency G-band (∼1590 cm−1) regions upon the 1st lithiation cycle. The RBM is unique to SWCNTs. The G-band is closely related to the E22g intralayer Raman-active vibration modes in graphite. Both RBM and G-band had been widely used to probe the charge transfer between the intercalated Li and the nanotubes.33–36 An initial RBM frequency of 161.9 cm−1 indicates that the nanotubes used in the current study have an average diameter of ∼1.5 nm using the expression ωRBM = 218.3/d + 15.9.37 Fig. 6 shows that both RBM and G-band gradually reduce intensity and eventually disappear as the SEI layer forms. The main RBM peak was observed to have a 7.6 cm−1 up shift before its disappearance, while the G-band primarily decreased intensity in the same period. Further lithiation of the electrode further depressed the G-band intensity and up shifted its frequency by 5.7 cm−1 before it finally disappeared. Small shifts of the RBM and G-band suggest that the force constant for the C–C bonds changes with Li intercalation. Generally speaking an upshift (downshift) is taken as evidence for a sp2 C–C bond contraction (expansion). Our experiment suggests that the C–C bond initially contracts with Li intercalation. The decrease of intensities for both Raman features can be attributed to the gradual loss of resonance conditions through the modified optical transitions upon Li intercalation, followed by the formation of an SEI thin film. Furthermore, a greatly reduced optical skin depth due to the increased electrical conductivity of the electrode associated with Li intercalation may also contribute to the final loss of Raman intensity. Those observations are quite consistent with what had been observed in the literature on in situ Raman studies with both SWCNT35,36 and double-walled carbon nanotube33,34 intercalated systems. In summary, experimental analyses from Fig. 6 clearly proves Li intercalation and SEI formation, whereas Fig. 5, in agreement with the DFT results shows that the actual extent of reversible intercalation is much more limited than that in graphite or amorphous carbons, and that the excess capacity observed during the first cycle should be attributed to irreversible Li lost during SEI formation and trapped in highly active unsaturated and defective sites. The calculated capacity represents the actual capacity of the nanotubes without considering edge or defect effects. At the first cycle, the edge and defect sites are partially responsible of the increase of this capacity to extraordinarily high values (Fig. 5 and 6) precisely due to the existence of edge and defect sites that bind Li irreversibly. In addition, the experimental high capacity observed in the first cycle reflects a significant amount of Li that is also irreversibly lost due to binding to electrolyte decomposition products forming the SEI layer. After the first cycle, the capacity drops significantly as revealed by the experimental results shown in Fig. 5. Such low capacity observed in the 2nd cycle and beyond agrees fairly well with the calculated results. We note that the DFT results of Fig. 3 and 4 are done at 0 K. However, the intercalation energies do not change significantly with temperature, thus the intercalation energies and voltages are fair representations of the expected behavior under battery operation, as shown by the described agreement between experiments and calculations.


image file: c5ra27225d-f6.tif
Fig. 6 (a) Voltage vs. capacity during the first lithium lithiation cycle. Red dots indicate where the in situ Raman spectra were taken. (b and c) In situ Raman evolution of the SWCNT electrode during the first lithium lithiation cycle (top to bottom: voltage drops from 3 to 0 V).

Conclusions

Lithium storage in bundles of SWCNTs is systematically investigated with first-principles computations, spectroscopy, and electrochemical techniques. DFT analysis of the intercalation in infinitely long SWCNTs arranged in bundles is studied for a small tube of 5.6 Å diameter and for a larger diameter of 16.2 Å which emulates the experimental size. It is found that Li may be stored in the interstitial sites between two or three nanotubes, with the small diameter tube yielding relatively strong energies only when Li interacts with three nanotubes whereas the larger tube may favorably store Li with comparable energies in all available interstitial sites. The calculated capacities are lower than those obtained in graphite, resulting in x = 0.5 for the smaller tube and x = 0.32 for the larger tube both with reference to LixC6. The calculated capacity is even smaller for the nanotubes with higher surface area, modeled by open tubes with dangling bonds or with edges saturated with H atoms. The calculated values show a maximum value of x = 0.083 (in LixC6) for the larger nanotube, and a value between 0.25 and 0.5 for the smaller one. Interestingly, these extremely low capacity values agree with those found in the electrochemical experiments. Although the capacity shown in the first cycle reaches a value of ∼1800 mA h g−1, thus greatly exceeding that of graphite, it becomes dramatically reduced to 280 mA h g−1 in the 2nd cycle and continues slightly decreasing in the successive cycles up to the 5th. The corresponding coulombic efficiency is very low (less than 10%) in the first cycle and then slowly recovers reaching ∼90% in the 30th cycle and keeping constant afterwards. The excess capacity stored in the first charge is attributed to the presence of sites that are able to irreversible capture Li, such as surface defects and unsaturated carbon sites, and to the formation of a solid–electrolyte interphase which also irreversibly traps a substantial amount of Li ions. Both Li intercalation and SEI formation are captured by the features observed in the Raman spectroscopy analyses. In summary, although the high surface area offered by SWCNTs arranged in spaghetti configurations may store a substantial amount of Li, it does so in an irreversible manner and the actual capacity of the nanotube bundle detected after the 2nd cycle is inferior to that of graphite.

Acknowledgements

Supercomputer resources from Texas A&M Supercomputer Center, Texas Advanced Computing Center (TACC), and Texas A&M University Brazos High Performance Cluster are gratefully acknowledged. These studies have been supported by Honda Research Institute USA Inc.

References

  1. K. Sato, M. Noguchi, A. Demachi, N. Oki and M. Endo, Science, 1994, 264, 556–558 CAS.
  2. Y. Matsumura, S. Wang and J. Mondori, Carbon, 1995, 33, 1457–1462 CrossRef CAS.
  3. P. Verma, T. Sasaki and P. Novak, Electrochim. Acta, 2012, 82, 233–242 CrossRef CAS.
  4. K. Omichi, G. Ramos-Sanchez, R. Rao, N. Pierce, G. Chen, P. B. Balbuena and A. R. Harutyunyan, J. Electrochem. Soc., 2015, 162, A2106–A2115 CrossRef CAS.
  5. S. Bose, T. Kuila, A. K. Mishra, R. Rajasekar, N. H. Kim and J. H. Lee, J. Mater. Chem., 2012, 22, 767–784 RSC.
  6. M. S. Dresselhaus and P. Avouris, Carbon Nanotubes: Synthesis, Structure, Properties and Applications, Springer, Berlin, 2001 Search PubMed.
  7. J. Gavillet, A. Loiseau, F. Ducastelle, S. Thair, P. Bernier, O. Stephan, J. Thibault and J. C. Charlier, Carbon, 2002, 40, 1649–1663 CrossRef CAS.
  8. N. Geblinger, A. Ismach and E. Joselevich, Nat. Nanotechnol., 2008, 3, 195–200 CrossRef CAS PubMed.
  9. Z. Xiong, Y. S. Yun and H. J. Jin, Materials, 2013, 6, 1138–1158 CrossRef CAS.
  10. J. Zhao, A. Buldum, J. Han and J. P. Lu, Phys. Rev. Lett., 2000, 85, 1706–1709 CrossRef CAS PubMed.
  11. B. Song, J. W. Yang, J. J. Zhao and H. P. Fang, Energy Environ. Sci., 2011, 4, 1379–1384 CAS.
  12. H. Shimoda, B. Gao, X. P. Tang, A. Kleinhammes, L. Fleming, Y. Wu and O. Zhou, Phys. Rev. Lett., 2002, 88, 4 Search PubMed.
  13. L. A. Montoro, E. Y. Matsubara and J. M. Rosolen, J. Power Sources, 2014, 257, 205–212 CrossRef CAS.
  14. L. D. Machado, S. B. Legoas, J. S. Soares, N. Shadmi, A. Jorio, E. Joselevich and D. S. Galvao, Phys. Rev. Lett., 2013, 110, 105502 CrossRef CAS PubMed.
  15. R. A. Dileo, A. Castiglia, M. J. Ganter, R. E. Rogers, C. D. Cress, R. P. Raffaelle and B. J. Landi, ACS Nano, 2010, 4, 6121–6131 CrossRef CAS PubMed.
  16. G. Kresse and J. Furthmüller, Phys. Rev. B: Condens. Matter Mater. Phys., 1996, 54, 11169–11186 CrossRef CAS.
  17. G. Kresse and J. Furthmuller, Comput. Mater. Sci., 1996, 6, 15–50 CrossRef CAS.
  18. G. Kresse and J. Hafner, Phys. Rev. B: Condens. Matter Mater. Phys., 1993, 47, 558–561 CrossRef CAS.
  19. G. Kresse and J. Hafner, Phys. Rev. B: Condens. Matter Mater. Phys., 1994, 49, 14251–14269 CrossRef CAS.
  20. J. P. Perdew, K. Burke and M. Ernzerhof, Phys. Rev. Lett., 1996, 77, 3865–3868 CrossRef CAS PubMed.
  21. P. E. Blöchl, Phys. Rev. B: Condens. Matter Mater. Phys., 1994, 50, 17953–17979 CrossRef.
  22. G. Kresse and D. Joubert, Phys. Rev. B: Condens. Matter Mater. Phys., 1999, 59, 1758–1775 CrossRef CAS.
  23. X. Wu, M. C. Vargas, S. Nayak, V. Lotrich and G. Scoles, J. Chem. Phys., 2001, 115, 8748–8757 CrossRef CAS.
  24. S. Grimme, J. Comput. Chem., 2006, 27, 1787–1799 CrossRef CAS PubMed.
  25. C. G. Broyden, Math. Comput., 1965, 577–593 CrossRef.
  26. H. J. Monkhorst and J. D. Pack, Phys. Rev. B: Condens. Matter Mater. Phys., 1976, 13, 5188–5192 CrossRef.
  27. A. De Vita, M. J. Gillan, J. S. Lin, M. C. Payne, I. Štich and L. J. Clarke, Phys. Rev. B: Condens. Matter Mater. Phys., 1992, 46, 12964–12973 CrossRef CAS.
  28. L. El Ouatani, R. Dedryvère, C. Siret, P. Biensan and D. Gonbeau, J. Electrochem. Soc., 2009, 156, A468–A477 CrossRef CAS.
  29. H. Ota, Y. Sakata, A. Inoue and S. Yamaguchi, J. Electrochem. Soc., 2004, 151, A1659–A1669 CrossRef CAS.
  30. Y. Y. Liu, V. I. Artyukhov, M. J. Liu, A. R. Harutyunyan and B. I. Yakobson, J. Phys. Chem. Lett., 2013, 4, 1737–1742 CrossRef CAS PubMed.
  31. T. Zheng and J. Dahn, Carbon Materials for Advanced TechnologiesPergamon, Oxford, 1999 Search PubMed.
  32. M. Endo, C. Kim, K. Nishimura, T. Fujino and K. Miyashita, Carbon, 2000, 38, 183–197 CrossRef CAS.
  33. Y. A. Kim, M. Kojima, H. Muramatsu, S. Umemoto, T. Watanabe, K. Yoshida, K. Sato, T. Ikeda, T. Hayashi, M. Endo, M. Terrones and M. S. Dresselhaus, Small, 2006, 2, 667–676 CrossRef CAS PubMed.
  34. G. Chen, S. Bandow, E. R. Margine, C. Nisoli, A. N. Kolmogorov, V. H. Crespi, R. Gupta, G. U. Sumanasekera, S. Iijima and P. C. Eklund, Phys. Rev. Lett., 2003, 90, 257403 CrossRef PubMed.
  35. A. Claye, S. Rahman, J. E. Fischer, A. Sirenko, G. U. Sumanasekera and P. C. Eklund, Chem. Phys. Lett., 2001, 333, 16–22 CrossRef CAS.
  36. G. Chen, C. A. Furtado, S. Bandow, S. Iijima and P. C. Eklund, Phys. Rev. B: Condens. Matter Mater. Phys., 2005, 71, 045408 CrossRef.
  37. M. Endo, H. Muramatsu, T. Hayashi, Y. A. Kim, M. Terrones and N. S. Dresselhaus, Nature, 2005, 433, 476 CrossRef CAS PubMed.

Footnote

Electronic supplementary information (ESI) available. See DOI: 10.1039/c5ra27225d

This journal is © The Royal Society of Chemistry 2016