DOI:
10.1039/C5RA27219J
(Paper)
RSC Adv., 2016,
6, 22500-22510
Galvanic replacement of electrodeposited nickel by palladium and investigation of the electrocatalytic activity of synthesized Pd/(Ni) for hydrogen evolution and formic acid oxidation†
Received
19th December 2015
, Accepted 1st February 2016
First published on 2nd February 2016
Abstract
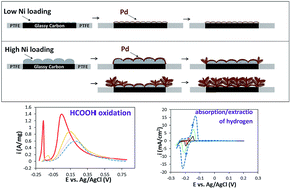
A series of controllable Pd/(Ni) catalysts were synthesized by the use of galvanic replacement between electrodeposited nickel and palladium in [PdCl4]2− containing solution. The mechanisms of galvanic replacement were investigated by monitoring the potential variations versus time, field emission scanning electron microscopy (FESEM), and energy dispersive X-ray spectroscopy (EDS). The electrocatalytic activities of the prepared catalysts were evaluated by linear sweep voltammetry for the hydrogen evolution reaction (HER) in 0.5 M H2SO4 and formic acid oxidation in 0.5 M H2SO4 + 0.5 M HCOOH. In addition, the effect of the Ni loading amount on the final morphology, chemical composition and electrocatalytic activity of the galvanically replaced Pd/(Ni) catalysts was studied. The results indicated that the morphology of the Pd/(Ni) changes from thin film to nano/micro dendrite depending on the amounts of electrodeposited Ni loading. The sharp and relatively symmetric peaks that were observed in the voltammograms indicated the reversibility of electrochemical hydrogen absorption/extraction. The same Tafel slopes estimated for all Pd/(Ni) suggested the predomination of Volmer–Heyrovsky mechanisms in catalyzing the hydrogen evolution reaction. In addition, the Pd/(Ni) thin film catalyst exhibited superior electrocatalytic mass activity towards the oxidation of formic acid (1.39 A mg−1 at the peak potential). Moreover, comparison of the Pd/(Ni) thin film activity with some other palladium-based catalysts in some recent studies with relatively good results showed that the galvanically replaced Pd/(Ni) thin film has great potential as a fast, easily prepared, and active electrocatalyst for formic acid oxidation.
1. Introduction
In recent years the palladium-based micro/nanostructures have been extensively prepared and studied because of their interesting electrocatalytic properties for various applications such as biosensors,1 surface-enhanced Raman scattering,2–4 hydrogen production5,6 and fuel cell electrocatalysts.2,7–14 For instance, there are several reports on the synthesis of pure15 and bimetallic Pd–M (M: Pt, Ag, Co, Cu, Fe) nanoparticles to promote the oxygen reduction reaction.14,16,17 The Pd-based dendritic,4,7,9,18 nano-thorn-like shaped,12 core–shell19 and hollow20 structures were studied with respect to their activity for the formic acid oxidation.
In order to maximize the catalytic activity and concurrently facilitate the synthesis process of electrocatalysts, numerous routes have been examined through several investigations.19–21 Recently, attentions have been focused on the fabrication of nanostructured surfaces without additives or surfactants because of the problems related to the removal of excess chemical precursors.2 One of the most influential and at the same time facile routes to synthesize well defined structures (particularly noble metal based structures) is galvanic replacement. The method has been extensively used for the synthesis of dendritic nanostructures,9,22–24 noble-metal nanotubes,25 core–shell nanoparticles,26,27 noble metal monolayers28 and hollow nanoparticles.20,29 In the case of Pd, there are some reports on the replacement of various Ag structures (such as wires, nanoparticle, triangular nano-plates and dendrites templates) by palladium in Pd ions containing solutions.30,31 However, the literature survey indicates that there are only a few reports on the galvanic replacement of nickel by Pd (i.e. Pd/(Ni)), and consequently the mechanisms of redox reactions occurred during replacement of Ni by Pd and electrocatalytical activity of resulted structures have not been justified.20
In the present work, a various Pd/(Ni) catalysts were synthesized through galvanic replacement of electrodeposited nickel by palladium in additive-free [PdCl4]2− solution. In addition, we attempted to assess the mechanisms of galvanic replacement of electrodeposited Ni (with various loadings) by Pd. In this regard, the galvanic replacement mechanisms were studied through open circuit potential–time measurements, microscopic observations, and EDS analysis. The reversibility of hydrogen absorption/extraction, hydrogen evolution reaction and formic acid oxidation are also evaluated as electrocatalytic properties of the prepared Pd/(Ni) catalysts.
2. Experimental
2.1. Chemicals
Palladium chloride (PdCl2) was obtained from Sigma-Aldrich Co. Nickel sulfate (NiSO4·5H2O), ammonium chloride (NH4Cl), boric acid (H3BO3), formic acid (HCOOH, 88%) and sulfuric acid (H2SO4, 98%) were purchased from Merck. All the chemicals were of analytical grade and were used as received. Glassy carbon (GC) electrodes (2 mm diameter) were employed as substrate for the working electrodes.
2.2. Synthesis of the electrocatalysts
GC electrodes were polished carefully with 0.1 μm alumina polish finishing and rinsed with double distilled water. Sacrificial Ni templates were prepared on GC substrates using a constant potential electrodeposition method. All electrochemical experiments were conducted in a conventional three-electrode electrochemical cell using a potentiostat/galvanostat Autolab® model PGSTAT 30 equipped by Nova 1.6 software. A platinum plate and a set of Ag/AgCl electrode (E = 0.198 V vs. SHE) were used as the counter and reference electrodes, respectively. A step potential of −1.4 V was applied for various durations in a deaerated solution of 100 mM NiSO4 + 500 mM H3BO3 (pH = 4.1) without any agitation. The solution temperature was fixed at 45 ± 0.1 °C.32 The resulted current–time transients were recorded to estimate the amount of Ni loading in each deposition process. The prepared Ni electrodes were transferred into deaerated solution of 5 mM PdCl2 + 100 mM NH4Cl (pH = 2.6). To avoid the thermal stress between the galvanic replacement solution and electrodeposited nickel electrode, the temperature of replacement solution was maintained at the temperature of Ni deposition bath (45 ± 0.1 °C). Moreover, the sample transfer was performed immediately in order to avoid oxidation of Ni substrate. The electrochemical reaction occurring on the electrode surface during galvanic replacement is: |
Ni/GC + [PdCl4]2− → Pd/(Ni)/GC + Ni2+ + 4Cl−
| (1) |
In order to monitor the proceeding of the replacement reactions, the open circuit potential (OCP) of the electrodes was recorded by means of chronopotentiometric procedure. After accomplishment of galvanic replacement reactions, the electrodes were washed with double distilled water.
2.3. Physical analysis
The morphology and composition of the Ni deposits and galvanically replaced Pd/(Ni) catalysts were characterized by FESEM using a MIRA3-TESCAN apparatus equipped with an energy dispersive X-ray spectrometer (EDS) at a voltage of 15 kV with a spot size of 100 nm.
2.4. Electrocatalytic characterizations
In order to examine the catalytic behavior of the synthesized catalysts for the electrochemical absorption/extraction and evolution of hydrogen as well as formic acid oxidation, linear sweep voltammetry were employed in two solutions of: (A) 0.5 M sulfuric acid and (B) 0.5 M formic acid + 0.5 M sulfuric acid. The electrolyte solution was purged thoroughly with pure nitrogen prior to each experiment to remove any dissolved oxygen.
3. Results and discussion
3.1. Electrodeposition of sacrificial Ni template
Fig. 1A shows the chronoamperometric curve of Ni electrodeposition on a GC surface. The corresponding total electrical charge density (Q) is also depicted in right axis. By controlling the amount of Q, various Ni templates were prepared (identified by the amounts of Q). Fig. 1B shows the typical FESEM image of electrodeposited Ni surface with 90 mC cm−2 deposition charges. It can be seen that the GC substrate is covered with ∼30–40 nm Ni nanoparticles.
 |
| Fig. 1 (A) Current–time transient and corresponding transferred charge during electrodeposition of Ni onto a GC electrode at potential of −1.4 V vs. Ag/AgCl, (B) typical FESEM image of the resulted Ni (Q = 90 mC cm−2). | |
3.2. Potential monitoring during galvanic replacement
The open circuit potential (OCP) can be ascribed to the characteristics of the anodic and cathodic surface sites reactivity and any change in the measured OCP can be attributed to the electrode/solution interface variation.33 In order to evaluate the OCP variation in a galvanic replacement experiment, a diagnostic (not to produce a catalyst) test was performed as follows. A freshly synthesized Ni/GC electrode (Ni deposition charge = 300 mC cm−2) was immersed in 10 ml of NH4Cl (100 mM) electrolyte at 45 °C and the OCP was recorded through a zero current chronopotentiometric procedure. After few seconds, 10 ml of preheated [PdCl4]2− solution (NH4Cl/100 mM + [PdCl4]2−/10 mM) was added to the initial electrolyte and the variation of OCP was record. Fig. 2 shows the chronopotentiogram obtained before and during galvanic replacement. As seen, the OCP of Ni template in the NH4Cl solution is about −0.31 V. This value increases abruptly to −0.05 V when the [PdCl4]2− solution was added, decreases again to about −0.25 V with a somewhat lower rate. The quick potential increase attributes to the rapid presence of a large number of [PdCl4]2− ions near the Ni substrate with newly developed Pd nuclei. According to the general models of mixed potential,33 the potential increase (anodic shift) would result in the Ni dissolution rate accelerating; which provides more accessible electrons on the electrode, encouraging the most of the near surface Pd ions to be deposited. Depletion of Pd ions leads to a concentric diffusion field34 formed near the surface and according to the Nernst equation,35 the OCP declines to a value controlled by Pd ions diffusion (region I in Fig. 2).
 |
| Fig. 2 Open-circuit potential versus time of Ni/GC electrode before (in NH4Cl/100 mM) and during galvanic replacement (in NH4Cl/100 mM + [PdCl4]2−/5 mM). | |
Growth of Pd sites changes the cathodic to anodic surface area ratio and OCP increases again (region II in Fig. 2). Galvanic replacement takes place until any anodic site is available and the reaction terminates as all anodic Ni sites are dissolved and/or blocked. OCP ascends gradually to the steady-state value of 0.48 V which is the equilibrium potential of pure Pd in a similar solution (region III in Fig. 2). It implies that the final surface is composed almost entirely of Pd atoms. The chemical composition of the electrode surface before and after various time of galvanic replacement, obtained by EDS analysis, are listed in Table 1 and their corresponding relative percentage plotted in Fig. 3. It confirmed that only negligible Ni atoms are remained in the final structure at the time corresponding to the region III in Fig. 2. Therefore the OCP–time monitoring is a useful criterion for estimating the termination time of galvanic replacement. Fig. 4 shows the OCP–time curves obtained during galvanic replacement of three samples with different Ni loading amounts. According to the curves, the required time for completing the replacement process was depended on the amount of Ni loading.
Table 1 Results of EDS analysis for Pd and Ni before and during galvanic replacement of Ni (300 mC cm−2) by Pd
Element |
EDS line |
Atomic% |
Before Repl. |
20 s |
120 s |
360 s |
C (substrate) |
Ka |
61.57 |
62.40 |
72.73 |
86.83 |
Ni |
Ka |
38.43 |
33.04 |
16.54 |
0.66 |
Pd |
La |
— |
4.55 |
10.37 |
12.51 |
Total |
|
100 |
100 |
100 |
100 |
 |
| Fig. 3 Relative atomic percentage variation of Pd and Ni during galvanic replacement between Pd and Ni (300 mC cm−2). | |
 |
| Fig. 4 Open-circuit potential versus time during galvanic replacement of three sacrificial Ni with different loading amounts in NH4Cl/100 mM + [PdCl4]2−/5 mM. | |
3.3. Physical analysis of Pd/(Ni)
Fig. 5 shows the FESEM images of obtained Pd/(Ni) structures from various sacrificed Ni templates. It is seen that the final structure is influenced by the amount of the initial Ni loading. A nearly uniform thin film morphology of densely packed Pd grains formed when the loading charge of sacrificial Ni is 30 mC cm−2 (Fig. 5A). The Ni atoms were oxidized and dissolved into the solution while the [PdCl4]2− ions were reduced and deposited onto the outer surface of the Ni nanoparticles. Therefore, the final morphology is somewhat similar to the initial texture of the sacrificed Ni. As the loading amount of Ni increased, the Pd nanocrystals progressively grew and dendrite kernels with dimension of less than 50 nm were formed (Fig. 5B). Also a portion of the dendrite kernels propagated and constructed the dendritic networks in the micrometer scale (Fig. 5C). Further increasing the amount of Ni loading resulted in complete coverage of surface with irregularly shaped Pd dendrites (Fig. 5D). Therefore, a variety of Pd structures from nano-grains thin film (non-dendritic) to completely dendritic deposits can be produced by adjusting the amount of Ni loading, using galvanic replacement process.
 |
| Fig. 5 FESEM images of Pd nanostructures grown after galvanic replacement of different values of sacrificial Ni loading: (A) 30, (B) 60, (C) 300 and (D) 900 mC cm−2. | |
Table 2 indicates surface chemical composition of the Pd/(Ni) samples. In the case of low amounts of sacrificial Ni loading, the Pd forms a thin film on the surface and blocks almost all of the Ni dissolution sites. Further replacement requires the diffusion of Ni through deposited Pd. Therefore, a low amount of Ni (0.05 and 0.11%) can be remained under the deposited Pd film. In the samples with Ni loading amounts of 300 and 575 mC cm−2 (fractional dendritic structures), diffusion-controlled growth of Pd leads to formation of a porous morphology which facilitates the further Ni dissolution. Hence, the finally remained Ni atoms under the final Pd dendrites are less than the detection limit of EDS analysis. The pores between the dendrites allow the Ni to be dissolved until the complete surface coverage by Pd dendrites. In the latest sample (Ni loading = 900 mC cm−2), the pores were blocked due to surface coverage by Pd dendrites. The blocking action of overcrowded dendrites probably leads to higher amounts of unreacted Ni atoms (0.41%).30
Table 2 The composition of Pd/(Ni)/GC surfaces with different Ni loading amounts, obtained by EDS analysis
Element |
Line in EDS spectra |
Atomic% |
30 mC cm−2 |
60 mC cm−2 |
300 mC cm−2 |
575 mC cm−2 |
900 mC cm−2 |
C (substrate) |
Ka |
99.39 |
97.56 |
87.64 |
64.39 |
46.95 |
Ni |
Ka |
0.05 |
0.11 |
0.00 |
0.00 |
0.41 |
Pd |
La |
0.56 |
2.33 |
12.36 |
35.61 |
52.64 |
Total |
|
100 |
100 |
100 |
100 |
100 |
In order to study the formation steps of Pd dendrites, two samples with the same amount of Ni loading (300 mC cm−2) were prepared and immersed in the replacement solution for two periods of 15 and 300 s, corresponding to the initial and final stages of galvanic replacement, shown in Fig. 6A and C, respectively. Once the Ni layer is exposed to the [PdCl4]2− solution, the Ni atoms with higher energy tend to dissolve earlier; accordingly a nano-pore morphology is generated in the early stages of galvanic replacement (Fig. 6A). Pd dendrites would preferentially form on the edge and also on probable Ni layer cracks. It is well-known that the electrons accumulation on the edge (and cracks) leads to the higher rate of Pd reduction which quickly results in a concentric diffusion field near the edges. The phenomenon is called the edge effect.36–38 The more rapid depletion of palladium ions along the edge of the Ni film results in the initiation of dendritic growth of Pd around the edge. The accumulation of Pd deposits on the edge of 15 s sample was confirmed using EDS elemental mapping as shown in Fig. 6B.
 |
| Fig. 6 (A) FESEM image of edge of Pd/(Ni) (Ni: 300 mC cm−2) electrode at the early stages of formation of dendrites (reaction time: 15 s), (B) the corresponding Pd elemental mapping for (A). (C) FESEM image of the sample with the same Ni loading value after 300 s replacement. | |
When the reaction time was prolonged to 300 s, large-scale dendritic nanostructure arrays formed as the final product (Fig. 6C). On the other hand, when the Ni loading is high enough, the depletion of Pd ions was occurred throughout the electrode surface. It leads to the diffusion-controlled dendritic growth of Pd as seen in Fig. 5D.
According to the FESEM studies mentioned above, two probable routes of replacement process on Ni substrates are: (i) in the case of extremely low Ni loading amount, because of the rapid termination of galvanic replacement process, the consumption value and therefore depletion of Pd ions diminishes; i.e. the driving force for the dendritic growth is reduced. Thus, a relatively smooth film of Pd was formed; (ii) for high Ni loading amounts, a few dendrites were formed on the edges in the early stages, the non-equilibrium condition at the growth interface provides a driving force for the dendritic growth of Pd39 therefore the surface is covered with relatively large dendrites in the final stages.
3.4. Electrocatalytic properties
3.4.1. Cyclic voltammetry in 0.5 M H2SO4. Four Pd/(Ni) catalysts were prepared by galvanic replacement using different amounts of initial Ni loading: (1) 30, (2) 60, (3) 200 and (4) 575 mC cm−2. In each case, the replacement process continued until the potential ascended to about 0.48 V (steady state condition). Fig. 7 shows the cyclic voltammograms of the catalysts in 0.5 M H2SO4 solution at a scan rate of 50 mV s−1. The results show the typical hydrogen and oxygen adsorption/desorption characteristics of metallic Pd20,40 with somewhat identical peak positions. It is generally accepted that the oxidation peaks at ca. 0.7 V and 0.85 V (a and b) result from the adsorption of oxygen atom precursors (OH and/or O) and the reduction peak at ca. 0.55 V (c) corresponds to the stripping of oxygenated species adsorbed on the Pd surface during the forward scan.41 Three reduction peaks at ca. +0.01 V (d), −0.05 V (e) and −0.12 V (f) are assigned to the under-potential deposition of hydrogen (HUPD) on different lattice planes.42 Also, a tail (g) is observed in further negative potentials due to the beginning of “massive absorption” of hydrogen in the lattice of the catalyst. The oxidation peak (h) corresponds to the extraction of absorbed hydrogen from the bulk Pd.41 Finally, the successive three peaks at −0.07 V (i), 0.0 V (j) and +0.02 V (k) are related to desorption of under-potentially deposited hydrogen from the Pd surface. It can be seen that the peaks become more identifiable for higher Pd loading amounts due to the superior growth of some specific planes which have different adsorption and desorption tendencies and leads to the sharper and more distinguished peaks.42
 |
| Fig. 7 Cyclic voltammograms of Pd(Ni)/GC in 0.5 M H2SO4 solution with a scan rate of 50 mV s−1 with different values of sacrificial Ni loading: (1) 30, (2) 60, (3) 200 and (4) 575 mC cm−2. | |
The electrochemical active surface area (ECSA) values of the catalysts were evaluated by eqn (2) and (3) using the integration of voltammograms under the reduction peak of chemisorbed oxygen (peak (c) in Fig. 7) based on the fact that the charge of a monolayer of adsorbed oxygen for a smooth Pd electrode is 420 μC cm−2.6
|
 | (2) |
|
 | (3) |
In these equations QOstripping (μC cm−2) is the transferred charge corresponding to the reduction of chemisorbed oxygen, Qdl is the double layer charge and WPd is the Pd loading amount. The amounts of Pd loading were calculated based on Faraday's law assuming 100% Ni deposition current efficiency and using the relative atomic percentage from EDS analysis.43
Similar calculations were repeated for all samples by integration of the under-potential deposition of hydrogen region area in all voltammograms (within −0.14 and +0.07 V vs. Ag/AgCl with respect to the peaks of d, e and f) and double-layer correction and assuming a value of 210 mC cm−2 for the adsorption of a hydrogen monolayer.44 The results are listed in Table 3. All samples revealed relatively high ECSA, while the sample 1 (ultrathin film of Pd/(Ni)) offered the largest value. It can be concluded that by increasing nickel loading amount, the relatively large Pd dendrites with low aspect ratio were achieved. A decrease in the amount of nickel loading leads to the formation of Pd/Ni thin film with larger ECSA.
Table 3 The comparison of ECSA and the amounts of estimated Pd loading (WPd) as function of Ni electrodeposition charge (QNi) for various galvanically replaced Pd/(Ni) catalysts
Electrocatalyst |
QNi (mC cm−2) |
WPd (mg cm−2) |
ECSA (m2 g−1) |
HUPD |
Ostripping |
1 |
30 |
0.015 |
27.8 |
31.9 |
2 |
60 |
0.031 |
24.7 |
14.0 |
3 |
200 |
0.105 |
20.2 |
11.4 |
4 |
575 |
0.305 |
14.2 |
9.1 |
It should be noticed that for the samples 2, 3 and 4, the obtained ECSA values estimated based on HUPD are larger than those estimated base on the oxygen stripping. The reason might be that the Pd strongly adsorbs hydrogen atoms which are immediately absorbed into the Pd lattice even during under-potential deposition of hydrogen; i.e. the HUPD adsorption and absorption may occur concurrently (see also next section).45,46
3.4.2. Massive absorption/extraction of hydrogen. The tail (g) in Fig. 7 is a part of the main “massive absorption” peak of hydrogen. In order to investigate the hydrogen absorption behavior, cyclic voltammetry corresponding to the Pd/(Ni) catalysts in 0.5 M H2SO4 solution at the potential region of hydrogen absorption are shown in Fig. 8. The reduction peak appeared at the negative going scan is related to the massive absorption of hydrogen.47 Electrochemical adsorption of hydrogen atom occurs by discharging of acid according to the following equation:41 |
Pdsurf + H3O+ + e− → Pdsurf − Hads + H2O
| (4) |
 |
| Fig. 8 Cyclic voltammograms of Pd(Ni)/GC catalysts at the hydrogen absorption potential region in 0.5 M H2SO4 solution with a scan rate of 5 mV s−1. Sacrificed Ni loading amounts are: (1) 30, (2) 60, (3) 200 and (4) 575 mC cm−2. | |
Then the adsorbed atoms physically diffuse to Pd lattice and form Pd hydride phase48,49 as:
|
Pdsurf − Hads + Pdlatt → Pdlatt − Habs + Pdsurf
| (5) |
The subsequent oxidation peak is related to the extraction (diffusion back) of hydrogen from Pd hydride phase. According to the Fig. 8, with a decrease in the amount of Ni loading, (i.e. from dendritic to thin film morphology), the massive absorption of hydrogen decreases significantly. In addition, the position of the peaks are also of interest. The difference between cathodic and anodic peaks (ΔEp), is a useful diagnostic parameter for evaluating the reversibility of reaction (i.e. the catalytic performance of sample). Accordingly, the results indicated the more reversibility for hydrogen absorption/extraction on sample 1. To find the reason of this enhancement, in Fig. 9, a comprehensive comparison between sample 1 and an electrodeposition Pd thin film (with the same loading) has been made (the related FESEM image is shown in Fig. S1 in ESI†). The values of ΔEp in the hydrogen absorption/extraction were 35 mV and 100 mV for sample 1 and electrodeposited pure Pd film, respectively. In addition, as seen in the inset of Fig. 9, the potential of half-wave for the oxygen stripping corresponding to the sample 1 was ∼27 mV more noble than electrodeposited Pd thin film. The positive shift of the half-wave potential observed in Fig. 9 indicates the easier reduction and/or stripping of chemisorbed oxygenated species on the surface of Pd/(Ni) as compared with the pure electrodeposited Pd thin film.
 |
| Fig. 9 Comparison of voltammograms of sample 1 in Fig. 8 (galvanically replaced Pd/(Ni) thin film) and electrodeposited Pd thin film in a 0.5 M H2SO4 solution (scan rate of 50 mV s−1). | |
Therefore, it can be deduced that the better performance of Pd/(Ni) thin film (sample1) in comparison to dendritic catalysts is attributed to: (i) higher ECSA and (ii) the higher specific activity due to ligand and/or geometric effects of a few underlying Ni atoms in Pd/(Ni) thin film; ligand effect is caused by electronic charge transfer between the Ni and Pd atoms, leads to the downshift in the Pd d-band center,20,50 and geometric effect is based on the formation of a lattice contraction in the Pd/(Ni) thin film due to dissolution of Ni atoms during galvanic replacement, which promotes the electron transfer from surface to the sub-layer and down-shift of the d-band center of surface Pd atoms. By lowering the d-band center, the interaction strength of adsorbents with the Pd surface decreases.18,20
3.4.3. Hydrogen evolution reaction (HER). By applying more negative potentials and after saturation of catalyst with absorbed hydrogen,41 hydrogen evolution will start. Depending on the activity of the catalyst for hydrogen evolution, a combination of the following well-known routes may occur: |
Volmer reaction: Pdsurf + H+ + e− → Pdsurf − Hads
| (6) |
|
Tafel reaction: 2(Pdsurf − Hads) → 2Pdsurf + H2↑
| (7) |
|
Heyrovsky reaction: Pdsurf − Hads + H+ + e− → Pdsurf + H2↑
| (8) |
According to the Volmer–Tafel mechanisms, in the acidic media the discharge of protons form adsorbed hydrogen atoms on catalyst surface (Volmer reaction), then, two adsorbed hydrogen atoms are combined to produce a hydrogen molecule (Tafel combination reaction).42 On the other hand, according to the Volmer–Heyrovsky mechanisms, the first step of above mechanism (reaction (6)) is followed by the Heyrovsky reaction (reaction (8)).
By plotting the potential against logarithm of current density and determining the Tafel constant (β slope), it is possible to distinguish the mechanisms of HER. In brief, an easy Volmer reaction followed by a relatively slow combination reaction leads to a slope of ca. 29 mV dec−1. In the case of fast Volmer reaction followed by a rate-determining Heyrovsky reaction, the β is ca. 39 mV dec−1. Moreover, if Volmer reaction is rate-determining step, the β is ca. 118 mV dec−1.51 In order to compare the electrocatalytic activity of the catalysts for HER, four samples were prepared and investigated, namely: (1) an electrodeposited Pd thin film, (2) a Pd/(Ni) thin film produced by galvanic replacement, (3) a dendritic Pd/(Ni) catalyst produced by galvanic replacement and (4) an electrodeposited Pt catalyst (for comparison). Fig. 10A and B show the polarization curves as well as the corresponding Tafel plots in 0.5 M H2SO4 solution. It is observed that hydrogen evolution initiates after the absorption peak (discussed in Section 3.4.2), i.e. saturation with the massive absorbed hydrogen atoms. The onset potential of galvanically replaced Pd/(Ni) thin film is very close to the onset potential of the electrodeposited Pt thin film (−0.198 V (zero overpotential) against −0.201 V). The onset potential of the galvanically replaced Pd/(Ni) thin film, electrodeposited Pd thin film and galvanically replaced Pd/(Ni) dendrites are −0.198, −0.211 and −0.244 V, respectively. Therefore, the galvanically replaced Pd/(Ni) thin film shows the lowest onset potential for hydrogen evolution. By using of the Pd/(Ni) thin film as catalyst for HER, the problem of massive hydrogen absorption decreases.52 Moreover, the hydrogen adsorption strength on the Pd/(Ni) thin film is supposed to be weaker than that on the dendritic structures as predicted by the Sabatier's principle (see also previous section).5,53
 |
| Fig. 10 (A) The polarization curves and (B) corresponding Tafel plots of: (1) electrodeposited Pd thin film, (2) galvanic replaced Pd thin film, (3) dendritic Pd obtained from galvanic replacement and (4) electrodeposited Pt thin film, in 0.5 M H2SO4 solution (scan rate: 5 mV s−1). | |
According to the Fig. 10B, in the low overpotential region the Tafel slopes for samples 1, 2, 3 and 4 are 38.8, 37.6, 37.1 and 29 mV dec−1, respectively. The Tafel slope values approve that the evolution of hydrogen occurs through Volmer–Heyrovsky pathway on all Pd catalysts while the platinum catalyst acts according to Volmer–Tafel mechanisms.
3.4.4. Formic acid oxidation. To evaluate the activity of the catalysts towards the formic acid oxidation, the studies conducted in a solution of 0.5 M HCOOH + 0.5 M H2SO4. Four as-prepared samples (different amounts of initial Ni loading: (1) 30, (2) 60, (3) 200 and (4) 575 mC cm−2) were maintained in the solution for 5 min before each experiment to reach to a steady state open circuit potential. The open circuit potentials for samples 1, 2, 3, 4 were −0.214, −0.181, −0.170, −0.170 V, respectively. At first glance, the values indicate that the sample 1 (galvanically replaced Pd/(Ni) thin film) may have the highest ability towards formic acid oxidation. Fig. 11A shows the linear sweep voltammetry, in anodic direction, between the OCP and +0.8 V vs. Ag/AgCl. In addition, mass activities, the normalized current density against the amounts of Pd loading, for each catalyst are shown in Fig. 11B. In all curves, it can be seen that a hydrogen oxidation peak (a) were appeared before the main formic acid oxidation peak (b). Peak (a) is the same as the hydrogen extraction peak in Fig. 8. But, the question that arises is how the hydrogen atoms could be absorbed without applied cathodic potential. It can be justified by considering a pair of oxidation–reduction reactions on the catalyst surface which leads to a mixed open circuit potential. The OCP corresponding to each catalyst is a value between reversible potential of formic acid oxidation54 and the reversible potential of hydrogen absorption. In the open circuit condition, the following interchange reactions approach to kinetics equilibrium on the catalyst surface as following: |
Anodic reaction: HCOOH → CO2 + 2H+ + 2e−
| (9) |
|
Cathodic reaction: 2H+ + 2e− → 2Hads → 2Habs
| (10) |
 |
| Fig. 11 (A) Voltammograms corresponding to the catalysts with different values of sacrificial Ni loading: (1) 30, (2) 60, (3) 200 and (4) 575 mC cm−2 in 0.5 M H2SO4 + 0.5 M HCOOH at a scan rate of 50 mV s−1, (B) mass activity against potential taken from (A); (C) comparison of the ECSA estimated by oxygen stripping charges as well as the mass and specific activities for formic acid oxidation measured at E = 0.0 V vs. Ag/AgCl. | |
Therefore depend on the OCP value, the hydrogen can be absorbed on the surface and at the beginning of voltammetry curve extracted as an anodic peak (a). The negative shift of the OCP in sample 1 (∼34 mV relative to sample 3 and 4) leads to an enhancement of spontaneous dehydrogenation of formic acid and reduction and/or absorption of protons.
The succeeding peak (b) corresponds to formic acid oxidation. The peak potentials of formic acid oxidation on samples 1, 2, 3, 4 are 0.05, 0.15, 0.18 and 0.20 V, respectively. The so-called “dehydrogenation” and “dehydration” are two generally accepted mechanisms for the oxidation of HCOOH.19,54–57 By adsorption of HCOOH on the surface of an excellent catalyst, two protons are achieved through anodic “dehydrogenation” of formic acid without interference of carbon monoxide, as following:
|
Pdsurf + HCOOH → Pdsurf − HCOOads + H+ + e− → Pdsurf + CO2 + 2H+ + 2e−
| (11) |
In the case of a weaker catalyst, a portion of adsorbed HCOOH may be “dehydrated” through the following reactions, resulting in undesired strongly adsorbed CO species:
|
Pdsurf + HCOOH → Pdsurf − HCOOads + H+ + e−
| (12) |
|
Pdsurf − HCOOads + 2(Pdsurf − Hads) → Pdsurf − HCOads + H2O
| (13) |
|
Pdsurf − HCOads → Pdsurf − COads + H+ + e−
| (14) |
According to the singular oxidation peak observed for samples 1 and 2, it can be concluded that formic acid was oxidized through the direct dehydrogenation pathway. However, the subsequent peak (c) that is observed for samples 3 and 4 at about 0.6 V is attributed to the oxidation of adsorbed CO species which are formed through the partial occurrence of dehydration pathway.
The normalized current densities per Pd loading amounts are compared in Fig. 11B. The current reaches 1.39, 0.89, 0.72 and 0.59 A mg−1 at peak potentials for the catalysts with sacrificial Ni loading of 30, 60, 200, and 575 mC cm−2, respectively. Also at the potential of 0.0 V, the mass activity values are 0.70, 0.21, 0.14 and 0.10 A mg−1, respectively. The results indicate that the amount of sacrificial Ni loading could effectively influence the kinetics of formic acid oxidation. Among the galvanically replaced Pd/(Ni) catalysts, the Pd thin film exhibits the superior mass activity for formic acid oxidation. The thin film of Pd/(Ni) (sample 1) reveals an unexpectedly increase in mass activity without considering its larger ECSA (Table 3). Since, mass activity = specific activity × ECSA, more than 3 fold enhancement in mass activity is attributed to the specific activity increasing due to ligand and/or geometric effects of a few underlying Ni atoms in Pd/(Ni) thin film.20,58,59 However, such effects may be diminished when the catalyst structure grows dendritically.
A comprehensive comparison of performance parameters of galvanically replaced Pd/(Ni) thin film with some other Pd-based electrocatalysts reported recently20,60–66 reveals that the prepared Pd/(Ni) catalyst in this work has a comparable activity with those reported in literature (see Table S1 in ESI†).
4. Conclusions
A variety of Pd/(Ni) catalyst using the facile and influential galvanic replacement method were successfully prepared by changing the Ni loading amounts. By monitoring the electrode potential during Ni dissolution and Pd reduction, the required time to complete the replacement process were determined. The mechanisms of galvanic replacement process during the growth of Pd were investigated. FESEM images indicated that the amount of electrodeposited Ni loading controls the final deposit morphology. The extremely low amount of sacrificial Ni yields to a Pd/(Ni) thin film with densely packed nano-seeds while the higher Ni loading amounts leads to a dendritic Pd growth; which results in the more surface coverage with increasing the amount of Ni loading. The electrochemical measurements indicated that the Pd/(Ni) thin film shows highest electrocatalytic activity for hydrogen evolution reaction and formic acid oxidation (mass activity of 1.39 A mg−1 at the peak potential). Moreover, the mass activity of Pd/(Ni) thin film for formic acid oxidation was more than 3-fold higher than the dendritic Pd/(Ni). Furthermore, comparison of the performance parameters of galvanically replaced Pd/(Ni) thin film with those of some other recently reported Pd-based catalysts with best results for formic acid oxidation confirmed the outstanding achievement of this study.
Acknowledgements
This work is a part of project number 92043610 with the Iran National Science Foundation (INSF). The authors gratefully acknowledge INSF for financial support.
References
- P. Zhou, Z. Dai, M. Fang, X. Huang, J. Bao and J. Gong, J. Phys. Chem. C, 2007, 111, 12609–12616 CrossRef CAS.
- S. Choi, H. Jeong, K. Choi, J. Y. Song and J. Kim, ACS Appl. Mater. Interfaces, 2014, 6, 3002–3007 Search PubMed.
- P. Fang, S. Duan, X. Lin, J. R. Anema, J. Li, O. Buriez, Y. Ding, F.-R. Fan, D.-Y. Wu, B. Ren, Z. L. Wang, C. Amatore and Z.-Q. Tian, Chem. Sci., 2011, 2, 531 RSC.
- P. Kannan, J. Dolinska, T. Maiyalagan and M. Opallo, Nanoscale, 2014, 6, 11169–11176 RSC.
- L. A. Kibler, Electrochim. Acta, 2008, 53, 6824–6828 CrossRef CAS.
- S. A. Grigoriev, P. Millet and V. N. Fateev, J. Power Sources, 2008, 177, 281–285 CrossRef CAS.
- D. Wang, T. Li, Y. Liu, J. Huang and T. You, Cryst. Growth Des., 2009, 9, 4351–4355 Search PubMed.
- Y.-J. Song, J.-Y. Kim and K.-W. Park, Cryst. Growth Des., 2009, 9, 505–507 Search PubMed.
- S. Patra, B. Viswanath, K. Barai, N. Ravishankar and N. Munichandraiah, ACS Appl. Mater. Interfaces, 2010, 2, 2965–2969 Search PubMed.
- Y. Zhu, Z. Khan and R. I. Masel, J. Power Sources, 2005, 139, 15–20 CrossRef CAS.
- N. Tian, Z.-Y. Zhou and S.-G. Sun, Chem. Commun., 2009, 1502–1504 RSC.
- H. Meng, F. Xie, J. Chen and P. K. Shen, J. Mater. Chem., 2011, 21, 11352 RSC.
- L. Zhang and G. Henkelman, J. Phys. Chem. C, 2012, 116, 20860–20865 CrossRef CAS.
- M. Vafaei, M. Rezaei, S. H. Tabaian, F. Mahboubi and D. F. Haghshenas, J. Solid State Electrochem., 2015, 19, 289–298 CrossRef CAS.
- G. F. Alvarez, M. Mamlouk, S. M. Senthil Kumar and K. Scott, J. Appl. Electrochem., 2011, 41, 925–937 CrossRef CAS.
- S. Thanasilp and M. Hunsom, Renewable Energy, 2011, 36, 1795–1801 CrossRef CAS.
- M. Rezaei, M. Ghorbani and A. Dolati, Electrochim. Acta, 2010, 56, 483–490 CrossRef CAS.
- J. Bai, L. Shen, D. Sun, Y. Tang and T. Lu, CrystEngComm, 2014, 16, 10445–10450 RSC.
- M. Rezaei, S. H. Tabaian and D. F. Haghshenas, J. Mater. Chem. A, 2014, 2, 4588 RSC.
- M. Ren, J. Chen, Y. Li, H. Zhang, Z. Zou, X. Li and H. Yang, J. Power Sources, 2014, 246, 32–38 CrossRef CAS.
- S. Tominaka, T. Hayashi, Y. Nakamura and T. Osaka, J. Mater. Chem., 2010, 20, 7175 RSC.
- J. P. Xiao, Y. Xie, R. Tang, M. Chen and X. B. Tian, Adv. Mater., 2001, 13, 1887 CrossRef CAS.
- W. Ye, Y. Chen, F. Zhou, C. Wang and Y. Li, J. Mater. Chem., 2012, 22, 18327 RSC.
- X. Bai, Y. Gao and L. Zheng, CrystEngComm, 2011, 13, 3562–3568 RSC.
- M. Mohl, D. Dobo, A. Kukovecz, Z. Konya, K. Kordas, J. Wei, R. Vajtai and P. M. Ajayan, J. Phys. Chem. C, 2011, 115, 9403–9409 CrossRef CAS.
- A. Sarkar and A. Manthiram, J. Phys. Chem. C, 2010, 114, 4725–4732 CrossRef CAS.
- T. Cochell, W. Li and A. Manthiram, J. Phys. Chem. C, 2013, 117, 3865–3873 CrossRef CAS.
- M. Shao, K. Shoemaker, A. Peles, K. Kaneko and L. Protsailo, J. Am. Chem. Soc., 2010, 132, 9253–9255 CrossRef CAS PubMed.
- Y. Zhang, C. Ma, Y. Zhu, R. Si, Y. Cai, J. X. Wang and R. R. Adzic, Catal. Today, 2013, 202, 50–54 CrossRef CAS.
- Z. Yi, X. Tan, G. Niu, X. Xu, X. Li, X. Ye, J. Luo, B. Luo, W. Wu, Y. Tang and Y. Yi, Appl. Surf. Sci., 2012, 258, 5429–5437 CrossRef CAS.
- J. Huang, S. Vongehr, S. Tang, H. Lu and X. Meng, J. Phys. Chem. C, 2010, 114, 15005–15010 CrossRef CAS.
- G. a. Di Bari, in Modern Electroplating, John Wiley & Sons, Inc., Hoboken, NJ, USA, 2011, pp. 79–114 Search PubMed.
- V. Bertagna, J. Electrochem. Soc., 1997, 144, 4175 CrossRef CAS.
- M. Rezaei, S. H. Tabaian and D. F. Haghshenas, J. Electroanal. Chem., 2012, 687, 95–101 CrossRef CAS.
- W. Lo, Y. Hsieh and I. Sun, J. Electrochem. Soc., 2012, 159, D282 CrossRef CAS.
- L. N. Bengoa, S. Bruno, H. A. Lazzarino, P. R. Seré and W. A. Egli, Procedia Mater. Sci., 2015, 8, 1174–1183 CrossRef CAS.
- B. N. G. Konstantin, I. Popov and S. S. Djokić, Fundamental Aspects of Electrometallurgy, Kluwer Academic Publishers, Boston, 2002 Search PubMed.
- S. H. M. David, A. Hutt, C. Liu, P. P. Conway and D. C. Whalley, IEEE Trans. Compon. Packag. Technol., 2002, 25, 98–105 CrossRef.
- V. Fleury, Nature, 1997, 390, 145–148 CrossRef CAS.
- N. A. Al Abass, G. Denuault and D. Pletcher, Phys. Chem. Chem. Phys., 2014, 16, 4892 RSC.
- C. Te Hsieh, Y. Y. Liu and A. K. Roy, Electrochim. Acta, 2012, 64, 205–210 CrossRef.
- J. O'M Bockris, R. White and B. E. Conway, Modern Aspects of Electrochemistry, Kluwer Academic Publishers, 2002 Search PubMed.
- A. Papaderakis, N. Pliatsikas, C. Prochaska, K. M. Papazisi, D. Tsiplakides, P. Patsalas and S. Sotiropoulos, Phys. Chem. Chem. Phys., 2014, 2, 1–11 CAS.
- B. Lim, M. Jiang, P. H. C. Camargo, E. C. Cho, J. Tao, X. Lu, Y. Zhu and Y. Xia, Science, 2009, 324, 1302–1305 CrossRef CAS PubMed.
- S. Qian, Int. J. Hydrogen Energy, 2000, 25, 539–550 CrossRef CAS.
- J. Sun, C. Zhang, T. Kou, J. Xu and Z. Zhang, ACS Appl. Mater. Interfaces, 2012, 4, 6038–6045 Search PubMed.
- A. E. Bolzán, J. Electroanal. Chem., 1995, 380, 127–138 CrossRef.
- M. Rezaei, S. H. Tabaian and D. F. Haghshenas, Electrochim. Acta, 2013, 87, 381–387 CrossRef CAS.
- M. Rezaei, S. H. Tabaian and D. F. Haghshenas, Electrochim. Acta, 2012, 59, 360–366 CrossRef CAS.
- P. Strasser, S. Koh, T. Anniyev, J. Greeley, K. More, C. Yu, Z. Liu, S. Kaya, D. Nordlund, H. Ogasawara, M. F. Toney and A. Nilsson, Nat. Chem., 2010, 2, 454–460 CrossRef CAS PubMed.
- D. Merki and X. Hu, Energy Environ. Sci., 2011, 4, 3878 Search PubMed.
- J. Zhang, Electrochem. Commun., 2007, 9, 1298–1304 CrossRef CAS.
- A. B. Laursen, A. So, F. Dionigi, H. Fanchiu, C. Miller, O. L. Trinhammer, J. Rossmeisl and S. Dahl, J. Chem. Educ., 2012, 89, 1595–1599 CrossRef CAS.
- M. Rezaei, S. H. Tabaian and D. F. Haghshenas, Electrocatalysis, 2014, 5, 193–203 CrossRef CAS.
- P. Waszczuk, T. M. Barnard, C. Rice, R. I. Masel and A. Wieckowski, Electrochem. Commun., 2002, 4, 599–603 CrossRef CAS.
- X. Yu and P. G. Pickup, J. Power Sources, 2008, 182, 124–132 CrossRef CAS.
- E. A. Baranova, N. Miles, P. H. J. Mercier, Y. Le Page and B. Patarachao, Electrochim. Acta, 2010, 55, 8182–8188 CrossRef CAS.
- S. Sakong, C. Mosch and A. Gross, Phys. Chem. Chem. Phys., 2007, 9, 2216–2225 RSC.
- J. Zhang, in Fuel Cells, Springer New York, New York, NY, 2013, pp. 305–340 Search PubMed.
- J. Chang, L. Feng, C. Liu, W. Xing and X. Hu, Angew. Chem., Int. Ed., 2014, 53, 122–126 CrossRef CAS PubMed.
- W. Hong, Y. Fang, J. Wang and E. Wang, J. Power Sources, 2014, 248, 553–559 CrossRef CAS.
- W. Hong, J. Wang and E. Wang, Int. J. Hydrogen Energy, 2014, 39, 3226–3230 CrossRef CAS.
- A. B. A. A. Nassr, A. Quetschke, E. Koslowski and M. Bron, Electrochim. Acta, 2013, 102, 202–211 CrossRef CAS.
- S. Lee, N. Jung, J. Cho, H.-Y. Park, J. Ryu, I. Jang, H. Kim, E. Cho, Y. Park, H. C. Ham, J. H. Jang and S. J. Yoo, ACS Catal., 2014, 4, 2402–2408 CrossRef CAS.
- L. Zhang, L. Wan, Y. Ma, Y. Chen, Y. Zhou, Y. Tang and T. Lu, Appl. Catal., B, 2013, 138–139, 229–235 CrossRef CAS.
- X. Wang, W. Wang, Z. Qi, C. Zhao, H. Ji and Z. Zhang, Electrochem. Commun., 2009, 11, 1896–1899 CrossRef CAS.
Footnote |
† Electronic supplementary information (ESI) available. See DOI: 10.1039/c5ra27219j |
|
This journal is © The Royal Society of Chemistry 2016 |
Click here to see how this site uses Cookies. View our privacy policy here.