Differential influence of additives on the various stages of insulin aggregation

Shivnetra Saha , Anurag Sharma and Shashank Deep*
Department of Chemistry, Indian Institute of Technology, Hauz Khas, New Delhi-110016, Delhi, India. E-mail: sdeep@chemistry.iitd.ac.in

Received 19th December 2015 , Accepted 9th March 2016

First published on 11th March 2016


Abstract

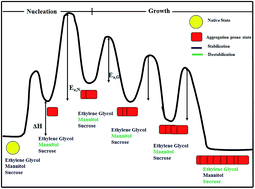
The kinetics of aggregation of insulin at pH 1.6 was studied by monitoring the turbidity as a function of time. The aggregation of insulin occurs by a typical nucleation-growth mechanism, resulting in a distinct lag phase, followed by a growth phase and a saturation phase. Sugars and polyols affect the lag time and the rate constant of growth to different extents, suggesting that these additives affect both the pre- and post-nucleation processes. Sucrose and ethylene glycol effectively reduce the aggregation, whereas mannitol is not effective in suppressing the overall aggregation. However, it can delay the aggregation process. It is also inferred that nucleation and elongation may not be affected in the same manner in the presence of a particular additive. The varying behaviour of different additives suggests their interference in the different stages of aggregation, affecting the aggregation intermediates differently. The viscosity of the medium has a minimal effect on the nucleation process, but does affect the elongation rate. The temperature dependence of the aggregation profiles provides probable reasons for the inhibitory action of these additives. The results also suggest the existence of different types of interactions between the additives and the various species in the aggregation pathway of insulin.


1. Introduction

Protein stability is an issue that is being addressed all over in various strata, beginning from its biophysics in vivo to industrial applications in pharmaceuticals, delivery, storage, expression and purification. This issue particularly becomes important because proteins are only marginally stable, thus rendering them more vulnerable to any minute changes in their vicinity.1,2 One of the most challenging consequences of such marginal stability is the process of protein aggregation. This is because partially unfolded and/or misfolded protein conformations are thought to be the precursors of protein aggregates.1 In vivo protein aggregation results into amyloidoses and many other neurodegenerative diseases like Alzheimer's, Parkinson's, Hungtinton's etc.3–6

Ordered filamentous aggregates bearing a common cross beta sheet architecture are the hallmark of such neurodegenerative diseases. Such ordered aggregates, popularly known as fibrils are formed across a wide range of proteins, including those which are not related to any diseases.3,7–10 The counterpart of these fibrillar aggregates are the amorphous aggregates which do not have any specific distinctive properties, and are rather irregular in their feature. The formation of amorphous or fibrillar aggregates are generally controlled by the protein amino acid sequence. However, their formation can also be manipulated by changing the solution conditions.10–14 Moreover, a large number of cases have been studied where the intermediates in the fibrillation pathway are amorphous in nature.

Interestingly, recent findings have shown that the phenomenon of protein aggregation is not always undesirable. Certain amyloid aggregates have been also found to perform specific biological functions.15 For instance, Aβ aggregates have been found to assist in the sealing of capillaries and arterioles.16 In many cases, protein assemblies are indispensable for their proper function. For the particular case of insulin, it is well known that insulin is stored in the pancreatic cells as its nanocrystalline hexameric assembly. The assembly of proinsulin is also an important step in the different stages of insulin biosynthesis.17

In general, proteins can aggregate under a variety of environmental stress like agitation, high concentration, incompatible ionic strength, denaturants, extreme pH and temperature. All these factors call for a need to closely study the underlying mechanism in the aggregation pathway. Following the kinetics of this phenomenon under various conditions may unfold methods/strategies to prevent/modulate the formation of the aggregates.18–22

External agents like denaturants23–27, osmolytes,8,28–31 nanoparticles,28,32 polyphenols33–36 etc. are now known to affect the stability of proteins differently. It is also important here to note that additives might not always be unique in their mode of action towards unfolding and aggregation of the same protein or different proteins.13 An additive which helps in unfolding might not always favour aggregation, or an additive which stabilizes a particular protein towards aggregation may not stabilize another protein in a similar manner. Such complexities in the behavior of proteins towards similar classes of additives make it difficult to understand, and hence, generalize their behavior. In the present work, we have explored the behaviour of osmolytes-additives which are usually known to provide stability to proteins. Osmolytes impart their stabilizing effect either by the preferential exclusion of the solute from the surface of the protein or by the solvophobic effect. Both these phenomena effectively drive the protein towards their native state from the unfolded state. We have chosen insulin as a model protein to study the effect of few osmolytes – one sugar and two polyols. Strikingly, it was found that all the three chosen additives imparted diverse effect on the aggregation of this protein. Insulin is a globular, 51 amino-acid residue peptide hormone. It is a classical amyloidogenic protein37–40 and its aggregation carries clinical significance. Repeated insulin injections need to be administered to diabetic patients, and such injection sites have been often found to have deposits of fibrillar aggregates of insulin.41–43 Insulin is also found in clinical practices to form aggregates in the blood stream after injections, probably due to the presence of lipids and salts. Insulin can also aggregate during storage due to contact with hydrophobic surfaces under physiological conditions. The preparation of insulin in the industrial set up also encounters a lot of problems due to its high aggregation propensity.41,44

Insulin aggregation has been proposed to be initiated from unfolded insulin monomers that are easily populated under conditions of low pH.37,45–47 Insulin preparations for human medication is also carried out under conditions of low pH, making the protein highly prone to aggregation. This renders the protein ineffective for medicinal purposes. Oral intake of insulin is not possible at present since it encounters an acidic environment in the stomach upon its delivery. Keeping these in mind, we studied the aggregation of insulin under similar conditions. Kinetic profiles of insulin aggregation are suggestive of a nucleation–elongation mechanism, in which the lag time is the time required for the partial unfolding of insulin monomer and the formation of the thermodynamically least favorable species, i.e. the nucleus, in the aggregation pathway.6,40,48 We have proposed a mechanism on the basis of which the chosen osmolytes exhibit their diverse effect. The unity in diversity exhibited by these osmolytes might take us a step forward in understanding the behavior of the complex process of protein aggregation.

2. Materials and methods

2.1 Chemicals

Insulin from bovine pancreas and mannitol were purchased from Sigma-Aldrich and used without further purification. Sucrose and ethylene glycol was purchased from Qualigen and Ranbaxy Laboratories, respectively. HCl was purchased form Merck. Di-sodium hydrogen phosphate, sodium dihydrogen phosphate and sodium acetate were purchased from Sisco Research Laboratories, India. Acetic acid was purchased from S D Fine Chemicals, India. Milli-Q water from a Millipore system was used to prepare the solutions.

Stock solution of insulin was prepared fresh before the experiments in 25 mM HCl at pH 1.6, in the presence of 0.1 M NaCl. The solution was filtered through a 0.2 μm nylon 6-6 membrane before use. Concentration of insulin solution was determined using a molar extinction coefficient of 6000 M−1 cm−1 at 280 nm.49 Solutions of additives were prepared in the same solution of 25 mM HCl and 0.1 M NaCl and pH was maintained at 1.6. All solutions used were filtered through 0.2 μm nylon 6-6 membrane before use.

The studies at pH 4 and pH 7 were done in 25 mM acetate buffer and 25 mM phosphate buffer, respectively, in the presence of 0.1 M NaCl. Additives were also prepared in the respective buffers and the pH was adjusted wherever required.

2.2 Kinetics of the aggregation of insulin using turbidity measurements

25 mM HCl, 0.1 M NaCl in the absence or presence of additives was incubated in a quartz cuvette at the desired temperature for 5 minutes, without any insulin. Henceforth, insulin was added to the incubated solution, and the ‘Kinetics’ program was started immediately on a Cary-100 Bio UV-Visible spectrophotometer. The parameters for the measurements were set beforehand. The cuvette was tightly sealed with the cap to prevent evaporation of the solution at high temperature. Kinetics of insulin aggregation was observed by monitoring the turbidity of the solution at 600 nm as a function of time. The growth of aggregates, as depicted by an increase in the turbidity at 600 nm, resulted in a typical sigmoidal curve, having an initial lag phase with no increase in the absorbance, followed by an elongation and a saturation phase. The aggregation at pH 4 and pH 7 was monitored in the same set up, but the scattering at 600 nm was monitored at different times. The kinetic data obtained were fitted with a four-parameter sigmoidal curve using the following equation (eqn (1))
 
image file: c5ra27206h-t1.tif(1)
where y is the absorbance at any time t, y0 is the initial value of absorbance, a is the maximum absorbance, t1/2 is the time at which the absorbance is half of its maximum. Kinetic constants calculated were the (i) apparent rate constant (kapp = 1/b) which gives an estimate of the rate of growth of aggregates and (ii) lag time (tlag = −t1/2 − 2b) which gives the length of the lag phase.

2.3 CD spectroscopy

The far UV CD spectrum with 15 μM insulin and the near UV CD spectrum with 65 μM insulin were collected from 283 K to 363 K in AVIV Sx-420 CD spectrophotometer, aided with a peltier accessory. The spectra were collected at an interval of 1 nm, in a quartz cuvette of path length of 1 mm. The far UV CD spectra of insulin in presence of the additives were collected at 333 K. Each CD spectrum is an average of five scans. The spectra were corrected with appropriate blanks. For aggregation experiments using CD spectroscopy, 34 μM insulin and 10 mM NaCl was used. A higher concentration of insulin was used in order to get a considerable CD signal at higher aggregation times, since aggregation should result in the loss of secondary structure. The lower concentration of NaCl was used in order to further prolong the aggregation, in order to adjust to the time scale of the measurement of the CD spectrum.

2.4 Fluorescence spectroscopy

The fluorescence spectra of ANS with 15 μM insulin, from 283 K to 363 K, were taken on a Varian Cary Eclipse fluorescence spectrophotometer. ANS-bound insulin samples were excited at 350 nm and the fluorescence spectra of ANS were collected from 400 nm to 680 nm. The spectra of ANS bound to insulin in the presence of additives were taken at 333 K after equilibrating the sample at this temperature for one minute. The spectra were corrected with appropriate blanks.

2.5 Effect of additives on the aggregation of insulin

15 μM insulin solution at pH 1.6 was incubated at 333 K in the presence of additives (mannitol, sucrose and ethylene glycol, 0.15 M of each additive). The turbidity of the solution was monitored by measuring the absorbance at 600 nm. The data was analyzed using eqn (1). In order to eliminate any effect of the density/viscosity imparted by these additives on the aggregation of insulin, we also carried out a set of experiments where the concentration of the additives was so chosen that they have nearly the same density and viscosity. This ensured that the effect of viscosity is equalized and effect of chemistry of substance can be monitored.

2.6 Fluorescence microscopy of the aggregates

10 μL of the aggregated solution after the completion of aggregation (in the presence and absence of additive) was added to 10 μL of 20 μM thioflavin T (ThT). The solution was mixed and 10 μL of this was placed on a glass slide and allowed to dry. It was then viewed with a Nikon Eclipse Ni H600L fluorescence microscope.

2.7 Measurement of density and viscosity of the additives

The density of the additives of the required concentration was measured using Mettler Toledo DE45 Delta range density meter. The measurement is based on the electromagnetically induced oscillations of a U-shaped glass tube. A transmitter induces the oscillations to a magnet fixed to the U-shaped tube. A sensor measures the period of oscillation. Before the measurement, the densitometer was calibrated with respect to air and water. The viscosities of the solutions were measured using a capillary tube of 1.6 mm on Anton Par AmVn automated microviscometer with the density data as input. Both the densities and the viscosities were measured at 313 K. Measurement of the densities and viscosities at temperatures beyond this was not possible in the existing set up due to the formation of bubbles in the capillaries. However, the densities and viscosities were measured over a range of temperatures, and were found to be linearly dependent on temperature. It is expected that the actual viscosity at the temperature of aggregation in this study will be proportional to the reported density and viscosity at 313 K (Fig. S1).

2.8 Effect of temperature on the aggregation kinetics of insulin

Aggregation kinetics of insulin was also observed as a function of temperature. Activation energy of the nucleation and elongation processes was calculated from the temperature dependence of the nucleation rate constant (1/tlag) and the apparent rate constant for growth (kapp), respectively, using eqn (2) and (3). The activation energy was also calculated in presence of the additives using these equations. The viscosity of the medium was kept constant for all the additives.
 
image file: c5ra27206h-t2.tif(2)
 
image file: c5ra27206h-t3.tif(3)

2.9 Dynamic light scattering

The aggregation was also monitored by dynamic light scattering using Zetasizer Nano, Malvern instrument at a measurement angle of 90°. Measurements were done at 333 K in a quartz cuvette. The temperature of the solution was raised to 333 K and protein was added to it. Each measurements consisted of 10 scans, each scan taken for 10 seconds. For DLS measurements, 34 μM insulin and 65 mM NaCl was used.

3. Results

3.1 CD spectroscopy of insulin at different temperatures in presence and absence of additives

The far UV CD spectra of insulin at 298 K (Fig. 1) shows characteristic peaks around 222 and 208 nm indicating that it is predominantly an α-helical protein. With increase in temperature, there is a decrease in the content of α-helix, as seen from the decrease in the characteristic peak at 222 nm. CD spectrum at higher temperatures, around 333 K, shows considerably lesser secondary structure, pointing towards a partially unfolded conformation at the temperature of aggregation. These CD spectra at each temperature have been fitted to the CONTINLL algorithm using CD Pro, in order to obtain the relative content of the helical (regular, ‘r’ and distorted, ‘d’) and the beta strand content (regular, ‘r’ and distorted, ‘d’). It is quite evident that the loss of the total helical content and the emergence of the beta strands occur almost simultaneously (Fig. 1). Fits to the curve using the SELCON and CDSSTR algorithm also yielded similar results; however, the RMSD value was minimum for the CONTINLL algorithm. Near-UV CD spectra of insulin also shows that the loss of tertiary structure began from 323 K, a temperature at which there was a considerable retention of the secondary structure (Fig. 1). Thus the aggregation prone conformation of insulin is the one in which there is a high loss in the content of tertiary structure, along with some loss of the secondary structure.
image file: c5ra27206h-f1.tif
Fig. 1 (A) Far-UV CD spectra (B) near UV CD spectra of insulin (15 μM) in 25 mM HCl (pH 1.6) at different temperatures (C) fraction of helices and strands in insulin (15 μM) in 25 mM HCl (pH 1.6) at different temperatures.

3.2 The aggregation of insulin at 333 K

Aggregation of insulin at 333 K in 25 mM HCl, pH 1.6 proceeds via a nucleated pathway, as already reported in the literature.6,37,40,48,50 The nucleated aggregation of insulin typically results in an initial flat lag phase, followed by a growth phase, and then a saturation phase. It is clear from Fig. 1 that the aggregation prone conformation has a considerable beta sheet content. It is this conformation which participates in the formation of the aggregation competent nucleus. The aggregation was also monitored using dynamic light scattering (DLS), and a profile similar to that obtained from turbidity measurements was observed in the initial stages (Fig. S2). The entire reaction could not be monitored using DLS due to the formation of large sized particles during the course of aggregation which were beyond the range of the detector.

An external agent can affect the aggregation by interfering in any one/some/or all of the three stages of the kinetic profile. We started with a polyol as an external agent and compared its effect with a sugar and another polyol and have shown how the three additives inhibit/enhance the different stages of insulin aggregation differently. Fig. 2 shows the kinetics of the thermal aggregation of 15 μM insulin alone and in the presence of 0.15 M additives at 333 K. The principal parameters describing the aggregation process viz. lag time (tlag), rate constant (kapp), and maximum aggregation (Amax) were extracted from analysis of the kinetic traces using eqn (1) and are listed in Table 1.


image file: c5ra27206h-f2.tif
Fig. 2 Aggregation kinetics of 15 μM insulin (25 mM HCl, 0.1 M NaCl, pH 1.6) in the presence of various additives at 333 K.
Table 1 Density and viscosity of different additives and the kinetic parameters of insulin aggregation (15 μM) in their presence at 333 K in 25 mM HCl (pH 1.6) and 0.1 M NaCl
Additives Concentration (M) Density (g cm−3) Viscosity (mPa s) tlag (min) kapp (min−1) Amax
No additive 0.99221 0.6527 23.4 ± 0.5 0.147 ± 0.005 0.104 ± 0.015
Ethylene glycol 0.15 0.99437 0.6580 50.8 ± 1.4 0.150 ± 0.006 0.031 ± 0.006
0.92 1.00861 0.7597 59.6 ± 2.05 0.041 ± 0.005 0.024 ± 0.006
Mannitol 0.15 1.00065 0.7006 40.9 ± 1.1 0.367 ± 0.005 0.077 ± 0.012
0.3 1.00944 0.7596 38.6 ± 1.50 0.218 ± 0.008 0.123 ± 0.012
Sucrose 0.15 1.01172 0.7720 49.8 ± 1.2 0.087 ± 0.004 0.056 ± 0.009


It is evident that all the additives used have affected the pre- and post-nucleation processes. The additives that have been used are seen to increase the ellipticity of the native state of insulin (Fig. 3). The additives are also seen to perturb the aggregation prone conformation at 333 K. Fitting of the CD profiles of insulin in its native state, as well as in its aggregation prone state has been used to estimate the overall structural change of the protein at the temperature of aggregation in the presence of the additives (Fig. 4). The inferences from the same are discussed in the following section.


image file: c5ra27206h-f3.tif
Fig. 3 (A) Far UV CD spectra of insulin at 298 K in the presence of different additives. (B)–(D) Change in the CD spectra of insulin at 333 K in the presence of different additives.

image file: c5ra27206h-f4.tif
Fig. 4 Percentage loss of helicity (A) and percentage gain in the beta strands (B) at the temperature of aggregation. Percentage change in the secondary structure was calculated using the change in the fraction of secondary structure at 298 K and 333 K, as obtained from the CONTINLL fitting algorithm.

3.3 The lag phase

The initial flat phase is significantly increased in the presence of all the three additives. This flat phase in the case of insulin has been attributed to the phenomenon of nucleation during aggregation. Lengthening of the flat phase (or the lag phase) of aggregation in our case suggests that these additives have the ability to hinder the formation of the aggregation competent conformation. As far as the aggregation competent state is concerned, sucrose and ethylene glycol stabilizes this, whereas no prominent stabilization is seen in the case of mannitol (Fig. 3). By stabilization of the aggregation competent state, we mean that the additives modulate the structure such that the further growth of later species in the aggregation pathway (higher aggregates) is hindered. Fig. 4 shows a comparison of the extent of loss in helicity or the gain in the beta content at the temperature of aggregation in every additive. The bars suggest that the loss of helicity at the temperature of aggregation is minimum in the presence of sucrose. That is to say, at the temperature of aggregation, sucrose is the most effective in retaining back the native structure of the protein while mannitol retains the least helicity amongst the three additives. However, in spite of the relative inertness of mannitol towards the aggregation competent state, mannitol is seen to increase the lag phase of aggregation.

Aggregation involves the interaction of molecules with each other, and hence, diffusion is expected to play an important role in this process. It cannot be overlooked that the additives used increase the viscosity of the medium to different extents, as is also evident from Table 1. Aggregation is obviously expected to be slow if molecules are not able to diffuse efficiently into each other. Since mannitol contributes little to the retention of the secondary structure at the temperature of aggregation, the increased lag time could be a consequence of the increased viscosity of the medium. However, the lag time in the presence of these additives and the viscosities are not correlated. This is because although ethylene glycol has the least viscosity amongst the three additives, ethylene glycol introduces the maximum delay before the growth of aggregates can start (Table 1). Sucrose on the other hand, with the maximum viscosity, has a lag time similar to that of ethylene glycol. The similar lag times despite a differing viscosity definitely implies that the increased lag times are a consequence of the stabilization of the aggregation competent state (energetically more stable, and hence less favorable to aggregate), rather than the hindered diffusion of the protein molecules. This is not to suggest that viscosity has no role in inhibition; rather, the chemical nature of the additive also has an important role.

3.4 The growth phase

The total time taken for aggregation in the presence of mannitol is indeed higher than that in absence of any additive (Fig. 2). However, it is interesting to note that the growth rate is much faster in the presence of mannitol (although the lag time is increased). Although the rate of growth of aggregates decreases in the presence of sucrose, it remains almost similar in the presence of ethylene glycol. The examination of the curves also tells us that in spite of the similar lag times in sucrose and ethylene glycol, the aggregation in the presence of ethylene glycol reaches completion much faster than that in the presence of sucrose. Such is also clear from the extracted parameters upon fitting the curves. These diverse behaviors observed in various stages in the presence of different osmolytes suggest that these stabilizing additives may not always exhibit their stabilizing effect uniformly across all the three phases of aggregation.

3.5 Extent of aggregation

Although mannitol increases the growth rate of aggregates, the extent of aggregation is almost similar (slightly lower) to that in the absence of any additive (Fig. 2). Comparing the case of sucrose and ethylene glycol, we find that although aggregation reaches completion much faster in ethylene glycol, the extent of aggregation is far lesser in ethylene glycol. The least aggregation in the presence of ethylene glycol occurs despite its lowest viscosity – a situation which should favour the collision of molecules with each other, ultimately leading to greater number of aggregated species. However, such is not the case, hinting that the formation of aggregates is not remarkably governed by the viscosity of the medium, as is the lag time too. The additives affect the different phases of aggregation to different extents.

3.6 Morphology of the aggregates in the presence and absence of additives

ThT stained aggregates of insulin showed a distinct fibrillar morphology in the absence of any additive (Fig. 5). In the presence of the additives, fine changes in the morphology could be observed, although the morphology was essentially fibrillar in nature for all the additives. Fibrils formed in mannitol were slightly thicker than those formed in the presence of sucrose. The fibrils formed in ethylene glycol were significantly longer and fewer in number.
image file: c5ra27206h-f5.tif
Fig. 5 Fluorescence microscopy images of ThT stained aggregates of insulin formed in (A) the absence of any additive and in the presence of (B) 0.15 M mannitol (C) 0.15 M sucrose (20× magnification) (D) 0.15 M ethylene glycol ​(10× magnification).

3.7 Kinetics of aggregation under the condition of same solvent viscosity

To separate the effect of viscosity and the chemistry of the substance, the kinetics of aggregation was also observed in the presence of the above same additives, but at concentrations where the viscosities of all the additives were nearly the same (Table 1). Fig. 6 shows the kinetic profiles of aggregation in additives with similar viscosity. Even at the same viscosity, the different phases are affected to different extents, confirming the role of the intrinsic nature of these additives. Similar to that observed in the presence of 0.15 M additives, the lag time increases for all the additives. The increase is minimal for mannitol. Mannitol increases the kapp, while ethylene glycol and sucrose decreases the kapp. Consistently, the Amax is also the highest for mannitol, and is the least for ethylene glycol. It is quite evident that the viscosity of the medium does not interfere in the nucleation process to a large extent. In fact, a decrease in viscosity decreases the lag time only in case of ethylene glycol (Table 1). For all other additives, the lag time changes only marginally. The total time of aggregation is maximum in the presence of ethylene glycol, along with the least aggregation in its presence. It is worth noting that a higher concentration of ethylene glycol delays the growth of aggregates to a large extent, although the final extent of aggregation is quite similar at both the concentrations. This might provide insights into having a mild control upon the aggregation. Alternatively, it can also be said that the inhibition of the growth of the aggregates requires a much higher concentration of ethylene glycol than the inhibition of the nucleation. It seems that the effects observed could be an integrated effect of the chemistry of the additive and its particular concentration.
image file: c5ra27206h-f6.tif
Fig. 6 Aggregation kinetics of insulin (25 mM HCl, 0.1 M NaCl, pH 1.6) in the presence of different additives. The concentrations of the additive are such that the viscosity of the medium is same.

3.8 Activation energy of aggregation of insulin in the presence of additives

The kinetics of aggregation in the presence of additives was monitored at different temperatures, and the kinetic parameters were used to calculate the activation energies of nucleation and elongation, using Arrhenius plot of log(1/tlag) or log(kapp) versus 1/T. An Arrhenius plot of log(1/tlag) or log(kapp) in absence/presence of any additive showed a strong linear correlation with 1/T. The variation in the lag time and the apparent growth rate at different temperatures, and the pre-exponential factors and activation energies are listed in Tables 2 and 3. Table 3 shows that the activation energy for nucleation increases for all the additives. Activation energy for elongation increases for all additives except mannitol. It is interesting to note that although the change in the lag time in presence of ethylene glycol and sucrose is much more drastic in comparison to that of mannitol, the activation energy for nucleation is nearly the same for all the additives. The activation energy for the growth phase, on the other hand, is unique to a particular additive.
Table 2 Kinetic parameter, (tlag/min) and (kapp/min−1) of the aggregation of insulin (15 μM) in the absence/presence of additives as a function of temperature. The additives were at the following concentrations-0.92 M ethylene glycol, 0.3 M mannitol, 0.15 M sucrose
Temperature (K) No additive Ethylene glycol Mannitol Sucrose
tlag/min kapp/min−1 tlag/min kapp/min−1 tlag/min kapp/min−1 tlag/min kapp/min−1
330 31.6 (±0.03) 0.138 (±0.010) 104.00 (±2.11) 0.034 (±0.007) 52.3 (±1.62) 0.152 (±0.011) 88.9 (±2.04) 0.063 (±0.006)
333 23.4 (±0.5) 0.147 (±0.005) 59.6 (±2.05) 0.041 (±0.005) 38.6 (±1.50) 0.218 (±0.008) 49.8 (±1.2) 0.087 (±0.004)
336 19.8 (±0.07) 0.217 (±0.006) 37.6 (±1.09) 0.065 (±0.002) 24.1 (±0.06) 0.238 (±0.010) 28.6 (±0.04) 0.174 (±0.006)
339 15.0 (±0.07) 0.361 (±0.009) 34.2 (±0.09) 0.129 (±0.008) 17.9 (±0.08) 0.384 (±0.015) 24.7 (±0.05) 0.312 (±0.003)


Table 3 Parameters for the formation of a transition state during the catalytic growth of insulin aggregates. The additives were at the following concentration: (1) 0.92 M ethylene glycol (2) 0.3 M mannitol (3) 0.15 M sucrose
Ea (kJ mol−1) No additive Ethylene glycol Mannitol Sucrose
Lag phase 8.9 ± 0.66 14.2 ± 2.73 13.8 ± 0.90 16.4 ± 2.65
Growth phase 12.2 ± 2.71 16.7 ± 3.01 10.7 ± 1.91 20.4 ± 2.09
ln A
Lag phase 23.6 ± 1.97 38.5 ± 8.19 37.7 ± 2.71 45.4 ± 7.95
Growth phase 34.8 ± 8.11 47.1 ± 9.00 30.6 ± 5.71 58.9 ± 6.27


3.9 Fluorescence spectroscopy of insulin in presence of additives

The fluorescence spectrum of ANS bound to insulin shows a drastic increase in its intensity, accompanied by a concomitant blue shift, than free ANS in 25 mM HCl, 0.1 M NaCl. Thus, under conditions of low pH (pH 1.6), insulin provides considerable hydrophobic regions, to which ANS can bind to. Thermal unfolding of insulin shows a gradual decreases in the fluorescence intensity of ANS, showing lesser affinity of ANS for the non-native protein (Fig. 7). Fig. 8 shows a comparison of the ANS fluorescence spectra of insulin at 298 K and 333 K. The spectrum at 333 K, showing reduced ANS fluorescence corresponds to the structure in which the tertiary structure is substantially lost. However, as evident from Fig. 8, this temperature-induced conformational change was the most sluggish in ethylene glycol demonstrating that it is the most effective in holding back the protein in its native state at a high temperature. It should be noted that this decrease in ANS fluorescence intensity during thermal unfolding is in contrast to what has been observed during insulin aggregation,40 implying that although ANS has reduced affinity for the aggregation competent species, it has higher affinity for the aggregates themselves.
image file: c5ra27206h-f7.tif
Fig. 7 Fluorescence spectra of ANS in the presence of insulin (15 μM) in 25 mM HCl (pH 1.6), 0.1 M NaCl, from 283 K to 363 K.

image file: c5ra27206h-f8.tif
Fig. 8 Change in the fluorescence spectra of ANS in the presence of insulin (15 μM) in 25 mM HCl (0.1 M NaCl, pH 1.6), at 333 K in the absence of additive (A) and in 0.15 M mannitol (B), 0.15 M sucrose (C) and 0.15 M ethylene glycol (D).

3.10 Effect of NaCl on the aggregation of insulin in the presence of different additives

Electrostatic interactions are known to play an important role in the aggregation of proteins, and insulin is no exception. The aggregation of insulin in the absence of NaCl has been found to be negligible under our experimental conditions. However, the same in the presence of 100 mM salt shows a rapid and considerable aggregation. This has been attributed to the masking of the charges by NaCl which in turn diminishes the repulsive forces amongst the protein molecules, helping them to come closer to each other, resulting in aggregation.51 On decreasing the concentration of NaCl to 56 mM, a clear increase in the lag time and a decrease in the extent of aggregation could be seen. This suggests that the repulsive interactions decrease with increasing concentration of salt (Fig. 9).
image file: c5ra27206h-f9.tif
Fig. 9 Aggregation of insulin (34 μM) in the presence of different concentration of NaCl in the absence of any additive (A) and in the presence of (B) 0.15 M mannitol (C) 0.15 M ethylene glycol (D) 0.15 M sucrose.

Since a change of the electrostatic interactions enhanced all the major parameters of aggregation, it was worth investigating the effect of these additives in modulating the same. Sucrose and ethylene glycol were still better inhibitors than mannitol at all the salt concentrations tested (Fig. 9). A two fold increase in the concentration of salt decreased the lag time by 34.6% in absence of any additive. However, the lag time decreased by 29.6%, 43.5% and 56.1% in the presence of mannitol, sucrose and ethylene glycol, respectively. The extent of aggregation was minimum in the presence of ethylene glycol in all the salt concentrations studied.

3.11 Effect of pH on the aggregation of insulin in the presence of additives

The aggregation of insulin was studied at pH 4 and pH 7 also.

The aggregation at pH 4 (Fig. 10) was remarkably slower than the aggregation at pH 1.6. The lag time of aggregation increased from 23 minutes to 85 minutes, while the rate of growth of aggregates decreased from 0.147 min−1 to 0.076 min−1. Even at pH 4, ethylene glycol seems to be the best inhibitor amongst the three additives used. All the additives increased the lag time of aggregation, and decreased the extent of aggregation. However, the rate of growth of aggregates was not greatly affected at this pH.


image file: c5ra27206h-f10.tif
Fig. 10 Aggregation of (A) 15 μM insulin at pH 4 and (B) 25 μM insulin at pH 7 in 0.1 M NaCl in the presence of different additives at 333 K, inset: aggregation of 15 μM at pH 7 (333 K).

The aggregation propensity of insulin at neutral pH is extremely low (Fig. 10). No detectable aggregates were found up to 5 hours. In order to bring the aggregation under measurable time scales, a higher concentration (25 μM) of insulin was used. Even at this concentration, the lag time was longer (73 minutes) and growth rate was slower (0.0408 min−1) than the aggregation at pH 1.6. All the additives increase the lag time of aggregation at this pH also. The maximal increase was seen for ethylene glycol. In addition, the growth rate was also considerably slow in its presence with respect to that in its absence.

4. Discussion

The kinetic data that we obtained has a good fit to eqn (1). Moreover, the apparent rate constant of the aggregation has a linear dependency on the concentration of insulin (Fig. 11 and Table 4). The linear dependency of the rate constant, kapp, in eqn (1) can be arrived at by considering two rate constants, k1 and k2- the rate constant for the growth of aggregates and the formation of new aggregates, respectively, both leading to the aggregation of the protein in co-operation with each other.48 The growth rate (k1) of the total mass of aggregated protein is proportional to the number of aggregate ends and the monomer concentration. k2 corresponds to a process where new aggregates are created by a spontaneous nucleation mechanism in a pathway where the rate is dependent on the total mass of the aggregated protein molecules. In such a situation, the apparent rate constant can be represented as
 
image file: c5ra27206h-t4.tif(4)
where c0 is the initial protein concentration. This explains the dependence of kapp on the initial concentration of insulin.

image file: c5ra27206h-f11.tif
Fig. 11 (A) Insulin aggregation as a function of insulin concentration at 333 K in 25 mM HCl (pH 1.6) and 0.1 M NaCl. (B) Dependence of the apparent rate constant on the concentration of insulin. The red line is the linear fit to the data points. (C) Linear dependence of the scattering at 600 nm to the concentration of protein (D) plot of the log(lag time) versus log(concentration of insulin) to estimate the size of nucleus.
Table 4 Change in various kinetic parameters of insulin aggregation as a function of insulin concentration at 333 K in 25 mM HCl (pH 1.6) and 0.1 M NaCl
Concentration (μM) kapp (min−1) tlag (min) Amax
9 0.059 ± 0.01 52.4 ± 2.62 0.015 ± 0.092
12.5 0.109 ± 0.008 43.4 ± 2.54 0.063 ± 0.005
15 0.147 ± 0.005 23.4 ± 0.5 0.104 ± 0.015
30 0.282 ± 0.009 18.7 ± 1.5 0.139 ± 0.017
40 0.413 ± 0.021 18.5 ± 0.91 0.216 ± 0.008


The attainment of the aggregation prone, partially unfolded form of insulin is found to be reversible as depicted by its CD spectra. The CD spectra of insulin heated to 333 K, when cooled back to 298 K, showed the same secondary structural content confirming the reversibility of the unfolding step (Fig. S3). At 333 K, no noticeable change was observed in the secondary structure upto 120 min. However, after 120 minutes, there was a steady decrease in the secondary structural content, reflecting the process of aggregation (Fig. S3). The fact that no change in the secondary structural content was observed upto 120 minutes leads us to conclude that the process of unfolding is faster than the process of aggregation. We also checked the reversibility of the aggregation process at different points of the aggregation profile. Aggregation was found to be almost irreversible beyond the lag phase (Fig. S4). Based on this, and the analysis of the kinetic profile of insulin aggregation, the mechanism of aggregation can be remodeled as shown in Scheme 1.


image file: c5ra27206h-s1.tif
Scheme 1

Native insulin (N) at pH 1.6 can exist in equilibrium with its aggregation prone form A (step 1). CD profiles at 333 K suggest that it is the partially-unfolded form of insulin that is the aggregation-competent state (A). There is a substantial loss in the CD signal at 222 nm, and a minor loss at 208 nm for A (Fig. 1). The binding affinity of the conformational form (A) towards ANS is lower than that of the native state (N), as seen from Fig. 7. Form A then forms An (step 2), the nucleus in the aggregation reaction, and this step is unfavorable.

The first two steps of the above scheme (Scheme 1) constitute the nucleation process. Assuming the second step to be essentially irreversible, the observed rate constant of nucleation will be equal to k2K2, according to Scheme 1, where K is the equilibrium constant of step 1 and k2 is the rate constant of step 2. Thus, the activation energy of the nucleation step (Ea,N) will be equal to the activation energy for step 2 (Ea,2) plus twice the enthalpy change (ΔH) for step 1, i.e. Ea,N = 2(ΔH) + Ea,2. Nucleus An undergoes polymerization to form the insoluble aggregates A3, A4…Am, composed of m units, in an irreversible reaction. The dependence of the lag time on the concentration of the protein can give us an estimate of the number of species involved in the formation of the nucleus. This profile, for the aggregation of insulin under our experimental conditions, gives a curved plot, suggesting that the lag time becomes independent of the concentration after a certain insulin concentration (Fig. 11). A linear fitting of the straight region of the curved plot gives a slope of 1.45. Accordingly, the size of the nucleus,52,53 n′, will be 2x(slope) − 1 ≈ 2. A plateau at higher concentration suggests the existence of a supercritical concentration for the aggregation of insulin, the super critical concentration being the point beyond which the lag time is independent of the concentration of the protein.

The net process of the aggregation of insulin can be divided into three stages, viz. unfolding to the aggregation prone conformation, formation of the nucleus, and growth of the aggregates. An additive can affect the aggregation propensity by affecting any of the steps shown in Scheme 1. The effect of these compounds on the lag time, the apparent growth rate, and the final turbidity suggests that these additives have the potential to interfere with both pre-nucleation and post-nucleation processes.

The addition of mannitol leads to an enhanced insulin aggregation; that is, mannitol seems to favour the process. However, mannitol delays the aggregation process to some extent by delaying the commencement of the growth of aggregates. A probable scheme for the change in the aggregation pathway in presence of mannitol is shown in Fig. 12. The activation energy for nucleation is found to increase by the addition of mannitol (Table 3). This means that mannitol either affects the ΔH, or the Ea,2, or both. CD spectrum of insulin in the presence of mannitol indicates stabilization of the native state (promotes a more folded conformation). The aggregation prone state, A, however shows a slight decrease in the CD signal in presence of mannitol, with a little retention of the helicity, as seen from Fig. 4. Simultaneously, it can also be seen that the protein gains a certain content of beta sheet character which is close to that attained in its absence (Fig. 4). The destabilization increases the enthalpy (ΔH) for the formation of the A state. Ea,2 decreases, but the increase in ΔH compensates for this loss. The growth rate (kapp) of the aggregates in presence of mannitol increases, along with a subsequent decrease in the activation energy. This might result from the destabilization (higher energy) of the nucleus An by mannitol. The increased propensity to aggregate can then be explained by destabilization of the intermediates A3, A4…An by mannitol.


image file: c5ra27206h-f12.tif
Fig. 12 Modulation of the energy profile in the presence of mannitol.

Addition of sucrose is accompanied by an increase in activation energy for both nucleation and growth of aggregates. Similar to mannitol, sucrose also shows stabilization of the native state, giving it a more folded conformation. However, unlike mannitol, the protein loses only a very nominal amount of its helical character (and concomitantly gains very little beta-like character) even at the temperature of aggregation. Stabilization of both the native state (N) and the A state, may or may not decrease the ΔH of the first step, but definitely increases the activation energy for the formation of the nucleus An, resulting in a net increase in the activation energy (Table 3). A comparison of the CD spectrum of insulin in presence and absence of sucrose at 333 K shows a slight negative peak at 208 nm, with no change in the peak at 222 nm. Sucrose has been known to stabilize proteins via the mechanism of preferential exclusion, and the same might be applicable in our case. The preferential exclusion of sucrose from the vicinity might also stabilizes the intermediates A3, A4…An, which in turn increases the activation energy of the growth process, as shown in Fig. 13. Sucrose however does not stabilize the aggregates as mannitol does.


image file: c5ra27206h-f13.tif
Fig. 13 Modulation of the energy profile in the presence of ethylene glycol and sucrose.

The behaviour of ethylene glycol is found to be similar to that of sucrose. At a concentration of 0.92 M, ethylene glycol increases the lag time and decreases the kapp and the extent of aggregation. At lower concentrations of ethylene glycol, the rate of aggregation is similar to that in its absence (Fig. 2 and Table 1), although the increase in lag time and the decrease in the extent of aggregation is quite remarkable. As already mentioned, inhibition of the growth rate of insulin aggregates requires a far higher concentration of ethylene glycol than what is required to increase the lag time. This suggests that the interactions between the native/aggregation prone state of insulin and ethylene glycol is different from the interactions between ethylene glycol and higher aggregates of insulin. Ethylene glycol seems to be the most effective inhibitor of aggregation, amongst the additives used here, as evident from Fig. 2. The apparent mode of stabilization seems similar to that of sucrose (Fig. 13). Ethylene glycol stabilizes the native state (N) as well as the A state. However, as seen from the CD spectrum, the extent of stabilization of the A state is much higher than that of sucrose (Fig. 2). This additive in fact introduces substantial helicity to the A state, with prominent peaks emerging at 222 nm and 208 nm, as opposed to that in absence of ethylene glycol. The ANS fluorescence spectrum also reveals that the aggregation prone state (A) in presence of ethylene glycol has a similar affinity for ANS, as the native state in ethylene glycol (N) (Fig. 8). The extent of decrease in ANS fluorescence is the least as compared to the other additives. Ethylene glycol, thus plays an important role in hindering the formation of the aggregation prone state. This decreases the ΔH of the first step. In spite of this, the immense stabilization of the A state through the introduction of the secondary structure renders the activation energy for the second step extremely high (Fig. 13). This in fact, surpasses the decrease in enthalpy, resulting in a net increase in the activation energy for nucleation. Further stabilization of the nucleus and the higher aggregates also occur by binding to these species, resulting in increased activation energy for the growth process. The resulting aggregates are less stable in presence of ethylene glycol.

Osmolytes are widely known to stabilize via the preferential exclusion of the co-solute from the surface of the protein – a situation which is energetically unfavourable. Since the surface area of an unfolded monomer will be larger than a folded native protein, the unfolded state will have to undergo a larger exclusion of the co-solute. Collectively, difference of energies between the two states (native and unfolded) increases drastically in the presence of such co-solutes. The scenario during the aggregation is slightly different. The available surface area per monomer decreases in the aggregated state than in the native state, as a result of which the free energy difference between the native and the aggregated state decreases.54

If such be the case, all the osmolytes used in these study should have shown an enhanced aggregation. The fact that this is not observed, strongly suggests that the nature of the interactions of the osmolytes change along the aggregation pathway. Sucrose and ethylene glycol render similar delay in the lag time (than that in their absence), yet, the extent of aggregation is more in sucrose than in ethylene glycol. Thus, although the nature of interaction is similar with the aggregation prone state (both are seen to decrease the population of the aggregation prone partially unfolded form), ethylene glycol stabilizes the aggregates to a far lesser extent than sucrose. Further, it can be seen that the extent of aggregation shows a relatively small decrease (from 0.031 to 0.024) for a huge increase in the concentration (from 0.15 M to 0.92 M) of ethylene glycol. Increasing the concentration of ethylene glycol effectively delays the process of aggregation, but does not contribute much in decreasing the extent of aggregation. On the other hand, a two fold increase in the concentration of mannitol brings about a remarkable increase in the extent of aggregation, although the lag time at both the concentrations are nearly the same. It is apparent that ethylene glycol can be used for mild control of the aggregation. It is also apparent that different additives can be used to enhance or inhibit the aggregation. On one hand, ethylene glycol can be used to inhibit the aggregation, whereas on the other hand, mannitol can be used to enhance aggregation. Our result supports an intricate interplay of the physico-chemical properties of the additives and the different species of aggregation. Our results are summarized in Table 5.

Table 5 Summarization of the effect of the additives on the various stages
Step Mannitol Ethylene glycol/sucrose
N → A Stabilization Stabilization
A → An Destabilization Stabilization
An → An Destabilization Stabilization
An → An+1 Destabilization Stabilization
An+1 → → Am Stabilization Destabilization


All the three additives used in this study have ample hydroxyl groups. These hydroxyl groups have the potential to interact with the various polar groups present in the protein. This should result in a similar overall effect conferred by the additives. However, our study clearly demonstrates that this is not the case. This means that inspite of some common features, these additives cannot interfere similarly in the aggregation process. The ability of these additives to be involved in polar interactions with protein might prevent the interaction of protein molecules with each other, in turn preventing their aggregation. Choudhary et al. have shown that such interactions can indeed hinder the growth of aggregates.39 In this study, mannitol increases the lag time of aggregation, but is not effective in inhibiting the growth or the extent of aggregation. The increase in the lag phase has already been attributed to the attainment of additional secondary structure in the native state, and this holds for both ethylene glycol and sucrose. The lack of inhibition for the growth phase in mannitol could be because of the fact that mannitol is not able to involve in polar interaction with the protein, similar to the effect of sorbitol on the aggregation of insulin.39 On the contrary, sucrose can effectively reduce the rate of growth of aggregates also, suggesting that this additive interacts with the polar groups of the proteins, and prevents the association of the protein molecules with each other. This is valid for the growth of aggregates in ethylene glycol also, although a much higher concentration is required. A probable reason for this could be the lesser number of hydroxyl groups on this additive.

The behaviour of the osmolytes can also be a consequence of their differential interaction with the different amino acids of the protein, or due to the availability/inavailability of certain amino acids in the native state or the unfolded state.55 The interaction of sucrose or ethylene glycol exists in the matured aggregates also, as a result of which the extent of aggregation decreases. In a recent study56 it was found that the carboxyl groups are abundantly present on the surface of insulin fibrils. Other residues found on the insulin fibril surfaces include Tyr, Cys, Phe and Pro. The fact that ethylene glycol and sucrose decrease the extent of aggregation might be closely connected to the interaction of these additives with the residues on the fibril surfaces.

5. Conclusions

Aggregation of insulin proceeds via the formation of a nucleus, accompanied by a considerable lag time before the growth of detectable aggregates can start. The nucleus is formed by the partially unfolded form of the protein. Conventional additives like sucrose and ethylene glycol effectively reduces the aggregation whereas mannitol is not effective in suppressing the overall aggregation. However, it can delay the aggregation process. It should be noted that nucleation and elongation are not affected in a similar manner in any particular additive. In addition, the rate of aggregation and the extent of aggregation may not always be in the same direction, as seen for the case of aggregation 0.15 M ethylene glycol. Finally, we conclude that the ethylene glycol is the most effective inhibitor amongst all the three additives used.

Understanding the behaviour of aggregation is also now gaining importance from the view point of drug delivery. Hydrogels used for drug delivery are recently shifting towards those based on proteins/peptide predominantly due to their easy degradability and higher biocompatibility.57 The additives used in this study render different stability to the aggregates themselves as seen in the energy diagram. The kinetics of the formation of the aggregates and their thermodynamic stability can be combined together for application in protein/peptide based hydrogels.

Acknowledgements

SD thanks Council of Scientific and Industrial Research (CSIR), India, for providing the necessary funds to carry out the above research. SS thanks CSIR for the fellowship. AS thanks the Indian Institute of Technology, Delhi, for the fellowship. SS thanks DietY for the usage of the DLS instrument.

References

  1. V. N. Uversky and A. L. Fink, Biochim. Biophys. Acta, Proteins Proteomics, 2004, 1698, 131 CrossRef CAS PubMed.
  2. R. Walder and D. K. Schwartz, Soft Matter, 2011, 7, 7616 RSC.
  3. A. L. Fink, Acc. Chem. Res., 2006, 39, 628 CrossRef CAS PubMed.
  4. V. N. Uversky, J. Li and A. L. Fink, J. Biol. Chem., 2001, 276, 10737 CrossRef CAS PubMed.
  5. V. N. Uversky, J. Li and A. L. Fink, J. Biol. Chem., 2001, 276, 44284 CrossRef CAS PubMed.
  6. A. Ahmad, V. N. Uversky, D. Hong and A. L. Fink, J. Biol. Chem., 2005, 280, 42669 CrossRef CAS PubMed.
  7. N. K. Holm, S. K. Jespersen, L. V. Thomassen, T. Y. Wolff, P. Sehgal, L. A. Thomsen, G. Christiansen, C. B. Andersen, A. D. Knudsen and D. E. Otzen, Biochim. Biophys. Acta, Bioenerg., 2007, 1774, 1128 CrossRef CAS PubMed.
  8. S. Srisailam, H. M. Wang, T. K. Kumar, D. Rajalingam, V. Sivaraja, H. S. Sheu, Y. C. Chang and C. Yu, J. Biol. Chem., 2002, 277, 19027 CrossRef CAS PubMed.
  9. C. B. Andersen, H. Yagi, M. Manno, V. Martorana, T. Ban, G. Christiansen, D. E. Otzen, Y. Goto and C. Rischel, Biophys. J., 2009, 96, 1529 CrossRef CAS PubMed.
  10. A. T. Sabareesan and J. B. Udgaonkar, Biochemistry, 2014, 53, 1206 CrossRef CAS PubMed.
  11. J. Goers, S. E. Permyakov, E. A. Permyakov, V. N. Uversky and A. L. Fink, Biochemistry, 2002, 41, 12546 CrossRef CAS PubMed.
  12. R. Khurana, J. R. Gillespie, A. Talapatra, L. J. Minert, C. Ionescu-Zanetti, I. Millett and A. L. Fink, Biochemistry, 2001, 40, 3525 CrossRef CAS PubMed.
  13. S. Saha and S. Deep, J. Phys. Chem. B, 2014, 118, 9155 CrossRef CAS PubMed.
  14. V. Vetri, C. Canale, A. Relini, F. Librizzi, V. Militello, A. Gliozzi and M. Leone, Biophys. Chem., 2007, 125, 184 CrossRef CAS PubMed.
  15. M. Stefani, Biochim. Biophys. Acta, Mol. Basis Dis., 2004, 1739, 5 CrossRef CAS PubMed.
  16. C. S. Atwood, R. L. Bowen, M. A. Smith and G. Perry, Brain Res. Rev., 2003, 43, 164 CrossRef CAS PubMed.
  17. G. Dodson and D. Steiner, Curr. Opin. Struct. Biol., 1998, 8, 189 CrossRef CAS PubMed.
  18. S. I. Cohen, M. Vendruscolo, M. E. Welland, C. M. Dobson, E. M. Terentjev and T. P. Knowles, J. Chem. Phys., 2011, 135, 065105 CrossRef PubMed.
  19. S. I. Cohen, M. Vendruscolo, C. M. Dobson and T. P. Knowles, J. Mol. Biol., 2012, 421, 160 CrossRef CAS PubMed.
  20. S. I. A. Cohen, S. Linse, L. M. Luheshi, E. Hellstrand, D. A. White, L. Rajah, D. E. Otzen, M. Vendruscolo, C. M. Dobson and T. P. J. Knowles, Proc. Natl. Acad. Sci. U. S. A., 2013, 110, 9758 CrossRef CAS PubMed.
  21. S. I. A. Cohen, M. Vendruscolo, C. M. Dobson and T. P. J. Knowles, in Amyloid Fibrils and Prefibrillar Aggregates, Wiley-VCH Verlag GmbH & Co. KGaA, 2013, p. 183 Search PubMed.
  22. P. Arosio, M. Vendruscolo, C. M. Dobson and T. P. Knowles, Trends Pharmacol. Sci., 2014, 35, 127 CrossRef CAS PubMed.
  23. J. M. Khan, S. K. Chaturvedi, S. K. Rahman, M. Ishtikhar, A. Qadeer, E. Ahmad and R. H. Khan, Soft Matter, 2014, 10, 2591 RSC.
  24. M. Muzaffar and A. Ahmad, PLoS One, 2011, 6, e27906 CAS.
  25. D. Hamada and C. M. Dobson, A publication of the Protein Society, Protein Sci., 2002, 11, 2417 CrossRef CAS PubMed.
  26. E. S. Courtenay, M. W. Capp and M. T. Record Jr, A publication of the Protein Society, Protein Sci., 2001, 10, 2485 CrossRef CAS PubMed.
  27. L. R. Nemzer, B. N. Flanders, J. D. Schmit, A. Chakrabarti and C. M. Sorensen, Soft Matter, 2013, 9, 2187 RSC.
  28. S. Siddhanta, I. Barman and C. Narayana, Soft Matter, 2015, 11, 7241 RSC.
  29. J. N. Webb, S. D. Webb, J. L. Cleland, J. F. Carpenter and T. W. Randolph, Proc. Natl. Acad. Sci. U. S. A., 2001, 98, 7259 CrossRef CAS PubMed.
  30. J. C. Lee and S. N. Timasheff, J. Biol. Chem., 1981, 256, 7193 CAS.
  31. A. Nayak, C. C. Lee, G. J. McRae and G. Belfort, Biotechnol. Prog., 2009, 25, 1508 CrossRef CAS PubMed.
  32. L. Fei and S. Perrett, Int. J. Mol. Sci., 2009, 10, 646 CrossRef CAS PubMed.
  33. B. Ahmad and L. J. Lapidus, J. Biol. Chem., 2012, 287, 9193 CrossRef CAS PubMed.
  34. F. L. Palhano, J. Lee, N. P. Grimster and J. W. Kelly, J. Am. Chem. Soc., 2013, 135, 7503 CrossRef CAS PubMed.
  35. H. J. Wobst, A. Sharma, M. I. Diamond, E. E. Wanker and J. Bieschke, FEBS Lett., 2015, 589, 77 CrossRef CAS PubMed.
  36. Z. Gazova, K. Siposova, E. Kurin, P. Mucaji and M. Nagy, Proteins, 2013, 81, 994 CrossRef CAS PubMed.
  37. W. Dzwolak, S. Grudzielanek, V. Smirnovas, R. Ravindra, C. Nicolini, R. Jansen, A. Loksztejn, S. Porowski and R. Winter, Biochemistry, 2005, 44, 8948 CrossRef CAS PubMed.
  38. S. Grudzielanek, V. Smirnovas and R. Winter, J. Mol. Biol., 2006, 356, 497 CrossRef CAS PubMed.
  39. S. Choudhary, N. Kishore and R. V. Hosur, Sci. Rep., 2015, 5, 17599 CrossRef CAS PubMed.
  40. L. Nielsen, R. Khurana, A. Coats, S. Frokjaer, J. Brange, S. Vyas, V. N. Uversky and A. L. Fink, Biochemistry, 2001, 40, 6036 CrossRef CAS PubMed.
  41. J. Brange, L. Andersen, E. D. Laursen, G. Meyn and E. Rasmussen, J. Pharm. Sci., 1997, 86, 517 CrossRef CAS PubMed.
  42. F. E. Dische, C. Wernstedt, G. T. Westermark, P. Westermark, M. B. Pepys, J. A. Rennie, S. G. Gilbey and P. J. Watkins, Diabetologia, 1988, 31, 158 CrossRef CAS PubMed.
  43. P. Westermark and E. Wilander, Diabetologia, 1983, 24, 342 CrossRef CAS PubMed.
  44. E. J. Nettleton, P. Tito, M. Sunde, M. Bouchard, C. M. Dobson and C. V. Robinson, Biophys. J., 2000, 79, 1053 CrossRef CAS PubMed.
  45. A. Ahmad, I. S. Millett, S. Doniach, V. N. Uversky and A. L. Fink, Biochemistry, 2003, 42, 11404 CrossRef CAS PubMed.
  46. A. Ahmad, I. S. Millett, S. Doniach, V. N. Uversky and A. L. Fink, J. Biol. Chem., 2004, 279, 14999 CrossRef CAS PubMed.
  47. Q. X. Hua and M. A. Weiss, J. Biol. Chem., 2004, 279, 21449 CrossRef CAS PubMed.
  48. F. Librizzi and C. Rischel, A publication of the Protein Society, Protein Sci., 2005, 14, 3129 CrossRef CAS PubMed.
  49. N. J. Kavimandan, E. Losi, J. J. Wilson, J. S. Brodbelt and N. A. Peppas, Bioconjugate Chem., 2006, 17, 1376 CrossRef CAS PubMed.
  50. F. Librizzi, R. Carrotta, D. Spigolon, D. Bulone and P. L. San Biagio, J. Phys. Chem. Lett., 2014, 5, 3043 CrossRef CAS PubMed.
  51. A. K. Buell, P. Hung, X. Salvatella, M. E. Welland, C. M. Dobson and T. P. Knowles, Biophys. J., 2013, 104, 1116 CrossRef CAS PubMed.
  52. F. Ferrone, Methods Enzymol., 1999, 309, 256 CAS.
  53. M. F. Bishop and F. A. Ferrone, Biophys. J., 1984, 46, 631 CrossRef CAS PubMed.
  54. S. Ohtake, Y. Kita and T. Arakawa, Adv. Drug Delivery Rev., 2011, 63, 1053 CrossRef CAS PubMed.
  55. P. Bruzdziak, B. Adamczak, E. Kaczkowska, J. Czub and J. Stangret, Phys. Chem. Chem. Phys., 2015, 17, 23155 RSC.
  56. D. Kurouski, T. Deckert-Gaudig, V. Deckert and I. K. Lednev, Biophys. J., 2014, 106, 263 CrossRef CAS PubMed.
  57. A. M. Jonker, D. W. P. M. Löwik and J. C. M. van Hest, Chem. Mater., 2012, 24, 759 CrossRef CAS.

Footnotes

Electronic supplementary information (ESI) available. See DOI: 10.1039/c5ra27206h
Equal contribution.

This journal is © The Royal Society of Chemistry 2016
Click here to see how this site uses Cookies. View our privacy policy here.