
Direct insight into the nonclassical hydrophobic effect in bile salt:β-cyclodextrin interaction: role of hydrophobicity in governing the prototropism of a biological photosensitizer†
Bijan K. Paul*,
Narayani Ghosh and
Saptarshi Mukherjee*
Department of Chemistry, Indian Institute of Science Education and Research Bhopal, Bhopal Bypass Road, Bhauri, Bhopal 462066, Madhya Pradesh, India. E-mail: saptarshi@iiserb.ac.in; bpaul@iiserb.ac.in
First published on 18th January 2016
Abstract
The interaction of a potent cancer cell photosensitizer, norharmane (NHM) with a series of bile salt aggregates of varying hydrophobicity e.g., sodium deoxycholate (NaDC), sodium cholate (NaC), and sodium taurocholate (NaTC) is investigated. Our spectroscopic results unveil the remarkable modulation of the prototropic equilibrium of NHM within the bile salt aggregates, which is notably favored toward the neutral species of NHM over the cationic counterpart; the results have been aptly rationalized based on the key role of hydrophobic interaction and are reinforced from time-resolved measurements with emphasis on rotational relaxation dynamics. Furthermore, the present work reveals the application of β-cyclodextrin as a potential host for releasing the bile salt-encapsulated drug through an inclusion complex formation with the bile salt monomers. An extensive thermodynamic analysis of the bile salt:βCD inclusion complex formation reveals that the phenomenon is characterized by a dominant enthalpic contribution interpreted on the grounds of “nonclassical” hydrophobic effect, contrary to the conventional case of entropy-driven classical hydrophobic effect.
1. Introduction
Characterization of the interaction of small drug molecules with biological/biomimetic targets has immense significance in modern day research. Research along this direction demands particular attention when related to a detrimental disease given the limited availability of drugs for the treatment of such diseases. The naturally occurring alkaloid β-carbolines have fostered enormous research interest over the last few years owing to their potential medicinal properties. The study of the interaction of β-carbolines as photosensitizers in photodynamic therapy has formed highly prospective research avenues surrounding this class of natural products.1–7 Obviously, such vast range of medicinal and biological properties of β-carbolines demands a detailed probing regarding the interaction of this important class of compounds with biological/biomimetic assemblies and/or drug delivery vehicles.Entrapment of biologically potent drugs within complex biomimetic/supramolecular assemblies offers intriguing research problems to investigate as such organized media can non-covalently bind to a large spectrum of organic compounds without altering the chemical properties.6–8 This in turn advocates for the prospect of applications of various self-organized molecular assemblies in loading, targeted delivery, and biodetoxification of drugs. The present work is focused on exploring the interaction of the cancer cell photosensitizer, norharmane (NHM, Fig. 1) with a series of bile salt aggregates as potential host systems. Bile salts play consequential roles in living systems because of their function in solubilizing fats/fat-soluble substances.9,10 Bile salts consist of a steroidal framework having a convex surface of hydrophobic groups while the hydrophilic moieties are located on a concave surface (Scheme S1 in the ESI (SI)†).11–14 The aggregation behavior of bile salts is known to be inherently complex displaying considerable polydispersity with respect to the dimension and structure of the aggregates.9,11–15 This accounts for the evolution of several arguments in the literature to interpret the aggregation behavior of bile salts.9,15 Bile salt aggregates can offer unique host architecture capable of solubilizing hydrophobic as well as hydrophilic guests as both the primary and secondary aggregates coexist at high concentration with their relative distribution being dependent on the bile salt concentration.9,11–15
 | ||
| Fig. 1 (a) Schematic of cation ⇄ neutral prototropic equilibrium of NHM. Fluorescence spectra of NHM (ca. 2.0 μM, λex = 340 nm) in the presence of varying concentrations of (b) NaDC, (c) NaC, and (d) NaTC. Curves (i) → (xi) correspond to [NaDC] = 0, 3, 5, 7, 9, 11, 12.5, 15, 17.5, 20, 22.5 mM in (b), curves (i) → (xii) correspond to [NaC] = 0, 2, 5, 9, 12.5, 15, 17.5, 20, 22.5, 25, 27.5 mM in (c), and curves (i) → (xii) correspond to [NaTC] = 0, 10, 20, 25, 27.5, 30, 32.5, 37.5, 40, 45, 50 mM in (d). | ||
The present work addresses the study of interaction of NHM with a series of bile salt aggregates of varying hydrophobicity employing sodium deoxycholate (NaDC), sodium cholate (NaC), and sodium taurocholate (NaTC). The field of interaction of β-carbolines with relevant biological and/or biomimicking receptors is still viable to significant expansion. Successful application of supramolecular assemblies, e.g., bile salt aggregates, in site-specific targeted delivery, and biodetoxification of drugs demands meticulous characterization of the interaction of the drug with the concerned host systems. However, the aim of the present work is mainly twofold. Subsequent to the study of interaction of NHM with bile salts, emphasis is rendered on the release of the encapsulated drug following treatment with a natural cyclodextrin, namely, β-cyclodextrin (βCD, Scheme S1 in ESI†). Our spectroscopic results establish the potential applicability of βCD in liberating the bound drug through inclusion complex formation with the bile salt molecules depending on the hydrophobicity of the latter. In this context, we have been particularly motivated by the lacuna surrounding the thermodynamics of βCD–bile salt inclusion complex formation and hence endeavored to delineate the interaction through a detailed isothermal titration calorimetric (ITC) measurement. In general, the inclusion complex formation is found to be characterized by thermodynamic signature of favorable enthalpy and entropy changes. More importantly, the determination of heat capacity changes accompanying the processes unfolds the pivotal role of hydrophobic forces underlying the inclusion complex formation as a function of degree of hydrophobicity of the bile salt assemblies. The apparently paradoxical thermodynamics of the interaction profile has been aptly rationalized on the ground of “nonclassical” hydrophobic effect, an observation rather sporadically addressed in the literature till date. In tune with this, the experimental findings have been rationally corroborated from molecular docking simulation.
2. Experimental
All the materials (e.g., NHM, the bile salts (NaDC, NaC and NaTC), βCD, KI, and phosphate buffer) were purchased from Sigma-Aldrich Chemical Co., USA and used as received. The absorption spectra were measured on a Cary 100 UV-vis spectrophotometer, and the fluorescence emission spectra and steady-state fluorescence anisotropy were recorded on a Fluorolog 3-111 fluorometer. The time-resolved fluorescence decay measurements were carried out by the Time-Correlated Single Photon Counting (TCSPC)16 method using IBH-NanoLED-375L (typical time resolution ∼ 90 ps) as the light source for exciting the samples at λex = 375 nm. A low concentration of NHM (ca. 2.0 μM) has been maintained throughout all the spectroscopic measurements in view of minimizing inner-filter/reabsorption effects.16 The isothermal titration calorimetry (ITC) experiments were carried out on a Nano ITC, TA Instrument. The molecular docking studies were performed on AutoDock 4.2 suite of programs. All the details of the experimental and computational procedures have been elaborated in the ESI.†3. Results and discussion
3.1. Modulation of prototropic equilibrium of NHM upon interaction with bile salts
In aqueous buffer, NHM exhibits two broad bands at λabs ∼ 340 nm and ∼370 nm typical of the spectroscopic signatures for the presence of the neutral and cationic species of NHM, respectively. This is in excellent harmony to numerous literature reports on a variety of β-carboline.1,2,6,7,17 The absorption profile of NHM is found to be only nominally modified following interaction with the bile salt aggregates resulting in slight increment of absorbance with no appreciable shifting of the absorption wavelength (figures not shown) implying no significant perturbation of the ground-state prototropic equilibrium of NHM within the bile salt aggregates. The interaction of NHM with the bile salt aggregates is rather more dramatically manifested from emission spectral study. The emission profile of NHM in aqueous buffer is comprised of a single unstructured band at λem ∼ 450 nm conforming to the characteristic emission band feature for the cationic species of NHM.1,2,6,7,17 As displayed in Fig. 1, the emission profile of the drug (NHM) undergoes remarkable modification following interaction with the studied bile salts in terms of prominent quenching of the cationic fluorescence band at λem ∼ 450 nm, along with the development of a new emission band at λem ∼ 380 nm. In direct analogy to reported literatures, the new emission band at λem ∼ 380 nm is ascribed to the neutral species of NHM.1,2,6,7,17 This can be rationalized from the lowering of polarity around the microheterogeneous environments of the drug within the bile salt aggregates in comparison to bulk aqueous buffer phase.Further, the experimentally obtained emission spectra of NHM in various bile salt aggregates have been resolved into individual Gaussian curves to enable a distinct visualization of the emission band features of the drug. The Gaussian resolution of the emission profile of NHM in aqueous buffer exhibits a single distinct band centered at λem ∼ 450 nm implying the cationic species of NHM only (Fig. S1a†). However, resolution of the emission profiles of NHM in the presence of the bile salts (NaDC, NaC and NaTC) clearly reveals the deconvoluted band features having emission maxima at λem ∼ 380 nm and λem ∼ 450 nm corresponding to the emission of the neutral and cationic forms of NHM, respectively (Fig. S1b–d in ESI†).
The aforementioned discussion articulates that the cation ⇄ neutral prototropic equilibrium of the drug (NHM) is progressively favored toward the neutral species with increasing concentration of all the bile salts under investigation. Fig. 1 evinces a qualitatively analogous pattern of bile salt aggregate-induced modulation of the emission spectra of NHM within the present experimental window, though a quantitative analysis reveals a better insight into the data. To this end, an understanding of the modulation of the cation ⇄ neutral prototropic equilibrium of NHM within the bile salt aggregates has been deduced from the equilibrium constants and free energy changes with varying bile salt concentrations. The equilibrium constant (Keq) can be expressed as Keq = [neutral]/[cation] = Ineutral/Ication within the assumption that the fluorescence intensities of the neutral/cationic prototropic species of NHM are proportional to the concentrations of the respective species (precisely, the validity of the aforementioned equilibrium also warrants the assumption of same oscillator strength for the two transitions. Assuming that the cation and the neutral species are the only relevant forms, this can be comprehensively accounted for based on the decrease in fluorescence intensity and increase in fluorescence intensity for the protonated and neutral species, respectively. At the present stage, we assume same oscillator strength for the two transitions concerned, however, an elaborate verification of the assumption requires meticulous computational analysis which is underway in our lab. Also the concentration of water is assumed to remain invariant in the above expression as it is present in large excess). The free energy change corresponding to the equilibrium is thus given as ΔG = −RT![[thin space (1/6-em)]](https://www.rsc.org/images/entities/char_2009.gif) lnKeq. The variation of Keq and the corresponding ΔG as a function of bile salt concentrations are displayed in Fig. 2 for all the systems under study.
lnKeq. The variation of Keq and the corresponding ΔG as a function of bile salt concentrations are displayed in Fig. 2 for all the systems under study.
 | ||
| Fig. 2 Variation of (a) equilibrium constant (Keq) for the cation ⇄ neutral prototropic transformation of the drug (NHM) and (b) the corresponding free energy changes (ΔG) in different bile salt aggregates as specified in the figure legends. | ||
From Fig. 2a it is evident that neutral species of NHM is preferentially stabilized over the cationic counterpart within the bile salt assemblies, that is, the cation ⇄ neutral prototropic equilibrium is gradually favored toward the neutral species. It is further noted that at the saturation of NHM–bile salt interaction, Keq varies along the sequence NaDC > NaC > NaTC and thereby rendering ΔG to achieve its maximum negative value in NaDC and minimum negative value in NaTC. This probably indicates that the extent of penetration of the drug into the hydrophobic nanocompartments of the bile salt aggregates is not so prominent in the case of NaTC, which in turn can be argued to be due to a stronger electrostatic interaction of the cationic form of NHM with the negatively charged sulfonate moiety present in the headgroup of NaTC. This observation cane be qualitatively paralleled with the preferential stabilization of the cationic species of NHM in anionic surfactant e.g., sodium dodecyl sulfate (SDS).18 Conversely, the maximum magnitude of Keq (and hence the maximum negative value for ΔG) in NaDC can be argued to corroborate to a deeper penetration of the drug into the more hydrophobic nanocavity of NaDC aggregates. The greater hydrophobicity of NaDC than NaC is usually attributed to the lack of an additional hydroxyl group in the steroid ring of NaDC, while the presence of a hydrophilic sulfonate moiety in NaTC is argued to be a significant contributor toward enhancing its hydrophilicity; the order of hydrophobicity along the series is referred to as NaDC > NaC > NaTC.
Qualitatively, the pattern of these observations can be compared with the fluorescence behavior of the drug in a varying composition of water/1,4-dioxane mixture in which the fluorescence spectral profile of NHM in pure water is characterized by an unstructured emission band of the cationic species only (λem ∼ 450 nm) while decreasing polarity of the medium (increasing 1,4-dioxane proportion in the solvent mixture) accompanies a regular quenching of the cationic fluorescence intensity along with a concomitant growth of the neutral fluorescence band at λem ∼ 380 nm (Fig. S2 in ESI†). In pure 1,4-dioxane the fluorescence profile of NHM exhibits the typical characteristic of the neutral emission only. Thus it appears rational to argue that the observed emission behavior of NHM within the bile salt aggregates originates from a reduction of polarity of the drug microenvironment in the vicinity of its binding site.
In this context, it could be pertinent to show the possibility of bile salts as probable drug delivery systems with a well-established drug, in analogy to the drug, NHM which has been used in the present study. To this effect, we have performed a different set of experiments with the well-known antibacterial drug tetracycline (TC) under similar experimental conditions as maintained in our original experiments with NHM. Our results show evidence for binding interaction of the drug TC with a bile salt, namely, sodium deoxycholate (NaDC) as reflected through prominent enhancement of fluorescence intensity of TC coupled with a blue-shift within the bile salt aggregates as compared with bulk aqueous buffer phase. The treatment of the NaDC-bound drug with βCD results in release of the bound drug as manifested through modification of spectral properties in a reverse pattern compared what was found in course of binding interaction. These results are displayed in the ESI (Fig. S3†).
3.2. Steady-state fluorescence anisotropy
The variation of steady-state fluorescence anisotropy (r) of NHM following interaction with the bile salt aggregates is depicted in Fig. S4 of the ESI.† An increasing pattern of fluorescence anisotropy indicates the impartation of motional rigidity on the drug molecules within the nanocompartments of the bile salt aggregates.6,7,16,18 Also it is worth noting in the present context that the fluorescence anisotropy values (r) of the drug vary prominently in different bile salt environments and hence accounts for the differential degrees of motional restriction imposed on the drug molecules in the different assemblies. Thus the drug molecules experience an increasing degree of rigidity along the trend: NaTC < NaC < NaDC. This observation, in tune with the aforementioned discussion, can be rationalized on the basis of differential degrees of penetration of the drug into the hydrophobic interior of the bile salt aggregates and hence the impartation of motional confinement on the rotational degrees of freedom of the drug molecules. This argument is further substantiated from time-resolved fluorescence anisotropy decay results as discussed in a forthcoming section.3.3. Time-resolved fluorescence decay
The modulation in the time-resolved fluorescence decay behavior of the drug following interaction with the bile salt aggregates provides an important window toward an in-depth analysis of the interaction scenario. The typical time-resolved fluorescence decay transients are displayed in Fig. 3 with the corresponding fitting parameters being compiled in Table S1 in ESI.† The drug molecule is found to exhibit a single exponential decay in bulk aqueous buffer having a lifetime of 21.59 ns.1–3,6,7,18,19 The data collected in Table S1† display that within the bile salt aggregates the time-resolved fluorescence decay of NHM is biexponential in nature comprising of a longer (τ1) and a relatively shorter component (τ2). The longer-lived component (τ1) is found to have a lifetime closely proximate to that of the lifetime of NHM in aqueous buffer, which conforms to the typical signature for the cationic species of NHM.1–3,6,7,18,19 In view of the fluorescence lifetime of the neutral species of NHM (∼3.08 ns as recorded in 1,4-dioxane), the relatively faster fluorescence decay component of NHM within the bile salt aggregates (τ2 in Table S1†) may be attributed to the neutral form of the drug. It is imperative to note that the relative amplitude for the lifetime of the cationic species of NHM (longer-lived component, τ1 in Table S1†) is gradually lowered with increasing concentration of the bile salts. This can be comprehensively rationalized on the ground of preferential stabilization of the neutral species of NHM over the cationic counterpart within the bile salt assemblies. In the high concentration regime of bile salt (for example 30 mM), the relative contribution of the longer lifetime component, which is attributed to the cationic species of NHM, is found to be minimum for binding with NaDC aggregates following in order as: NaDC < NaC < NaTC (Table S1,† Fig. 4). This observation suggests that the neutral form of NHM attains maximum degree of stabilization within the more hydrophobic aggregates of NaDC, and minimum stabilization in NaTC aggregates with NaC being in intermediate. Moreover, the higher degree of drug penetration into NaDC aggregate compared to NaC and NaTC (following in order as: NaDC > NaC > NaTC) is distinctly manifested from the variation of the relative amplitudes (α1 and α2) of the slow (τ1) and fast (τ2) decay components as a function of the bile salt concentrations (Fig. 4), which exhibits a sharp variation in α1 (decrease) and α2 (increase) with increasing NaDC concentration and the trend is: NaDC > NaC > NaTC. The present score of observations thus strongly substantiates the basic pattern of findings obtained from steady-state spectroscopic measurements (Section 3.1). The cation ⇄ neutral prototropic equilibrium of NHM is favored more toward the neutral form within the bile salt aggregates and the hydrophobicity of the microheterogeneous environments play a major role in governing the overall prototropic equilibrium of the drug. | ||
| Fig. 3 Time-resolved fluorescence decay transients of NHM (ca. 2.0 μM, λex = 375 nm) in the presence of various bile salt aggregates studied: (a) NaDC, (b) NaC, and (c) NaTC. Curves (i) → (viii) correspond to [NaDC] = 0, 5, 7.5, 10, 12.5, 15, 17.5, 20 mM in (a), curves (i) → (vi) correspond to [NaC] = 0, 5, 10, 15, 20, 25 mM in (b), and curves (i) → (vi) correspond to [NaTC] = 0, 10, 20, 30, 40, 50 mM in (c). IRF designates the instrument response function. | ||
 | ||
| Fig. 4 Variation of relative amplitudes (α1 and α2) of the slow (τ1) and fast (τ2) decay components of NHM as a function of added bile salt concentrations (NaDC (–●–), NaC (–○–), and NaTC (–■–)). The solid lines provide only a visual guide to the pattern of variation. | ||
3.4. Rotational relaxation dynamics
The time-resolved fluorescence anisotropy decay of NHM in aqueous buffer as well as in the presence of the bile salt aggregates are illustrated in Fig. 5 and the relevant rotational relaxation parameters are compiled in Table 1. | ||
| Fig. 5 Time-resolved fluorescence anisotropy decay transients of NHM (ca. 2.0 μM, λex = 375 nm) in various bile salt aggregates as specified in the figure legend (22 mM NaDC (–○–), 30 mM NaC (–□–), and 30 mM NaTC (–△–)). The inset displays the fluorescence anisotropy decay profile of NHM in aqueous buffer phase (–●–). | ||
The drug (NHM) displays monoexponential anisotropy decay (with a reorientation time, τr ∼ 132 ps) in aqueous buffer while in the presence of the bile salts the decay follows a biexponential pattern consisting of a slow and a fast reorientation time constants. This observation can be readily connected to the occurrence of two dynamical processes on significantly different time scales.7,20–22 That the average rotational correlation time of NHM within the bile salt environments (Table 1) is less than the average fluorescence lifetime in the same justifies the absence of any discernible residual anisotropy in the depolarization profiles of NHM (Fig. 5) confirming that the depolarization is essentially completed within the excited-state lifetime of NHM. The functional form of the biexponential anisotropy decay, r(t), can be represented as:16
 | (1) |
 | (2) |
The data summarized in Table 1 demonstrate that probe molecules are entrapped in motionally confined rigid environments within the bile salt aggregates, the average rotational correlation time (〈τr〉) of NHM in the presence of the bile salts is considerably long (slower motion) in comparison to that in aqueous buffer.7,16,20,21 Furthermore, the generalized order parameter (S) has been calculated here to realize the information about the motional restriction on the drug molecules. The generalized order parameter (S), defined as S2 = α2r, describes the degree of spatial restriction on the bile salt aggregate-bound drug molecules. The physical interpretation of the order parameter (S) can be understood from the following limit: S = 0 corresponds to unrestricted motion while S = 1 implies complete restriction on the motion of the drug molecules. The as-calculated dynamical parameters are collected in Table 1.
In tune with numerous literature reports,7,16,20,21 the observed biexponential anisotropy decay of NHM encapsulated in bile salt aggregates can be rationalized from the two-step and wobbling-in-cone model,20 which suggests that the overall fluorescence depolarization of the bound drug can be described as a complex interplay of three independent motions, namely,7,16,20,21
(i) wobbling of the fluorophore (rw(t)) characterized by a time constant τw,
(ii) translational motion of the fluorophore (rD(t)) along the surface of the bile salt aggregates characterized by a time constant τD, and
(iii) overall rotation of the aggregates (rP(t)) characterized by a time constant τP.
The involvement of several kinds of motions can be invoked to account for the observed deviation of the fluorescence anisotropy decay from a simple monoexponential nature (Fig. 5). According to this model, the faster (τ1r) and slower (τ2r) rotational correlation time constants are expressed as:7,16,20,21
 | (3) |
The semicone angle θw is related to the order parameter (S) according to:7,16,20,21
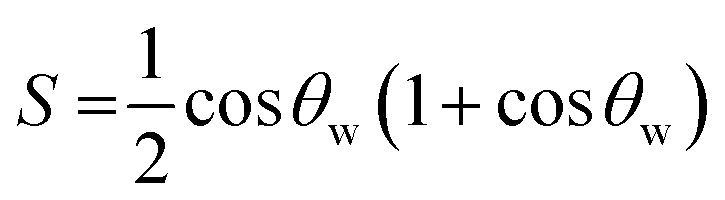 | (4) |
The increasing magnitude of the order parameter (S) within the bile salt aggregates along the trend NaDC > NaC > NaTC (Table 1) is consistent with the notion of increasing degree of motional restriction imposed on the drug molecules within the bile salt aggregates following the aforementioned trend. This inference is further supported from the decreasing trend of the semicone angle θw within the bile salt aggregates along the same sequence, that is, θw is minimum in NaDC and maximum in NaTC with NaC being in between (Table 1).
The wobbling diffusion coefficient (Dw) for NHM in bile salt aggregates can be estimated from the following relationship(s):7,16,20,21
 | (5) |
 | (6) |
Since θw > 30° in the present case (Table 1), eqn (6) is employed for calculation of Dw, Table 1.
3.5. Fluorescence quenching study
The degree of penetration of the drug to the bile salt aggregates can be fruitfully assessed from the differential degrees of iodide ion-induced fluorescence quenching of NHM within the bile salt aggregates. The quenching results are analyzed according to the Stern–Volmer relationship:16
 | (7) |
 | ||
| Fig. 6 Stern–Volmer plots for iodide ion-induced fluorescence quenching of NHM (ca. 2.0 μM, λex = 340 nm) within various bile salt aggregates (NaDC: –●–; NaC: –○–; NaTC: –■–) from (a) steady-state and (b) time-resolved fluorescence quenching experiments. (c) Stern–Volmer plot for steady-state fluorescence quenching of NHM in the presence of varying NaDC concentrations, namely, 5.0 mM (–○–), 10.0 mM (–▲–), 20.0 mM (–■–), and 40.0 mM (–●–). The inset shows the variation of the Stern–Volmer constant (KSV in M−1) as a function of NaDC concentration (in mM). The error bars are within the symbols if not apparently visible. | ||
Further, fluorescence quenching experiments have been performed at various concentrations of the bile salt taking NaDC as a typical example (Fig. 6c). Recently, Miranda et al.22 have demonstrated that the secondary aggregates start to form at ∼10 mM concentration of NaC and the primary aggregates predominate over the secondary aggregates in concentration regime below 25 mM. In this context, it is intriguing to note that the strategy of an extrinsic quencher (e.g., I− ion)-induced fluorescence quenching efficiency for the drug in the presence of varying bile salt concentrations may provide a judicious way toward recognition of formation of primary aggregates of bile salts. The simple notion is that the formation of the primary aggregate is indicated by the steep decrease of KSV values (enhanced protection of the encapsulated drug molecules) with increasing NaDC concentration (Fig. 6c inset). The onset of concentration revealing the instigation of protection of the guest molecule (NHM) implying the formation of the primary aggregate is found to be in well accord with reported literature.22
3.6. Effect of β-cyclodextrin (βCD)
 | ||
| Fig. 7 (a) Fluorescence spectra and (b) time-resolved fluorescence decay transients of NaDC-bound NHM in the presence of varying concentrations of βCD. Curves (i) → (ix) correspond to [βCD] = 0, 3, 5, 8, 10, 12, 14, 18, 20 mM in (a), curves (i) → (vii) correspond to [βCD] = 0, 3, 5, 8, 10, 14, 20 mM in (b). | ||
This observation is corroborated from time-resolved fluorescence spectroscopic results (Fig. 7b for NaDC, and Fig. S6† of the ESI for NaC and NaTC). The time-resolved fluorescence decay parameters (Table S2†) clearly reveal that the relative contribution of the cationic (neutral) form of bile salt-bound NHM progressively increases (decreases) with added βCD. Thus a qualitatively reverse pattern of the observation with respect to what was observed during NHM–bile salt binding interaction can be reasonably rationalized on the basis of the argument of βCD-induced expulsion of the drug molecules from the bile salt aggregates. At this stage, in order to obtain an in-depth understanding of the nature of interaction of the bile salts with βCD, a detailed characterization of the interaction scenario has been carried out by ITC measurements which provide a direct experimental methodology to delve into the thermodynamics of the interaction and hence extract a molecular level interpretation.
:1 stoichiometry (Table 2). The thermodynamics of the inclusion complex formation of bile salt molecules with βCD is believed to be primarily governed by encapsulation of the hydrophobic molecule into the cyclodextrin cavity and hence the accompanying dehydration of the nonpolar surfaces involved in the process.26,31–39 The foundation of the classical hydrophobic effect has subsequently been laid on the concept of release of ordered water molecules (usually referred to as the water of hydrophobic hydration) from the hydrophobic surfaces of the interacting moieties.26,27,31–39 These water molecules of hydrophobic hydration are usually characterized by a high heat capacity and low entropy compared to bulk water.26,27,31–39 Consequently, a classical hydrophobic interaction (in which nonpolar surfaces are shielded from bulk water) is conventionally described by a favorable entropic (ΔS > 0) and unfavorable enthalpic (ΔH > 0) contribution.26,27,31–39 However, an apparently paradoxical situation has been reported, of late, in which enthalpy driven hydrophobic interactions have been observed with small entropic contribution.29,32,40 Nevertheless, a negative change in the heat capacity (ΔCp < 0) has been identified as the thermodynamic signature describing the hydrophobic interaction.29,31–39 In the present investigation we have estimated ΔCp for the interaction of all three bile salts (NaDC, NaC and NaTC) with βCD by exploring the temperature dependence of ΔH (following the standard relationship: δ(ΔH) = ΔCpδT) and the results are collected in Table 2. The instrumental contribution from hydrophobic forces underlying the bile salt:βCD interaction is advocated from a discernible negative value of ΔCp in all the cases under investigation (Table 2). Further, the thermodynamic data (Table 2) evince that the exothermic enthalpy change (ΔH < 0) for the interaction of all three bile salts with βCD essentially constitutes the free energy change (ΔG) of the concerned process with a significantly small entropic contribution (TΔS). Thus, on the contrary to the classical hydrophobic effect (entropy driven process), the inclusion complex formation in the present case can be argued to be a principally enthalpy-driven process (ΔH < 0). This has been recognized in the literature as the ‘nonclassical’ hydrophobic interaction.31–40
 | ||
| Fig. 8 (a) Representative ITC profile for the titration of NaDC with βCD. The top panel shows the integrated heat burst curves at 288 K after correction of heat of dilution. The bottom panel represents the ITC enthalpograms obtained at various temperatures (288 K: –■–, 308 K: –○–, 323 K: –●–, 333 K: –▲–). The solid lines designate the best fit lines to the raw data according to a one set of sites binding model. The power sign convention for heat burst curves in ITC measurement is specified in the experimental section (ESI†) (b) Plot of variation of enthalpy of interaction (ΔH in kJ mol−1) of NaDC (–●–), NaC (–○–) and NaTC (–■–) with βCD as a function of temperature. (c) Plot of variation of relevant thermodynamic parameters (ΔH in kJ mol−1: –●–, TΔS in kJ mol−1: –○–, ΔG in kJ mol−1: –▲–) for NaDC:βCD interaction as a function of temperature. (d) Variation of ΔH with TΔS for NaDC:βCD interaction. The error bars are within the symbol if not apparently visible. | ||
| T (K) | Ka (103 M−1) | n | ΔH (kJ mol−1) | TΔS (kJ mol−1) | ΔG (kJ mol−1) | ΔCp (J mol−1 K−1) |
|---|---|---|---|---|---|---|
| a The error limits are derived from four individual measurements. | ||||||
| NaDC | ||||||
| 288 | 8.99 ± 0.34 | 0.96 ± 0.1 | −18.40 ± 0.76 | 3.41 ± 0.08 | −21.8 | −122.35 ± 4.3 |
| 308 | 6.06 ± 0.27 | 1.01 ± 0.1 | −20.70 ± 0.63 | 1.60 ± 0.06 | −22.30 | |
| 323 | 3.71 ± 0.18 | 1.07 ± 0.1 | −22.22 ± 0.68 | −0.15 ± 0.01 | −22.07 | |
| 333 | 2.94 ± 0.09 | 0.99 ± 0.1 | −24.10 ± 0.8 | −1.98 ± 0.07 | −22.12 | |
|
||||||
| NaC | ||||||
| 288 | 8.57 ± 0.32 | 0.85 ± 0.1 | −15.77 ± 0.53 | 5.92 ± 0.17 | −21.68 | −75.96 ± 1.7 |
| 308 | 5.16 ± 0.25 | 0.97 ± 0.1 | −17.54 ± 0.57 | 4.35 ± 0.16 | −21.89 | |
| 323 | 3.49 ± 0.16 | 0.96 ± 0.1 | −18.49 ± 0.46 | 3.42 ± 0.17 | −21.91 | |
| 333 | 2.36 ± 0.11 | 0.94 ± 0.1 | −19.22 ± 0.53 | 2.28 ± 0.11 | −21.5 | |
|
||||||
| NaTC | ||||||
| 288 | 7.20 ± 0.3 | 0.93 ± 0.1 | −13.71 ± 0.28 | 7.56 ± 0.19 | −21.27 | −57.35 ± 1.02 |
| 308 | 4.68 ± 0.2 | 0.98 ± 0.1 | −14.82 ± 0.30 | 6.82 ± 0.29 | −21.6 | |
| 323 | 2.88 ± 0.13 | 0.91 ± 0.1 | −15.88 ± 0.47 | 5.51 ± 0.31 | −21.39 | |
| 333 | 2.05 ± 0.1 | 0.94 ± 0.1 | −16.20 ± 0.51 | 4.91 ± 0.19 | −21.1 | |
:NaDC host:guest inclusion complex formation, slope = 1.03) implies an almost complete compensation behavior (this is usually observed under the conditions:41–43 ΔCp ≠ 0 and ΔS < ΔCp). The corresponding results for βCD:NaC (slope = 0.96) and βCD:NaTC (slope = 0.92) host:guest inclusion complex formation are displayed in the SI (Fig. S7 and S8†). Of late, the occurrence of EEC has been comprehensively rationalized on the basis of a different Carnot cycle characteristics invoking the notion of interplay of entangled motions of the interacting components, e.g., ligand, solvent and the macromolecule.44 | ||
| Fig. 9 Stereo view of minimum energy docked conformation of NaDC with βCD. | ||
4. Summary and conclusions
The present work articulates a detailed spectroscopic rendition of the interaction of a promising cancer cell photosensitizer (NHM) with a series of bile salt aggregates of varying hydrophobicity employing NaDC, NaC, and NaTC for the purpose. The pivotal role of hydrophobicity in governing the overall photophysics of the drug is quantified by the dependence on the hydrophobicity of bile salts of the equilibrium constant (Keq following the trend NaDC > NaC > NaTC), and free energy change (ΔG) for the cation ⇄ neutral prototropic transformation of NHM. Cumulatively, our steady-state and time-resolved fluorescence data also demonstrate the sensitivity of NHM to recognize the formation of primary aggregates of the bile salts, which is further corroborated from fluorescence quenching experiments.Our efforts further extend to exploring the possibility of using βCD as an efficient host for releasing the drug from the bile salt aggregates. Drawing on this, we have been motivated by the lacuna underlying the bile salt–βCD interaction and studied the thermodynamics of inclusion complex formation by ITC technique. Our extensive ITC analyses reveal the signature of a predominant entropy-driven process of inclusion complex formation coupled with an exothermic enthalpy change, while the key role of hydrophobic effect is demonstrated from heat capacity change. Such apparently paradoxical thermodynamics of the interactions is rationalized on the basis of nonclassical hydrophobic effect. In complementarity, molecular modeling simulation is exploited to explore the probable orientation of the bile salt molecule into the βCD cavity.
Acknowledgements
BKP acknowledges post-doctoral research fellowship from IISER Bhopal, and NG acknowledges CSIR, Govt. of India for a research fellowship. SM thanks DST, Govt. of India for financial assistance.References
- H. Bloom, J. Barchas, M. Sandler and E. Usdin, Progress in Clinical and Biological Research. Beta-carbolines and Tetrahydroisoquinolines, Alan R. Liss Inc., New York, 1982, vol. 90 Search PubMed.
- C. Braestrup, M. Nielsen and C. E. Olsen, Proc. Natl. Acad. Sci. U. S. A., 1980, 77, 2288–2292 CrossRef CAS.
- D. E. J. G. J. Dolmans, D. Fukumura and R. K. Jain, Nat. Rev. Cancer, 2003, 3, 380–387 CrossRef CAS PubMed.
- Photodynamic Therapy: Basic Principles and Clinical Applications, ed. B. Henderson and T. Dougherty, Marcel Dekker Inc., New York, 1992 Search PubMed.
- M. Beljanski and M. S. Beljanski, Exp. Cell Biol., 1982, 50, 79–87 CAS.
- B. K. Paul and N. Guchhait, J. Phys. Chem. B, 2011, 115, 10322–10334 CrossRef CAS PubMed.
- B. K. Paul and N. Guchhait, J. Phys. Chem. B, 2011, 115, 11938–11949 CrossRef CAS PubMed.
- D. De and A. Datta, Langmuir, 2013, 29, 7709–7714 CrossRef CAS PubMed.
- D. M. Small, The Bile Salts, ed. P. P. Nair and D. Kritchevsky, Plenum Press, New York, 1971, vol. 1, pp. 249–256 Search PubMed.
- C. J. O'Connor and R. G. Wallace, Adv. Colloid Interface Sci., 1985, 22, 1–111 CrossRef.
- R. Li, E. Carpentier, E. D. Newell, L. M. Olague, E. Heafey, C. Yihwa and C. Bohne, Langmuir, 2009, 25, 13800–13808 CrossRef CAS PubMed.
- F. L. Devédec, D. Fuentealba, S. Strandman, C. Bohne and X. X. Zhu, Langmuir, 2012, 28, 13431–13440 CrossRef PubMed.
- R. Li, C. S. Santos, T. B. Norsten, K. Morimitsu and C. Bohne, Chem. Commun., 2010, 46, 1941–1943 RSC.
- M. Gomez-Mendoza, M. L. Marin and M. A. Miranda, Org. Biomol. Chem., 2014, 12, 8499–8504 CAS.
- D. M. Small, S. A. Penkett and D. Chapman, Biochim. Biophys. Acta, 1969, 176, 178–189 CrossRef CAS.
- J. R. Lakowicz, Principles of Fluorescence Spectroscopy, Plenum, New York, 3rd edn, 2006 Search PubMed.
- D. Reyman, M. H. Viñas, G. Tardajos and E. Mazario, J. Phys. Chem. A, 2012, 116, 207–214 CrossRef CAS PubMed.
- B. K. Paul, D. Ray and N. Guchhait, J. Phys. Chem. B, 2012, 116, 9704–9717 CrossRef CAS PubMed.
- M. M. Gonzalez, J. Arnbjerg, M. P. Denofrio, R. Erra-Balsells, P. R. Ogilby and F. M. Cabrarizo, J. Phys. Chem. A, 2009, 113, 6648–6656 CrossRef CAS PubMed.
- K. Kinosita, S. Kawato and A. Ikegami, Biophys. J., 1977, 20, 289–305 CrossRef CAS PubMed.
- S. S. White, H. Li, R. J. Marsh, J. D. Piper, N. D. Leonczek, N. Nicolaou, A. J. Bain, L. Ying and D. Klenerman, J. Am. Chem. Soc., 2006, 128, 11423–11432 CrossRef CAS PubMed.
- M. Gomez-Mendoza, M. L. Marin and M. A. Miranda, J. Phys. Chem. Lett., 2011, 2, 782–785 CrossRef CAS.
- A. Román-Guerrero, E. J. Vernon-Carter and N. A. Demarse, TA InstrumentsApplication Note, MCPAN-2010-05.
- A. Karumbamkandathil, S. Ghosh, U. Anand, P. Saha, M. Mukherjee and S. Mukherjee, Chem. Phys. Lett., 2014, 593, 115–121 CrossRef CAS.
- N. Ghosh, R. Mondal and S. Mukherjee, Langmuir, 2015, 31, 1095–1104 CrossRef CAS PubMed.
- K. A. Connors, Chem. Rev., 1997, 97, 1325–1357 CrossRef CAS PubMed.
- Y. Liu, Y.-W. Yang, R. Cao, S.-H. Song, H.-Y. Zhang and L.-H. Wang, J. Phys. Chem. B, 2003, 107, 14130–14139 CrossRef CAS.
- R. Holm, W. Shi, R. A. Hartvig, S. Askjær, J. C. Madsen and P. Westh, Phys. Chem. Chem. Phys., 2009, 11, 5070–5078 RSC.
- C. Schonbeck, P. Westh, J. C. Madsen, K. L. Larsen, L. W. Stade and R. Holm, Langmuir, 2011, 27, 5832–5841 CrossRef CAS PubMed.
- M. Benko, L. A. Kiraly, S. Puskas and Z. Kiraly, Langmuir, 2014, 30, 6756–6762 CrossRef CAS PubMed.
- J. Seelig and P. Ganz, Biochemistry, 1991, 30, 9354–9359 CrossRef CAS PubMed.
- N. R. Syme, C. Dennis, S. E. V. Phillips and S. W. Homans, ChemBioChem, 2007, 8, 1509–1511 CrossRef CAS PubMed.
- R. Krishnan, A. M. Rakhi and K. R. Gopidas, J. Phys. Chem. C, 2012, 116, 25004–25014 CAS.
- J. M. Sturtevant, Proc. Natl. Acad. Sci. U. S. A., 1977, 74, 2236–2240 CrossRef CAS.
- J. D. Dignam, X. Qu, J. Ren and J. B. Chaires, J. Phys. Chem. B, 2007, 111, 11576–11584 CrossRef CAS PubMed.
- C. L. D. Gibb, E. E. Oertling, S. Velaga and B. C. Gibb, J. Phys. Chem. B, 2015, 119, 5624–5638 CrossRef CAS PubMed.
- J. Zhao and S. Franzen, J. Phys. Chem. B, 2013, 117, 8301–8309 CrossRef CAS PubMed.
- G.-J. Zhao and K.-L. Han, Phys. Chem. Chem. Phys., 2010, 12, 8914–8918 RSC.
- H. Binder and G. Lindblom, Phys. Chem. Chem. Phys., 2003, 5, 5108–5117 RSC.
- E. A. Meyer, R. K. Castellano and F. Diederich, Angew. Chem., Int. Ed., 2003, 42, 1210–1250 CrossRef CAS PubMed.
- S. Chai, G.-J. Zhao, P. Song, S.-Q. Yang, J.-Y. Liu and K.-L. Han, Phys. Chem. Chem. Phys., 2009, 11, 4385–4390 RSC.
- B. Breiten, M. R. Lockett, W. Sherman, S. Fujita, M. Al-Sayah, H. Lange, C. M. Bowers, A. Heroux, G. Krilov and G. M. Whitesides, J. Am. Chem. Soc., 2013, 135, 15579–15584 CrossRef CAS PubMed.
- J. F. Douglas, J. Dudowicz and K. F. Freed, Phys. Rev. Lett., 2009, 103, 135701–135705 CrossRef PubMed.
- E. V. Starikov and B. Norden, J. Phys. Chem. B, 2007, 111, 14431–14435 CrossRef CAS PubMed.
- G. M. Morris, D. S. Goodsell, R. S. Halliday, R. Huey, W. E. Hart, R. K. Belew and A. J. Olson, J. Comput. Chem., 1998, 19, 1639–1662 CrossRef CAS and references therein.
Footnote |
| † Electronic supplementary information (ESI) available. See DOI: 10.1039/c5ra27050b |
| This journal is © The Royal Society of Chemistry 2016 |