Bin Han*a,
Yasuo Shimizua,
Gabriele Seguinib,
Elisa Arducabc,
Celia Castrod,
Gérard Ben Assayagd,
Koji Inouea,
Yasuyoshi Nagaia,
Sylvie Schamm-Chardond and
Michele Perego*b
aThe Oarai Center, Institute for Materials Research, Tohoku University, 2145-2 Narita, Oarai, Ibaraki 311-1313, Japan. E-mail: hanbin@imr.tohoku.ac.jp
bLaboratorio MDM, IMM-CNR, Via C. Olivetti 2, 20864 Agrate Brianza, MB, Italy. E-mail: michele.perego@mdm.imm.cnr.it
cDipartimento di Fisica, Università degli Studi di Milano, Via Celoria 16, I-20133 Milano, Italy
dCEMES-CNRS, Université de Toulouse, nMat group, BP94345, 31055 Toulouse Cedex 4, France
First published on 22nd December 2015
Single planes of Si nanocrystals (NCs) embedded in a SiO2 matrix were synthesized by annealing SiO2/SiO/SiO2 multilayer structures deposited on Si (100) substrates by e-beam evaporation. The dependence of the shape, size, and areal density of Si NCs on the thickness of the initial SiO layer was investigated using atom probe tomography and validated by energy filtered transmission electron microscopy. Three kinds of samples were prepared with SiO layer thicknesses of 4, 6, and 10 nm. The size of Si NCs enlarged with increasing SiO layer thickness. The shape of Si NCs was mainly extended spheroid in all three kinds of samples. In the sample with the 4 nm-thick SiO layer, the Si NCs were more prolate than those in the other two samples. Moreover, many rod-shaped Si NCs appeared in the sample with the 10 nm-thick SiO layer. These rod-shaped Si NCs were found to be connected by small Si NCs. The areal densities of Si NCs were in the order of 1012 NCs per cm2 in all samples.
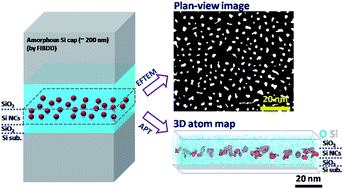
Several approaches have been developed to synthesize Si NCs in a SiO2 matrix by annealing Si-rich SiO2 films in order to promote phase separation and Si NCs formation within the oxide matrix.14–17 In this regard, the high temperature thermal treatment of a SiO2/SiO/SiO2 multilayer is a very efficient method to synthesize a single plane of Si NCs embedded in a SiO2 matrix.14,16 The depth positioning of the Si NCs can be finely tuned by adjusting the thickness of the SiO2 layers. The average structural characteristics of the Si NCs can be controlled by properly modulating the thickness of the original SiO layer.12,14 However, a systematic and comprehensive investigation of the relationship between SiO layer thickness and structural characteristics of the Si NCs is still a challenge due to the intrinsic limitation of current analysis techniques.
In the past studies, transmission electron microscopy (TEM) techniques such as high resolution TEM (HRTEM) and energy filtered TEM (EFTEM) were mainly employed to investigate the structural characteristics of Si NCs.18–21 However, HRTEM can only detect the crystallized Bragg-oriented Si NCs. Based on a chemical selectivity, plasmon EFTEM imaging allows to detect both crystallized and amorphous Si NCs. Practically, only 2D maps of the projection of isolated Si NCs or nanoaggregates containing Si NCs are obtained from this method.18,22,23 Plasmon tomography is necessary to obtain a 3D description, but probably due to unstability under irradiation damage very few attempts are reported in the literature.24,25 Moreover, even if a 3D morphology reconstruction can be achieved, it cannot provide a fully quantitative concentration analysis.26
The state-of-the-art laser-assisted atom probe tomography (APT) which can reconstruct the 3D atom maps of materials is a powerful method to study semiconductors like Si with nearly atomic-scale resolution.27–29 With APT, not only the 3D structural characteristics but the inside concentration of Si NCs can be studied.30–32 Moreover the high sensitivity of the APT allows studying the presence and positioning of the impurities that can modify the electronic and optical properties of the Si NCs. Recently, APT has been employed to investigate dopant incorporation in Si NCs embedded in a SiO2 matrix where Si NCs multilayer samples were used.33,34 In this respect the definition of the effective shape and size of the Si NCs, as well as the correct identification of the interface between the Si NCs and the surrounding matrix are crucial to determine the positioning of the impurities within the nanostructured material.
In this work, the evolution of Si NCs structural characteristics as a function of the thickness of the initial SiO film was studied by APT. A single plane of Si NCs layer was synthesized by processing 4, 6, and 10 nm thick SiO layers at high temperature in a conventional furnace, which enabled to compare the APT results with EFTEM ones directly. It was found that Si NCs in all three samples have mainly extended spheroids. The size of the Si NCs increased as the initial SiO layer thickness increases and many rod-shaped Si NCs appeared for the largest SiO layer thickness (10 nm). The associated decrease of the areal density of the Si NCs is the signature of the existence of connections between the Si NCs which is clearly revealed by the 3D APT analysis.
EFTEM observation was performed on a field emission microscope (Tecnai™ F20, FEI) operating at 200 kV and equipped with an imaging filter (Gatan TRIDIEM). EFTEM images were formed from electrons that passed through the sample and lose energy around 17 eV (±2 eV), which corresponds to the plasmon energy of Si. They were obtained from TEM samples prepared for two complementary observation directions perpendicular to each other (cross-section and plan-view) using the standard procedure involving mechanical polishing and Ar+ ion milling. For clearly defining the Si NCs/SiO2 interface, the grey-level images were transformed into black and white images.18
Needle specimens for APT analysis were prepared by gallium (Ga) focused-ion-beam (FIB), with a FIB-SEM dual-beam system (Helios NanoLab600i, FEI). To allow the fabrication of needle specimens, an additional amorphous Si cap layer of 200 nm was formed on the top surface of sample by a focused ion beam direct deposition (FIBDD) technique [Fig. 1(c)].35 To increase the area of interest, the needle specimens were made from the cross-section of the sample as shown in Fig. 1(c), which also avoided the needle fracture during the APT measurements. The samples were sharpened into needles using annular milling patterns with a 30 kV, 0.24 nA Ga+ beam. To remove the damaged layer from the needle surface, a low ion energy beam (5 kV, 43 pA) was used at the final stage.
APT analysis was performed using a laser-assisted local electrode atom probe (LEAP4000X HR, Cameca).36,37 A pulsed laser with a 355 nm wavelength was irradiated upon the needle specimen with a repetition rate of 200 kHz and a laser-pulse energy of 90 pJ. The base temperature of the needle specimen during the measurement was 50 K. An Integrated Visualization and Analysis Software (IVAS) protocol was employed to reconstruct the 3D atom maps.38
Fig. 2 Cross-section [(a)–(c)] and plan-view [(d)–(f)] EFTEM images of samples 1, 2, and 3. (g)–(i) Same plan-view images as (d)–(f) after the black and white transformation. |
Sample 1 | Sample 2 | Sample 3 | |
---|---|---|---|
Thickness (nm) | 2.1 ± 0.5 | 2.7 ± 0.5 | 4.0 ± 0.5 |
Area (nm2) | 1.7 ± 0.9 | 4.2 ± 2.4 | 10.3 ± 8.1 |
Length (nm) | 1.8 ± 0.6 | 3.1 ± 1.3 | 5.1 ± 2.8 |
Width (nm) | 1.1 ± 0.3 | 1.7 ± 0.4 | 2.5 ± 0.8 |
In-plane elongation (length/width) | 1.6 | 1.8 | 2.0 |
Out-of-plane elongation (length/thickness) | 0.9 | 1.1 | 1.3 |
Size and number density | Sample 1 | Sample 2 | Sample 3 | |
---|---|---|---|---|
Average diameter (nm) | APT | 2.2 ± 0.8 | 3.1 ± 1.2 | 3.5 ± 1.6 |
TEM | 1.9 ± 0.5 | 2.8 ± 1.0 | 4.3 ± 2.9 | |
Areal density (×1012 NCs per cm2) | APT | 4.0 ± 0.4 | 4.2 ± 0.4 | 1.9 ± 0.3 |
TEM | 3.0 ± 0.6 | 3.4 ± 0.7 | 2.4 ± 0.5 |
The shape of Si NCs can be represented by the length and width of Si NCs. In the plane, the length of the Si NCs can be described by the geodesic diameter, which is the largest path between two points at the border of the Si NCs. The width is the in-circle diameter, which is the largest diameter of the circle that can be drawn inside the Si NCs. The average values of these parameters evidence that, in the plane they form, the Si NCs become more and more elongated as the initial SiO thickness increases. This can be well seen looking at the “in-plane elongation” parameter (length/width), which varies from 1.6 to 2.0 going from the 4 to the 10 nm-thick initial SiO layer. In the same time, the “out-of-plane elongation parameter” (length/thickness) increases from 0.9 to 1.3. This means, as a first approximation, that the Si NCs can be described as spheroids which are rather prolate for the initial 4 nm SiO thickness and rather oblate for thicker initial SiO layers.
The mean area of the Si NCs (total area occupied by the Si NCs divided by the number of Si NCs within a defined surface) increases from 1.7 to 10.3 nm2 as the initial SiO thickness increases from 4 to 10 nm. The mean diameter is defined as the diameter of the sphere with a volume equivalent to the mean volume of the NCs which can be approximated from the cross-section and plan-view parameters (thickness and area). The diameter of Si NCs progressively increased from 1.9 to 4.3 nm with the increasing of the initial SiO thickness. In the same time, the areal density remains similar within the error bar for the two first samples but decreases by a factor of 1.3 for the sample with the 10 nm-thick SiO layer.
As the EFTEM images only gave the information about the projection of Si NCs, the three samples were further studied by APT to get more insight into the 3D structural characteristics of Si NCs. Fig. 3(a) shows a 3D atom map of sample 2 where the Si NCs were represented by 70 at% Si iso-concentration surfaces. The single Si NCs layer embedded in the SiO2 matrix can be clearly observed in the 3D atom map. A similar structure can be evidenced in the 3D atom maps of samples 1 and 3 (not shown here). The Si NCs in samples 1, 2, and 3 were extracted from the SiO2 matrix by 70 at% Si iso-concentration surfaces as shown in Fig. 3(b)–(d). In addition to 2D EFTEM, these 3D representations bring essential information on the complex shape and arrangement of the Si NCs. The maps confirm that Si NCs have curved shapes with a large part of elongated ones particularly for sample 3. Details on the stretching of some Si NCs in sample 3 are illustrated in the 2D Si concentration map [Fig. 3(e)] where the formation of elongated Si NCs is caused by the connection of small Si NCs. From a qualitative point of view we observe that the size of Si NCs enlarged with increasing initial SiO layer thickness, and that the areal density decreased in sample 3, which is in agreement with EFTEM data.
Due to the well-known APT artifact, the local magnification effect,30 some SiO2 was artificially introduced into the Si NCs, which blurred the Si NC/SiO2 matrix interface.31 Therefore, it is difficult to quantitatively evaluate the shape, size, and areal density of Si NCs by using Si iso-concentration surfaces, as the final result is very sensitive to the chosen Si concentration threshold values. In order to quantitatively study these structural characteristics of Si NCs, a cluster identification algorithm has been employed.39,40 This method is based on the assumption that the distance between solute atoms within a cluster is smaller than that between solute atoms in the matrix. Hence, the solute atoms with distance smaller than a set value (dmax) were identified to belong to a same cluster. In addition, a parameter Nmin is used to determine the minimum cluster size based on the number of solute atoms within a cluster. However, it should be noted that there is no distinct criterion for choosing the proper dmax and Nmin.41,42
In this work, the values of dmax were determined by comparing the size of Si NCs output from cluster analysis with that roughly estimated from Si iso-concentration surfaces. The dmax were finally set as 0.39, 0.39, and 0.44 nm for samples 1, 2, and 3, respectively. The dmax values of samples 1 and 2 were approximate to previous report (dmax = 0.4 nm),33 but the dmax value of sample 3 was a little higher. That is because in sample 3 many Si NCs were connected with each other, and the Si concentration in connection areas is lower than that in the Si NCs as indicated by black arrows in Fig. 3(e). The distances between Si atoms in these low Si concentration areas were larger than that in the Si NCs, so if the dmax value is too small, the connected Si NCs will be divided into small ones. To avoid miscounting small clusters and separate clusters from random solid solution, Nmin were set as 40 atoms for all three kinds of samples by using a size distribution analysis.43 This Nmin value corresponding to sphere Si NCs with diameter of about 1 nm which is similar to the lower detection limit of EFTEM.
In the cluster analysis, the Si NCs were fitted as ellipsoids using best-fit ellipsoid method from which the dimension of the semi-axes (s1, s2, and s3) of the best-fit ellipsoid can be determined (s1 ≥ s2 ≥ s3 are the major semi-axes and two minor semi-axes, respectively).44 The aspect ratio (s2/s1) and oblateness (s3/s2) were used to represent the shape feature of the Si NCs. Fig. 4(a)–(c) show the shape distributions in terms of aspect ratio and oblateness. Almost all the Si NCs are distributed in the sphere region in all the three kinds of samples. Compared with samples 2 and 3, Si NCs tend to be more prolate in sample 1 which is consistent with the EFTEM results. Interestingly, in sample 3 there are many rod-shaped Si NCs which were found connected by small Si NCs as what we have observed in Fig. 3(d) and (e). The diameters of Si NCs were derived from the volume by treating Si NCs as spheres, and the diameter distributions are shown in Fig. 4(d)–(f). The average diameters of Si NCs were 2.2 ± 0.8, 3.1 ± 1.2, and 3.5 ± 1.6 nm in samples 1, 2, and 3 respectively. Moreover, there are many very large Si NCs (diameter ≥ 6 nm) in sample 3 and most of them are found to be rod-shaped Si NCs. The areal density of Si NCs were in the order of 1012 NCs per cm2 in all three kinds of samples which is same order with previous reports.13 In particular the areal densities are (4.0 ± 0.4) × 1012, (4.2 ± 0.4) × 1012, and (1.9 ± 0.3) × 1012 NCs per cm2 in samples 1, 2, and 3, respectively. Both the sizes and areal densities were consistent with the EFTEM results within the error bar as shown in Table 2.
It should be noted that the areal density in sample 3 is much lower than that in samples 1 and 2. The areal density decrease of Si NCs was often explained by Si NCs coarsening during Ostwald ripening.20,45,46 However, our results indicated the decrease of areal density is caused by small Si NCs connection. Recently, the kinetic Monte Carlo (KMC) simulation showed that small Si NCs tend to connect with each other when they form and exist closely.47 Our APT results are consistent with this KMC simulation.
The proposed combination of APT and TEM analysis provides a complete and exhaustive picture of the system. Previous results demonstrate a very good qualitative agreement between the two techniques.26 Nevertheless, a quantitative analysis of the data was prevented by the structural characteristic of the samples exhibiting a sponge-like Si structure embedded in a SiO2 matrix. Using a single layer of Si NCs a direct comparison between EFTEM and APT is possible, providing a complete and self-consistent quantitative description of Si NCs morphology. The 3D reconstruction of the Si NCs obtained by APT analysis is validated by EFTEM plan-view and cross-section images. With this methodology, the structural characteristics of Si NCs were investigated as a function of the thickness of the initial SiO layer. The experimental results demonstrate that by increasing the SiO layer thickness the Si NCs get progressively bigger with a concomitant evolution of the shape from spheroids to rod shaped nanostructures. Interestingly, irrespective of the SiO thickness, the Si NCs arrange in a single plane at a well-controlled distance from the Si substrate. In particular, in the sample with the 10 nm-thick SiO layer, Si NCs mainly elongate in the in plane direction with limited effects in the out of plane direction. This result suggests that, in this range of thickness of the SiO layer, the Si NCs formation is strongly constrained by the adjacent SiO2 barriers, that forces the Si NCs to grow in a well-defined position inducing the observed shape evolution from spheroid to rod-shape structures.
This journal is © The Royal Society of Chemistry 2016 |