
A ratiometric fluorescent and colorimetric probe for selective detection of hydrazine†
Hoyin Tsea,
Qinghua Lia,
Singming Chana,
Qihua Youa,
Albert W. M. Leea and
Winghong Chan*ab
aDepartment of Chemistry, Hong Kong Baptist University, Kowloon Tong, Hong Kong, China. E-mail: whchan@hkbu.edu.hk
bPartner State Key Laboratory of Environmental and Bioanalysis, Kowloon Tong, Hong Kong, China
First published on 28th January 2016
Abstract
A colorimetric and ratiometric fluorescent hydrazine reactive probe COUMA2 has been developed. In aqueous solution, hydrazinolysis of COUMA2 results in deacetylation affording fluorescent products displaying dual emissive peaks at 500 and 655 nm. 50 μM NH2NH2 can induce a ratiometric change of fluorescent signal from COUMA2 by a factor of 4.89.
Hydrazine (NH2NH2) is an important industrial chemical reagent which possesses distinctive alkalinity, nucleophilicity and reductibility properties.1 It has been used extensively in the manufacturing of pharmaceuticals, agrochemicals, textile dyes and corrosion inhibitors.2 The unique flammable and detonable characteristics of hydrazine make it a very interesting material as a propellant in missile launching systems.1,3 However, hydrazine is a highly toxic industrial chemical and could be readily inhaled and absorbed during industrial processes. Aqueous hydrazine solutions can cause many adverse health effects to humans and animals after absorption by oral, nasal and dermal pathways.4 Animal studies show that it is carcinogenic and mutagenic which may induce serious damage to liver, lungs, central nervous system and kidney.5 Therefore, for an industrial hygiene guideline, a low threshold limit value (TLV) of 10 ppb has been recommended by the US Environmental Protection Agency and the World Health Organization.6
To quantify the concentration of this toxic material both in gaseous and solution phase, a variety of traditional analytical methods including chromatography,7 electrochemistry,8 spectrophotometry9 and titration10 have been developed. In contrast, fluorescence based techniques characterizing by their high sensitivity, distinctive selectivity and easy operation have recently drawn the attention from the analytical community. In particular, exploiting the high nucleophilicity of hydrazine, chemodosimetric systems with built-in off–on signal display device have been documented.11 For instance, non-fluorescent multi-functional phenolic compounds, protected as phenolates by coupling with levulinoyl, or 4-bromobutanoyl or acetoxyl moiety, can be turned on by nucleophilic attack of hydrazine under neutral conditions.11a,c,e Only until very recently, the highly sought after ratiometric probes displaying fluorescence and visible output signals are emerging in the literature.12 Based on the selective hydrazinolysis of a cyanine dye derivative, a ratiometric detection of hydrazine in water samples and living cells was described by Peng and coworkers.12b Goswami and coworkers designed a latent 2-(2′-hydroxyphenyl)benzothiazole (HBT) molecular platform in which the excited state intramolecular proton transfer (ESIPT) of the HBT moiety is strategically blocked. Hydrazinolysis of the sensor liberated the ESIPT pathway resulting in the emergence of a red-shifted ratiometric fluorescent signal.12c In this context, we developed a ratiometric coumarin-based pH fluorescent probe operative on a ring opening/closing mechanism of N,O-disubstituted hemiaminal ether.13 We envision that a reactive hydrazine probe can be developed by incorporating a labile acetyl protective group onto the hydroxylethyl moiety of the pH probe. The rational design of this chemodosimetric probe takes advantage of the enhanced nucleophilicity of the hydrazine nitrogen attributable to the α-heteroatom effect.14 In this light, we report here a colorimetric and fluorimetric ratiometric reactive probe capable of selectively detecting hydrazine in aqueous samples. Starting with our previous pH fluorescent sensing compound COUMA1, the new hydrazine sensory probe COUMA2 can be constructed through acetylation with acetic anhydride in a single step as shown in Scheme S1 (ESI).† The probe COUMA2 was adequately characterized by 1H NMR, 13C NMR spectroscopy and HRMS analysis (ESI, Fig. S1–S3†) (Scheme 1).
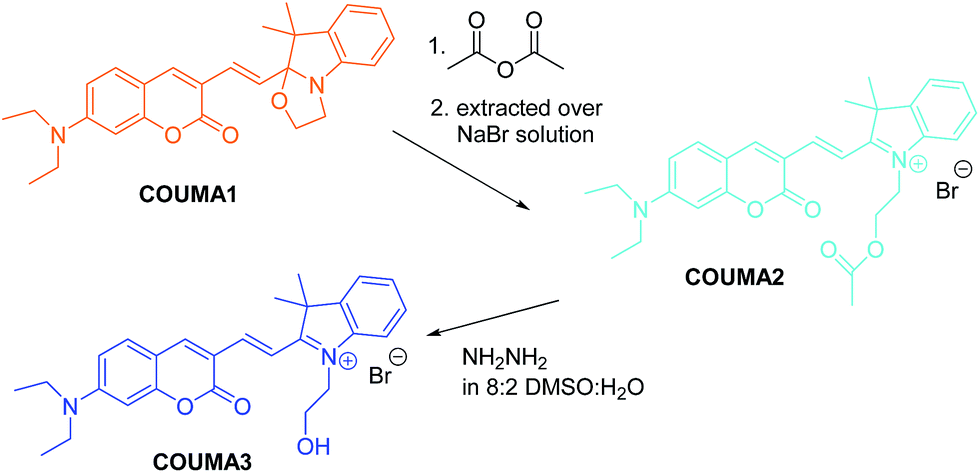 | ||
| Scheme 1 Preparation of NH2NH2 fluorescent probe COUMA2 and its hypothesized signal transduction mechanism through deacetylation upon the action of hydrazine. | ||
Upon addition of NH2NH2, the bright blue color solution of COUMA2 (DMSO–H2O, 2![[thin space (1/6-em)]](https://www.rsc.org/images/entities/char_2009.gif) :8, v/v, 40 mM Britton–Robinson buffer solution, pH = 7) gradually changed color to light yellow. It is hypothesized that, nucleophilic attack of COUMA2 by NH2NH2 results in deacetylation affording initially COUMA3, which then equilibrates into a mixture of COUMA1 and COUMA3 at pH = 7.13 The change can be observed by naked-eyes. Additionally, the hydrazinolysis of COUMA2 can be monitored by fluorescence measurements. Presumably, due to the photo-induced electron transfer ability of the ester group, the probe displays very low fluorescence under UV irradiation. Thus, a favourable “off-state” has been displayed by the probe. Addition of hydrazine into aqueous DMSO solution of COUMA2 triggered the dual emissive peaks at 500 and 655 nm, reminiscent of the fluorescent spectrum of the pH sensor COUMA1/3.13
:8, v/v, 40 mM Britton–Robinson buffer solution, pH = 7) gradually changed color to light yellow. It is hypothesized that, nucleophilic attack of COUMA2 by NH2NH2 results in deacetylation affording initially COUMA3, which then equilibrates into a mixture of COUMA1 and COUMA3 at pH = 7.13 The change can be observed by naked-eyes. Additionally, the hydrazinolysis of COUMA2 can be monitored by fluorescence measurements. Presumably, due to the photo-induced electron transfer ability of the ester group, the probe displays very low fluorescence under UV irradiation. Thus, a favourable “off-state” has been displayed by the probe. Addition of hydrazine into aqueous DMSO solution of COUMA2 triggered the dual emissive peaks at 500 and 655 nm, reminiscent of the fluorescent spectrum of the pH sensor COUMA1/3.13
To examine the best conditions for performing the hydrazinolysis reaction of the probe, the fluorescence output of 50 μM probe solution in response to the addition of 100 equivalents hydrazine was recorded at different time interval. After 10 min, dual emissive peaks centered at 500 and 655 nm with a ratio of 0.49 were apparent. Over time, a gradual increase of the peak ratio (i.e. F500 nm/F655 nm) was observed and a final steady reading of 9.16 was found at 185 min, representing a 20 fold enhancement of ratiometric signal (Fig. 1).
 | ||
| Fig. 1 Change of fluorescence spectra of probe COUMA2 (50 μM) in response to 100 equiv. of NH2NH2 over a period of 185 min (2:8, v/v, DMSO–H2O, 40 mM Britton–Robinson buffer solution, pH = 7.0). | ||
At room temperature, much to our surprise, the hydrazinolysis reaction of the acetyl group of the probe proceeded not as rapidly as we originally envisioned. Different solvent systems including pure aqueous solution, a mixture of aqueous ACN or DMSO solution were used for mediating the hydrazinolysis reaction. Under the optimal solvent system (i.e. 2:8, v/v, DMSO–H2O, 40 mM Britton–Robinson buffer solution, pH = 7.0), at 17 °C, 180 min was required for the reaction mixture to achieve a steady fluorescent reading (ESI, Fig. S4†). On the other hand, the same reaction can be investigated by spectrophotometric measurements as well as by naked eyes detection as shown in Fig. 2. The transformation of a deep blue to the pale yellow solution is indicative of the complete hydrazinolysis of the probe.
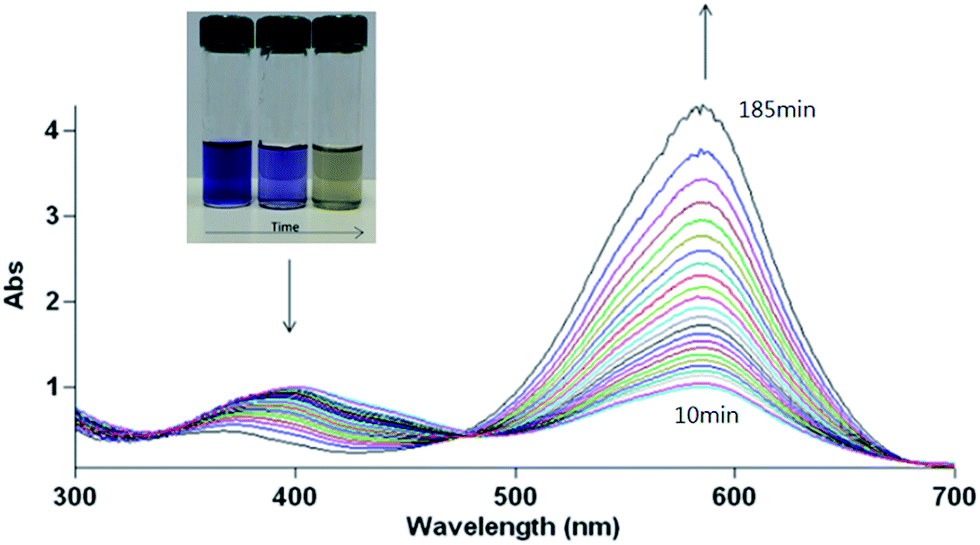 | ||
| Fig. 2 Change of absorption spectra of the probe COUMA2 (50 μM) in response to 100 equiv. of NH2NH2 over a period of 185 min (2:8, v/v, DMSO–H2O, 40 mM Britton–Robinson buffer solution, pH = 7.0), inset: color change of the solution by naked eyes over a time period of 175 min. | ||
To establish whether there exists a quantitative relationship between the fluorescent output of the probe and the concentration of the analyte, fluorescent titrations of COUMA2 towards different amount of hydrazine were performed (Fig. 3). As shown in the inset of Fig. 3, 10 equivalents of hydrazine can cause 6.33 fold increase in ratiometric signal (F500 nm/F655 nm) as compared when the probe is not exposed to hydrazine. To further extend the detection of hydrazine to 50 μM, the fluorescence of the probe should be recorded after six hour of reaction (ESI, Fig. S5†). Evidently, the detection range of hydrazine by the probe can cover its concentration from 50 μM to 5 mM (1 to 100 equivalents). The best pH range for the probe to operate is from 7.0 to 7.8, too acidic condition such as at pH = 5 will result to poor response (ESI, Fig. S6†).
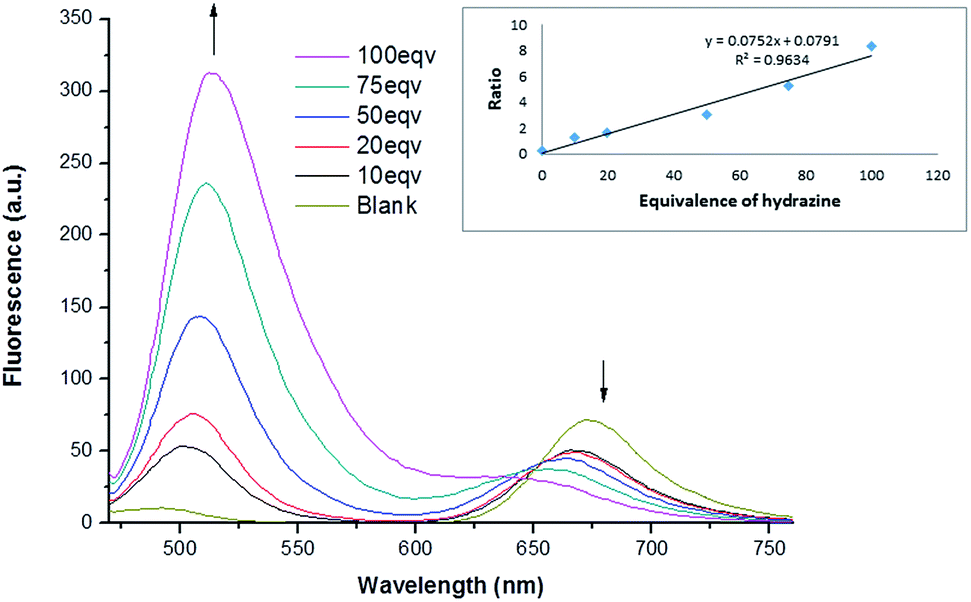 | ||
| Fig. 3 Change of fluorescence spectra of COUMA2 (50 μM) in response to various concentration of NH2NH2 (2:8, v/v, DMSO–H2O, 40 mM Britton–Robinson buffer solution, pH = 7.0). | ||
To circumvent the relatively slow rate of the detection, the hydrazinolysis of probe COUMA2 can be accelerated simply by increasing the reaction temperature. As shown in Fig. 4, at 50 °C, the reaction could be completed within 90 min.
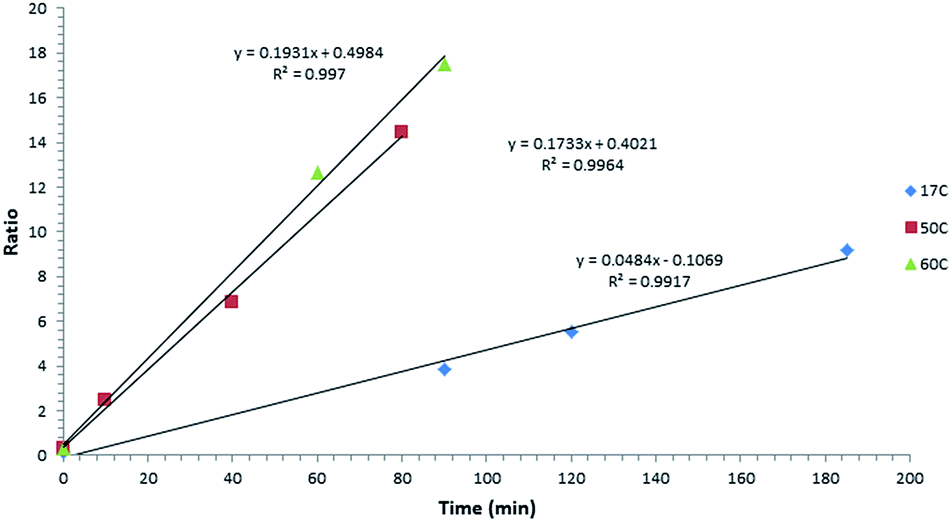 | ||
| Fig. 4 The fluorescence intensity ratio (F500 nm/F655 nm) of the hydrolyzed product of COUMA2 (50 μM) triggered by 100 equiv. hydrazine at different temperatures and time periods (2:8, v/v, DMSO–H2O, 40 mM Britton–Robinson buffer solution, pH = 7.0) upon excitation at 460 nm. | ||
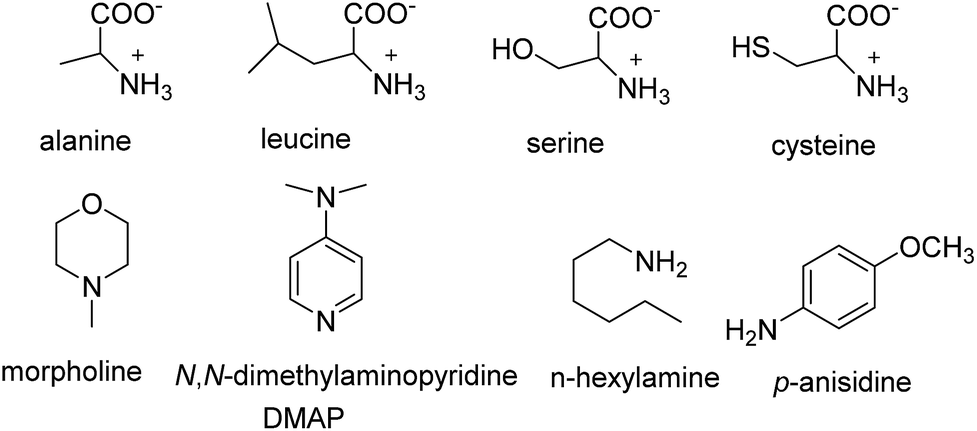
To shed light on the practical application scope of the probe, the photophysical properties of COUMA2 were investigated by monitoring its absorption and emission behavior upon addition of metal ions or nitrogen containing nucleophiles. Among some common divalent cations, Ni(II) and Pb(II) appeared to interfere with the hydrazine detection as indicated by the fact that no color change was observed when 100 equivalents of these two ions was introduced separately into the probe solution in the presence of hydrazine. On the other hand, presumably due to the Lewis acid catalytic property of Hg(II), the hydrolysis of the ester group of COUMA2 was found to be much accelerated. The interference effect of Ni(II), Pb(II) and Hg(II) on the detection of hydrazine by the probe was also confirmed by fluorescent measurements. As shown in Fig. 5a, Ni(II) and Pb(II) solution gave negatively deviated result which is consistent with the observation that nickel and lead ion formed precipitates with by hydrazine.15 Furthermore, when 100 equivalent of N-containing compounds with structures shown in Fig. 6 was separately added into the mixture of 100 equiv. hydrazine and COUMA2 (50 μM), the normalised emission ratio of the probe was found to be either no change or change slightly. The α-heteroatom effect present in the amino group of hydrazine greatly enhances its nucleophilicity in comparison with other substituted amines or ammonia.14 As shown in Fig. 5b, among investigated amino compounds, both α-aminoacids and trifunctional aminoacids such as cysteine and serine did not interfere whereas the more basic N-hexylamine, morpholine and p-anisidine interfered slightly on the hydrazine determination. However, these amines seldom exist in industrial samples and will not impose any restriction on the use of the probe.
 | ||
| Fig. 5 (a) Normalized emission ratio (F500 nm/F655 nm) (metal ion ratio value/blank ratio value) of probe COUMA2 (5.0 × 10⁻⁵ M) with 100 equiv. of hydrazine (blank) and 100 equiv. of hydrazine and 100 equiv. metal ions (2:8, v/v, DMSO–H2O, 40 mM Britton–Robinson buffer solution, pH = 7.0) upon excitation at 460 nm; (b) emission intensity ratio (F500 nm/F655 nm) of probe COUMA2 (5.0 × 10⁻⁵ M) toward 100 equiv. of hydrazine and 100 equiv. of nitrogen containing nucleophiles (2:8, v/v, DMSO–H2O, 40 mM Britton–Robinson buffer solution, pH = 7.0) with excitation at 460 nm. | ||
 | ||
| Fig. 6 Structures of nitrogen containing nucleophiles used in the interference study. | ||
To estimate the limit of detection (LOD) for hydrazine by the probe, triplicated determination of 50 μM hydrazine on the probe solution was performed. The LOD was found to be 0.186 μM (3σ/slope, Fig. S7 and Table S1, ESI†).
Conclusions
In summary, a readily available ratiometric fluorescent hydrazine probe COUMA2 was rationally designed and its application in selective detection of hydrazine in 80% aqueous DMSO solutions was demonstrated. 50 μM NH2NH2 can induce a ratiometric change of fluorescent signal (i.e. F500 nm/F655 nm) by a factor of 4.89 over the ratio of the blank solution. Most of the common transitional metal ions except Ni(II), Pb(II) and Hg(II) and common nitrogen containing nucleophiles do not interfere with hydrazine detection. Additionally, the detection of hydrazine can be observed by the naked-eyes. The spectral signal transduction mechanism in both visible and fluorescent channels was proposed.Acknowledgements
The work was supported by the Partner State Key Laboratory of Environmental and Biological Analysis and Strategic Development Fund of HKBU.Notes and references
- Hydrazine and its derivatives, in Kirk-Othmer Encyclopedia of Chemical Technology, ed. J. I. Kroschwitz and A. Seidel, Wiley, New York, 5th edn, 2005, vol. 13, pp. 562–607 Search PubMed.
- (a) U. Ragnarsson, Chem. Soc. Rev., 2001, 30, 205–213 RSC; (b) S. D. Zelnick, D. R. Mattie and P. C. Stepaniak, Aviat., Space Environ. Med., 2003, 74, 1285–1291 CAS; (c) S. S. Narayanan and F. Schlolz, Electroanalysis, 1999, 11, 465–469 CrossRef CAS; (d) S. Budavari, Merck Index, Merck and Co., New Jersey, 1996 Search PubMed.
- J. Wang and L. Chen, Anal. Chem., 1995, 67, 3824–3827 CrossRef CAS.
- U.S. Environmental Protection Agency (EPA), Integrated Risk Information System (IRIS) on hydrazine/hydrazine sulfate, National Center for Environmental Assessment, office of Research and Developlment, Washington, DC, 1999 Search PubMed.
- (a) International Agency for Research on Cancer, Re-evaluation of some organic chemicals, hydrazine, and hydrogen peroxide. IARC monographs on the evaluation of carcinogenic risk of chemicals to humans, IARC, Lyon, 1999, vol. 71, pp. 991–1013, http://monographs.iarc.fr/ENG/Monographs/vol71/mono71-43.pdf Search PubMed; (b) A. W. Nicholls, E. Holmes, J. C. Lindon, J. P. shockcor, R. D. Farrant, J. N. Haselden, S. J. P. Damment, C. J. Waterfield and J. K. Nicholson, Chem. Res. Toxicol., 2001, 14, 975–987 CrossRef CAS PubMed; (c) N. I. Sax, Dangerous Prop. Ind. Mater. Rep., 1990, 10, 21–58 Search PubMed; (d) S. J. Moloney and R. A. Prough, Rev. Biochem. Toxicol., 1983, 5, 313–346 CAS; (e) S. Garrod, M. E. Bollard, A. W. Nicholls, S. S. Connor, J. Connelly, J. K. Nichloson and E. Holmes, Chem. Res. Toxicol., 2005, 18, 115–122 CrossRef CAS PubMed.
- (a) G. Choudhary and H. Hansen, Chemosphere, 1998, 37, 801–843 CrossRef CAS PubMed; (b) A. Umar, M. M. Rahman, S. H. Kim and Y.-B. Hahn, Chem. Commun., 2008, 166–168 RSC.
- (a) J.-A. Oh, J.-H. Park and H.-S. Shin, Anal. Chim. Acta, 2013, 769, 79–83 CrossRef CAS PubMed; (b) E. Giofriddo, A. Naccarato, G. Attilio and A. Tagarelli, Anal. Chim. Acta, 2014, 835, 37–45 CrossRef PubMed; (c) S. Subramanian, S. Narayanasastri and A. R. Kami-Reddy, Analyst, 2015, 140, 330–339 RSC; (d) J.-A. Oh and H.-S. Shin, J. Chromatogr. A, 2015, 1395, 73–78 CrossRef CAS PubMed.
- (a) R. Madhu, V. Veeramani and S.-M. Chen, Sens. Actuators, B, 2014, 204, 382–387 CrossRef CAS; (b) A. Krittayavathananon, P. Srimuk, S. Luanwuthi and M. Sawangphruk, Anal. Chem., 2014, 86, 12272–12278 CrossRef CAS PubMed; (c) J. Zhang, W. Gao, M. Dou, F. Wang, J. Liu, Z. Li and J. Ji, Analyst, 2015, 140, 1686–1692 RSC; (d) J. Zhang, H. Liu, M. Dou, F. Wang, J. Liu, Z. Li and J. Ji, Electroanalysis, 2015, 27, 1188–1194 CrossRef CAS; (e) S. Dutta, C. Ray, S. Mallick, S. Sarkar, A. Roy and T. Pal, RSC Adv., 2015, 5, 51690–51700 RSC; (f) R. B. Channon, M. B. Joseph, E. Bitziou, A. W. T. Bristow, A. D. Ray and J. Macpherson, Anal. Chem., 2015, 87, 10064–10071 CrossRef CAS PubMed.
- (a) J. Tashkhourian, M. R. Hormozi-Nezhad and M. Fotovat, Spectrosc. Lett., 2013, 46, 73–80 CrossRef CAS; (b) A. D. Arulraj, M. Vijayan and V. S. Vasantha, Spectrochim. Acta, Part A, 2015, 148, 355–361 CrossRef CAS PubMed.
- H. E. Malone, Anal. Chem., 1961, 33, 575–577 CrossRef CAS.
- (a) M. G. Choi, J. Hwang, J. O. Moon, J. Sung and S.-K. Chang, Org. Lett., 2011, 13, 5260–5263 CrossRef CAS PubMed; (b) L. Cui, Z. Peng, C. Ji, J. Huang, D. Huang, J. Ma, S. Zhang, X. Qian and Y. Xu, Chem. Commun., 2014, 50, 1485–1487 RSC; (c) S. Goswami, K. Aich, S. Das, S. B. Roy, B. Pakhira and S. Sarkar, RSC Adv., 2014, 4, 14210–14214 RSC; (d) L. Xiao, J. Tu, S. Sun, Z. Pei, Y. Pei, Y. Pang and Y. Xu, RSC Adv., 2014, 4, 41807–41811 RSC; (e) J. Zhang, L. Ning, J. Liu, J. Wang, B. Yu, X. Liu, X. Yao, Z. Zhang and H. Zhang, Anal. Chem., 2015, 87, 1234–1235 Search PubMed.
- (a) J. Fan, W. Sun, M. Hu, J. Cao, G. Cheng, H. Dong, K. Song, Y. Liu, S. Sun and X. Peng, Chem. Commun., 2012, 48, 8117–8119 RSC; (b) C. Hu, W. Sun, J. Cao, P. Gao, J. Wang, J. Fan, F. Song, S. Sun and X. Peng, Org. Lett., 2013, 15, 4022–4025 CrossRef CAS PubMed; (c) S. Goswami, S. Das, K. Aich, B. Pakhira, S. Panja, S. K. Mukherjee and S. Sarkar, Org. Lett., 2013, 15, 5412–5415 CrossRef CAS PubMed; (d) L. Cui, C. Ji, Z. Peng, L. Zhong, C. Zhou, L. Yan, S. Qu, S. Zhang, C. Huang, X. Qian and Y. Xu, Anal. Chem., 2014, 86, 4611–4617 CrossRef CAS PubMed.
- Q. You, Y. M. Lee, W. H. Chan, N. K. Mak, A. W. M. Lee, S. C. K. Hau and T. C. W. Mak, RSC Adv., 2015, 5, 4099–4102 RSC.
- T. A. Nigst, A. Antipova and H. Mayr, J. Org. Chem., 2012, 77, 8142–8155 CrossRef CAS PubMed.
- D.-H. Chen and C.-H. Hsieh, J. Mater. Chem., 2002, 12, 2412–2415 RSC.
Footnote |
| † Electronic supplementary information (ESI) available: Experimental procedures, 1H NMR/13C NMR spectra and MALDI-TOF HRMS spectra of COUMA2, solvent effect, response sensitivity and pH effect on the probe. See DOI: 10.1039/c5ra26683a |
| This journal is © The Royal Society of Chemistry 2016 |