Influence of the precursor on the porous structure and CO2 adsorption characteristics of MgO

Gan Songab, Xun Zhu*ab, Rong Chenab, Qiang Liaoab, Yu-Dong Dingab and Lin Chenab
aKey Laboratory of Low-grade Energy Utilization Technologies and Systems (Chongqing University), Ministry of Education, Chongqing, 400030, China. E-mail: zhuxun@cqu.edu.cn; Fax: +86-023-65102474; Tel: +86-023-65102474
bInstitute of Engineering Thermophysics, Chongqing University, Chongqing 400030, China

Received 13th December 2015 , Accepted 2nd February 2016

First published on 3rd February 2016


Abstract

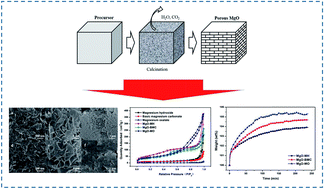
MgO is a promising candidate for CO2 capture. In general, MgO is prepared from different precursors, which have an important effect on its CO2 adsorption performance. Meanwhile, the effect of precursor on the porous structure and CO2 adsorption of MgO remains largely unknown. In this work, porous MgO was prepared from different precursors to investigate the effect of precursor source. Experimental results showed that the morphology of MgO was greatly influenced by that of the precursor and was similar to that of its precursor. Due to the emission of by-products during decomposition, MgO prepared from a precursor with a high molecular weight per single Mg atom exhibits a highly porous structure, large pore volume and pore size. The highly porous structure is favorable for the CO2 adsorption of MgO. The pores formed on the decomposition of precursor play an important role in CO2 adsorption performance, which is affected by the molecular weight per single Mg atom. Narrow pores of MgO from precursors with low molecular weights hinder CO2 diffusion and lead to a low CO2 capacity at fixed adsorption time. The results indicate that the adsorption performance of MgO could be enhanced through the regulation of precursor source and its morphology. This work provides a useful guidance for the synthesis of porous materials with high performance in CO2 capture.

1. Introduction

Rapid depletion of fossil fuels has led to intensive emission of carbon dioxide. The atmospheric CO2 concentration has increased from 280 ppm in pre-industrial times1 to 400 ppm in May 2013, which has contributed to an increase in the global surface temperature of about 0.8 °C.2 The Intergovernmental Panel on Climate Change (IPCC) 5th Assessment Report (AR5) has suggested that in order to avoid the worst effects of climate change, the temperature rise should be kept to less than 2 °C compared with preindustrial levels and the global CO2 emissions should be cut down by 41–72% by 2050 and by 71–118% by 2100 compared with 2010 levels.3 Consequently, extensive efforts have been made to CO2 capture technologies. Adsorption has been regarded as one of the most promising CO2 capture technologies because it exhibits many advantages, such as no liquid waste, low regeneration energy requirement, wide range of operating temperature.4 To date, several types of adsorbents have been proposed for the application of CO2 adsorption, including carbon-based materials,5 zeolites,6 hydrotalcite-like compounds,7 metal oxides 8 and metal organic frameworks.9 Among these adsorbents, MgO has been receiving particular attention owing to its unique features. First of all, MgO can adsorb CO2 from room temperature to 200 °C.10 The energy requirement for regeneration is lower than that of calcium oxides.11 For example, Bhagiyalakshmi et al.12 noted that the fully desorption of adsorbed CO2 could be completed by heating at 450 °C. While, the regeneration temperature of CaO is normally above 950 °C.13,14 Second, water vapor in flue gas is favorable for CO2 adsorption of MgO.15 Because in the presence of water vapor, the adsorption process is via an intermediate species of Mg(OH)2, which will improve the CO2 capacity.16 This feature makes MgO to be suitable for CO2 capture in fossil fuel power plant. Furthermore, Mg-based minerals are widely available in nature so that MgO adsorbent can be massively prepared with low cost. While, the adsorption capacity of commercially available MgO is fairly small, which makes MgO seem to be not suitable for CO2 capture. Hence, extensive efforts have been devoted to the development of high-performance MgO adsorbent.

In general, porous MgO adsorbents were prepared from different precursors, such as magnesium hydroxide, magnesium carbonate, magnesium nitrate, magnesium acetate and magnesium oxalate.12,17–20 For instance, Bian et al.17 synthesized porous MgO for CO2 adsorption via the calcination of anhydrous magnesium acetate. The obtained MgO showed mesoporous structure and enhanced CO2 adsorption capacity compared with commercially available MgO. Han et al.19 synthesized porous MgO from magnesium nitrate. The synthesized sample showed multiple-length-scale porosity and exhibited a considerably high CO2 capacity in the temperature range of 25–200 °C. Porous MgO from different preparation methods and precursors shows totally different porous structure and CO2 adsorption performance. In addition to the CO2 adsorption, MgO has also been widely prepared from different precursors as heterogeneous catalyst.21–23 Aramendia et al.24 synthesized various magnesium oxides from different precursor for catalysis in the Meerwein–Ponndorf–Verley reaction. The MgO samples from different precursors showed various crystal textures and porous properties, which demonstrated the effect of precursor source on the performance of MgO. While, in that work, the porous structure of the precursor was not investigated. As the porous structure of MgO will also be affected by that of its precursor, the porous structure of precursor should also be characterized to investigate the effect of precursor source. Besides, to the best of our knowledge, there is no research concerning the effect of precursor source on the CO2 adsorption characteristics of MgO. As precursor source will affect the porous structure and crystal texture, it will also influence the adsorption mechanism and adsorption kinetics of MgO. Hence, it is essential to gain insight into the effect of precursor on the porous structure and adsorption characteristics of MgO.

To this end, three typically precursors were used to prepare MgO in present study. The morphology and porous structure of MgO together with its precursor were characterized by XRD, SEM and surface area and pore size analysis. The adsorption characteristics of MgO were investigated through thermo gravimetric analysis, in situ FTIR and temperature programmed desorption. By doing this, the influence of precursor on the porous structure and CO2 adsorption of MgO was discussed in detail.

2. Experimental methods

2.1. Materials

Magnesium sulfate heptahydrate (Chongqing Chuandong Chemical Reagent, China AR, 500 g, 98%), potassium hydroxide (Chongqing Chuandong Chemical Reagent, China, AR, 500 g, 90%), magnesium acetate tetrahydrate (Chengdu Kelong Chemical Reagent, China, AR, 500 g, 99%), ethanedioic acid dehydrate (Chengdu Kelong Chemical Reagent, China, AR, 500 g, 99.5%), basic magnesium carbonate (Sigma-Aldrich, USA, 13118) were used as received. Magnesium hydroxide and magnesium oxalate were prepared in-house.

2.2. Preparation of porous MgO

MgO was prepared from three different precursors, i.e. magnesium hydroxide, basic magnesium carbonate and magnesium oxalate. The preparation of magnesium hydroxide was based on previous research.25 Magnesium sulfate heptahydrate (0.2 mol) was dissolved in 50 mL deionized water and potassium hydroxide (0.4 mol) was dissolved in 50 mL deionized water, respectively. Then the potassium hydroxide solution was added dropwise into the magnesium sulfate heptahydrate solution. The resulting mixture was aged at room temperature for 3 hours and then the mixture was filtered and washed with deionized water for five times. Finally, the obtained white solid was dried at 90 °C for 24 h. For the preparation of magnesium oxalate,26 magnesium acetate tetrahydrate (0.15 mol) was dissolved in 40 mL deionized water and ethanedioic acid dehydrate was dissolved in 120 mL deionized water. The ethanedioic acid solution was added dropwise into the magnesium acetate solution at 40 °C. The resulting mixture was filtered and dried at 90 °C for 24 h.

With these precursors, three porous MgO samples were synthesized through the calcination at different temperatures in terms of 450 °C, 500 °C and 550 °C to prevent the aggregation of MgO. In this study, MgO prepared by the calcination of magnesium hydroxide at 450 °C was termed as MgO–MH. MgO prepared through the calcination of basic magnesium carbonate at 500 °C was termed as MgO–BMC. MgO prepared through the calcination of magnesium oxalate at 550 °C was termed as MgO–MO. All calcinations were performed under air environment with a temperature rising rate of 10 °C min−1.

2.3. Characterization of materials

The morphology of the material was observed by FEI Nova 400 FEG-SEM (USA). Powder X-ray diffraction measurement was performed using a Rigaku D/max-1200 X-ray diffractometer (Japan) with Cu radiation. The adsorption–desorption isotherm for nitrogen was measured at 77 K through an ASAP 2020 surface area and porosity analyzer (USA). BET specific surface area was calculated according to the Brunauer–Emmett–Teller (BET) model. Pore size distribution of the material was determined from the adsorption branch of the isotherm using the Barrett–Joyner–Halenda (BJH) method. Total pore volume was calculated according to the nitrogen amount adsorbed at a relative pressure of 0.97.

A NETZSCH thermo gravimetric analyzer (STA 409 PC/PG Luxx, Germany) was used to investigate the decomposition process of precursor and the CO2 adsorption characteristics of MgO. For the decomposition testing, a precursor of 6–8 mg was loaded into an alumina oxide pan and then heated from 50 °C to 800 °C with a temperature rising rate of 10 °C min−1 under nitrogen atmosphere. The weight variation of the precursor was recorded continuously. For the measurement of CO2 adsorption capacity, MgO powder (6–8 mg) was heated at 400 °C under nitrogen (99.8%) with a flow rate of 50 mL min−1 for 40 minutes to release adsorbed impurities and CO2. Then the temperature was declined to 50 °C and the purge gas was switched to carbon dioxide (99.9%). The adsorption process was carried out under atmosphere pressure with a CO2 flow rate of 100 mL min−1 for 4 hours. The weight change during adsorption process was recorded by the analyzer. For the measurement of the adsorption rate, a mixture gas with 15% CO2 and 85% N2 was used to replace the pure CO2 to proceed the same adsorption procedure.

The adsorption mechanism of MgO was examined by in situ Fourier transform infrared spectroscopy (Perkin-Elmer Spectrum 100 Series FTIR instrument (USA) with a horizontal attenuated total reflectance (HATR) sampling accessory) MgO powders were placed on the top of a zinc selenide (ZnSe) crystal with a high refractive index. For the purpose of in situ measurement, a tank with an inlet and an outlet was used to keep the steady atmosphere. The background spectrum was collected under a purge gas of carbon dioxide (20 mL min−1). MgO samples were heated at 400 °C for 40 minutes to release the adsorbed impurities and then placed on the top of the ZnSe crystal. The samples were exposed under carbon dioxide atmosphere for 30 minutes before recording a spectrum. The spectrum was collected from 650 cm−1 to 4000 cm−1 with a resolution of 4 cm−1. In addition, CO2 temperature programmed desorption (CO2-TPD) was used to evaluate the surface chemistry of the MgO sample using an automated chemisorption analyzer (ChemBET Pulsar; Quantachrome Instruments, USA). MgO powders were loaded into a tubular reactor. The sample was heated at 400 °C for 30 minutes with a purge gas of helium to release the adsorbed impurities. Then the temperature was declined to 50 °C and carbon dioxide was charged for 1 hour. Finally, the temperature was increased from 50 °C to 400 °C with a helium gas (115 mL min−1) and the desorbed CO2 was recorded continuously.

3. Results and discussion

3.1. Characterization of porous structure

In this work, porous MgO was synthesized through the decomposition process of precursor. The porous structure is accordingly affected by the decomposition path of precursor. For this reason, the decomposition paths of these precursors were studied through thermo-gravimetric analysis and the results are shown in Fig. 1. Interestingly, the three precursors exhibited different decomposition behaviors. Magnesium hydroxide began to decompose at 320 °C and complete decomposition was attained at 440 °C with a weight decrease of 30%. Unlike magnesium hydroxide, both basic magnesium carbonate and magnesium oxalate showed a two-step decomposition process. Basic magnesium carbonate firstly showed a slow weight decrease of 20% from 100 °C to 400 °C and then a fast weight decrease of 30% from 400 °C to 500 °C, indicating 400 °C is a transition temperature of the decomposition process and the decomposition path changes at this temperature. For basic magnesium carbonate, some water might be physically adsorbed during the preparation process. As a result, when the temperature was below 400 °C, the desorption of physisorbed water mainly contributed to the weight loss. Once the temperature was higher than 400 °C, magnesium carbonate and magnesium hydroxide started to decompose to form porous MgO until all reagent was completely decomposed at about 500 °C. As such, these two steps corresponded to the desorption of physisorbed water and decomposition of magnesium carbonate and magnesium hydroxide. As for magnesium oxalate, such a two-step decomposition became more obvious. Two significant weight reductions were observed: the first weight decrease of 25% corresponding to the temperature ranging from 180 °C to 240 °C and the second weight decrease of 45% corresponding to the temperature ranging from 425 °C and 535 °C. In the temperature range of 240 °C to 425 °C, the weight was almost unchanged, which clearly separated the decomposition process into two steps. Similarly, the first weight decrease was caused by the desorption of physisorbed water. However, due to various properties of basic magnesium carbonate and magnesium oxalate, the forces between these two precursors and physisorbed water were different. The force between magnesium oxalate and physisorbed water might be weak so that the desorption of physisorbed water could be rapidly completed at 240 °C. However, magnesium oxalate could not be decomposed at this temperature, the completed desorption of physisorbed water along with no occurrence of magnesium oxalate decomposition resulted in an unchanged weight at the temperature ranging from 240 °C to 425 °C. Following this period, because the temperature was highly enough to actuate the decomposition of magnesium oxalate, the weight decrease was observed again and porous MgO was formed. From these decomposition behaviors, it can be known that magnesium hydroxide, basic magnesium carbonate and magnesium oxalate reach complete decomposition at 440 °C, 500 °C and 535 °C, respectively. When the calcination temperatures were higher than these temperatures, the sinter of MgO particles may happen, which is unfavorable for the formation of intrinsic porous structure. Therefore, in order to avoid the sinter of MgO particles caused by the negative effect of high calcination temperature, the calcination temperatures of these three precursors were set at 450 °C, 500 °C and 550 °C, respectively.
image file: c5ra26595a-f1.tif
Fig. 1 Decomposition curves of magnesium hydroxide, basic magnesium carbonate and magnesium oxalate.

The XRD patterns of the MgO samples and their precursors together with the standard XRD pattern of cubic magnesium oxide are shown in Fig. 2. The XRD patterns of the precursors were in accordance with the standard XRD patterns of cubic magnesium hydroxide, basic magnesium carbonate and magnesium oxalate, respectively. More importantly, the diffraction peaks appearing at 36.9°, 42.9° and 62.3° of all MgO samples well corresponded to the peaks of standard patterns of cubic MgO, indicating the uniform single phase and cubic crystal structure of the synthesized MgO. In addition, the morphologies of the precursors and MgO samples were also scanned using SEM. As shown in Fig. 3, the morphologies of the synthesized MgO samples were quite similar to their precursors. For magnesium hydroxide, most particles of this precursor exhibited a hexagon-like structure. After experiencing calcination, there only existed a few amount of a hexagon-like structure of synthesized MgO. In the meantime, some particles aggregated as a result of high temperature treatment. As for basic magnesium carbonate and MgO–BMC shown in Fig. 3b and e, a flower-like structure was observed in both of them. For the pair of magnesium oxalate and MgO–MO, the morphology of the synthesized MgO was composed of bulk-like particles after calcination of the rod-like structure of magnesium oxalate. This was caused by the obvious aggregation due to a much higher calcination temperature used to prepare MgO–MO. In this context, original rod-like structure in the precursor tended to aggregate to form larger rods. From these SEM results, it can be concluded that the morphology of MgO is largely affected by its precursor. The structure of synthesized MgO may follow its precursor. The design and regulation of porous MgO can be achieved by adjusting its precursor morphology according to the demand.


image file: c5ra26595a-f2.tif
Fig. 2 XRD patterns of (a) magnesium hydroxide, (b) basic magnesium carbonate, (c) magnesium oxalate, (d) MgO–MH, (e) MgO–BMC, (f) MgO–MO and (g) the standard XRD patterns of cubic MgO.

image file: c5ra26595a-f3.tif
Fig. 3 SEM images of (a) magnesium hydroxide, (b) basic magnesium carbonate, (c) magnesium oxalate, (d) MgO–MH, (e) MgO–BMC and (f) MgO–MO.

To investigate the porous structures of the precursors and synthesized MgO samples, specific surface area and pore size analysis was carried out. Fig. 4 shows the N2 adsorption–desorption isotherms of the samples. All samples displayed type IV isotherms with a H3 hysteresis loop according to the International Union of Pure and Applied Chemistry (IUPAC) classification. The hysteresis loop was caused by mesopores in which the capillary condensation takes place. This kind of hysteresis loop usually appears on solids comprised of the particle agglomerates with slit shaped pores and a non-uniform pore size distribution.27 From the figure, it can be seen that all the MgO samples exhibited enhanced nitrogen adsorption capacities compared with their precursors, indicating the formation of highly porous structure after the calcination. One should note that although magnesium oxalate showed the lowest nitrogen adsorption capacity, the highest nitrogen adsorption capacity at high relative pressure was obtained for MgO–MO. This fact implies that the use of magnesium oxalate as precursor could lead to highly porous MgO after calcination, which benefits for the CO2 adsorption. Furthermore, the pore size distributions of the precursors and synthesized MgO samples were also shown in Fig. 5. All the synthesized MgO samples exhibited larger pore volume compared with their precursors. As evidenced by the enlarged figure, the pore sizes of all precursors represented by the largest dV/dD were shifted to large sizes of MgO, especially for MgO–MO. The detailed information of porous structure of the precursors and respectively-synthesized MgO samples were summarized in Table 1. Enhanced BET surface area and pore volume compared with their precursors were achieved. In particular, although the original pore volume of magnesium oxalate was rather small (0.007 cm3 g−1), the formed MgO–MO showed the largest increase in the pore volume (0.484 cm3 g−1), which was almost 69 times larger than that of the precursor. Only 2.4 times and 3.8 times increments were observed for MgO–MH and MgO–BMC, respectively. Correspondingly, although MgO–MO did not provide the largest BET surface area, the largest increase from 2.9 m2 g−1 to 156.5 m2 g−1 was achieved. As compared to MgO–MH with the highest BET surface area of 211.3 m2 g−1, whose BET surface area of the precursor was 32.7 m2 g−1, about 6.5 times increase was yielded with MgO–MO and magnesium oxalate. Increased BET surface area and pore volume are expected to be beneficial for the adsorption and reactants transport. Such phenomena can be related to the molecular weight of the precursor. As shown in Table 1, basic magnesium carbonate shows the largest molecular weight (485.8 g mol−1) subsequently followed by magnesium oxalate (148.4 g mol−1) and magnesium hydroxide (58.3 g mol−1). Because all these precursors would be finally converted to MgO by calcination, the attention should be paid to the molecular weight per single Mg atom. As seen, although basic magnesium carbonate has the largest molecular weight, magnesium oxalate has the highest molecular weight per single Mg atom. It means that when producing the same amount of MgO, more decomposition by-products including physisorbed and chemisorbed water and CO2 will be released during the calcination process. More space originally occupied by these by-products will be contributed to the formation of pores in MgO. Accordingly, a large increment of pore volume and BET surface area can be attained with MgO–MO. A diagram describing the decomposition process of the precursor was shown in Fig. 6. During the calcination process, the volume occupied by the emitted compounds led to the generation of pore. The remainder MgO acted as the solid framework. More emitted compound corresponded to higher pore volume and larger pore size, which was in accordance with the pore size distribution and pore volume data. This fact also indicates that a precursor with a high molecular weight per single Mg atom is superior for the synthesis of MgO because it can lead to a highly-porous structure. Hence, the porous structure of synthesized MgO depends on not only the morphology but also molecular characteristics of the precursor.


image file: c5ra26595a-f4.tif
Fig. 4 Nitrogen adsorption–desorption isotherms of precursors and MgO.

image file: c5ra26595a-f5.tif
Fig. 5 Pore size distributions of the precursors and MgOs.
Table 1 Porous structure parameters and molecular weights of the synthesized MgO
Sample BET surface area, m2 g−1 Pore volume, cm3 g−1 Pore size, nm Molecular weight, (g mol−1) Molecular weight per single, Mg (g mol−1)
Magnesium hydroxide 32.7 0.128 15.6 58.3 58.3
MgO–MH 211.3 0.311 5.9 40.3 40.3
Basic magnesium carbonate 30.0 0.064 8.5 485.8 97
MgO–BMC 135.3 0.246 7.3 40.3 40.3
Magnesium oxalate 2.9 0.007 9.1 148 148.4
MgO–MO 156.5 0.484 12.3 40.3 40.3


image file: c5ra26595a-f6.tif
Fig. 6 Decomposition diagram of precursor.

In summary, the precursor has a significant effect on the porous structure of MgO. The morphology of the prepared MgO is largely affected by that of its precursor and similar with its precursor after calcination. A precursor with a large molecular weight per single Mg atom leads to a high pore volume and specific surface area after calcination, thereby resulting in a highly porous structure. The specific surface area, pore volume and pore size distribution of porous MgO can be regulated by the selection of precursor, which is not only favorable for increasing the adsorption capacity, but also beneficial for the diffusion of CO2 molecule in CO2 adsorption process.

3.2. CO2 adsorption

With the above synthesized MgO samples, the CO2 adsorption characteristics was allowed to be studied. First of all, because the adsorption performance highly depends on the CO2 adsorption mechanism, the adsorption mechanism was firstly addressed to show the influence of the MgO samples synthesized by these precursors on the CO2 adsorption characteristics. To this end, in situ FTIR was recorded for all MgO samples to distinguish the adsorption mechanism. Fig. 7 shows the in situ horizontal attenuated total reflectance Fourier transform infrared spectroscopy of the synthesized MgO samples. The transmittance peaks appearing at different wavenumbers represent the specific bond between MgO and CO2 molecule, by which the species of different bonds can be identified. In general, the formed carbonate species are characterized by more than one IR band. Therefore, a summary of IR bands representing different species was shown in Table 2. According to the FTIR patterns of three MgO samples, transmittance peaks appeared at 840 cm−1, 1650 cm−1 and 1417–1448 cm−1, which could be attributed to bicarbonate. The peaks appeared at 860 cm−1, 1300–1370 cm−1 and 1520–1550 cm−1 indicated the formation of monodentate carbonate. In addition, according to the peaks appeared at 830–850 cm−1, 1310–1345 cm−1 and 1625–1670 cm−1, it could be concluded that bidentate carbonate was generated during the CO2 adsorption process. These carbonate species indicated the chemisorption of CO2 on MgO. However, a small band could also be seen at 2303 cm−1, which represented the physisorption of CO2.28 Therefore, from the in situ FTIR spectra, it can be known that chemisorption was the main mechanism in the CO2 adsorption of MgO in spite of a tiny fraction of physisorption. After verifying the adsorption mechanism of MgO, let us turn our attention to the CO2 adsorption capacity now because it is greatly affected by the BET surface area.29–31 Table 3 lists the CO2 adsorption capacities of MgO samples at 50 °C and 1 bar of CO2 partial pressure, CO2 amount per unit surface area along with their respective BET surface areas. It is interesting to find that although MgO–MH showed the highest BET surface area, the maximal CO2 adsorption capacity of 6.08% was achieved with MgO–MO subsequently followed by MgO–BMC (5.72%) and MgO–MH (4.46%). On the other hand, considering the BET surface area, MgO–BMC yielded the largest CO2 amount per unit surface area of 9.6 μmol m−2 and then MgO–MO (8.83 μmol m−2) and MgO–MH (4.80 μmol m−2). Such rather big deviation trend between the CO2 adsorption capacity and BET surface area can be explained from the internal surface areas at different pore sizes of MgO. As shown in Fig. 8, the main internal surface area of MgO–BMC and MgO–MO was located at the pore size of 2.38 nm and 4.44 nm, respectively. With the assumption of the non-existence of micropore in BJH method, the pore area distribution in micropore area was inaccurate. But based on the pore area distribution, it could also be deduced that the pore area of MgO–MH was mainly located in micropore. From the figure, it could be seen that the pore size of MgO–MH where main pore area located was smaller than that of MgO–BMC and MgO–MO. It is well known that, during the CO2 adsorption process, CO2 molecule must diffuse into the pore of adsorbent and be adsorbed on the internal surface of pore. When the pore size is too small, it will result in a long time for CO2 molecule to reach the internal surface of pore as a result of the mass transfer limitation. In the present study, the pore size of internal surface area of MgO–MH was smaller than that MgO–BMC and MgO–MO, which is located in micropore range. Under such a circumstance, CO2 molecules would suffer from strong mass transfer limitation in such pores, hindering the diffusion of CO2 molecules into micropore.32 As a result, MgO–MH showed a low CO2 adsorption capacity at constant adsorption time in spite of the largest BET surface area. But for MgO–BMC and MgO–MO, their internal surface areas mainly appeared in mesopores so as to significantly mitigate the diffusion limitation. Consequently, they yielded much higher adsorption capacity than did MgO–MH. With respect to the CO2 amount per unit surface area, although MgO–BMC was higher than MgO–MO, the difference was insignificant. Thus, on the comprehensive consideration of both the CO2 adsorption capacity and CO2 amount per unit surface area, MgO–MO should be the best alternative for CO2 adsorption. Because these results are inherently associated with the pore structure that highly depends on the molecular weight of the precursor, it can be deduced that in addition to the BET surface area, the pore size is another critically important factor when selecting the precursor. MgO prepared from a precursor with low molecular weight per single Mg atom is unfavorable for the CO2 adsorption because of the severe mass transfer limitation resulting from narrow pore size.
image file: c5ra26595a-f7.tif
Fig. 7 In situ FTIR spectra of MgO–MH, MgO–BMC and MgO–MO.
Table 2 IR band positions (cm−1) of different carbonates on MgO
Bibarbonate Monodentate carbonate Bidentate carbonate Reference
1650 1538–1580 1700 34
1417–1448 1420 1357–1380
1220–1229    
1655 1510 1665 35
1405 1390 1325
1220 1035 1005
1040 865 850
840    
  1050 1005–950 36
860 850–830
1520–1550 1625–1670
1390–1410 1275–1325


Table 3 CO2 adsorption capacities of the synthesized MgO
Sample Adsorption capacity, wt% (50 °C) BET surface area, m2 g−1 CO2 amount per unit surface area, μmol m−2
MgO–MH 4.46 211.3 4.80
MgO–BMC 5.72 135.3 9.6
MgO–MO 6.08 156.5 8.83


image file: c5ra26595a-f8.tif
Fig. 8 Internal surface areas at different pore sizes of MgOs.

To further investigate the influence of the precursor on the CO2 adsorption performance of MgO, the CO2 temperature programmed desorption was used to study the surface chemistry. Fig. 9 shows the CO2 temperature programmed desorption curves of these three MgO samples. It can be seen that three samples all exhibited three desorption peaks, which corresponded to three different types of binding sites. According to the IR data reported previously,28 these three desorption peaks could be assigned to bicarbonate, bidentate carbonate and unidentate carbonate, respectively. It is indicated that CO2 molecule was adsorbed on the surface of MgO in three different ways as shown in Fig. 10. The desorption peak appearing at the lowest temperature corresponded to bicarbonate, where CO2 molecules were weakly adsorbed at basic OH groups, while, the desorption peak at the highest temperature corresponded to unidentate carbonate, which was due to the strong adsorption on basic O2− sites. Bidentate carbonate adsorbed at Mg–O pairs gave the desorption peak at the intermediate temperature and the adsorption was moderate in this case. Besides, it can be found from the TPD curves that MgO–MH and MgO–MO exhibited the similar desorption curves, in which the intensity at the intermediate temperature was the strongest, meaning that the adsorption in the form of bidentate carbonate was a little predominant. For MgO–BMC, the desorption peak at high temperature was the highest, indicating that the adsorption in the form of unidentate carbonate was a little predominant. However, the difference in these three samples was not so obvious. Hence, the precursors used in this study exhibited ignored influence on the surface chemistry of MgO adsorbent.


image file: c5ra26595a-f9.tif
Fig. 9 CO2TPD profiles of MgO–MH, MgO–BMC and MgO–MO.

image file: c5ra26595a-f10.tif
Fig. 10 Illustration of binding modes of CO2 molecules on MgO.

In this work, the adsorption curves of these three samples were also measured at 50 °C and 0.15 bar of CO2 partial pressure and the results are shown in Fig. 11. All of the three samples exhibited a two stage adsorption process with the same slope at initial stage and different slopes at subsequent stage. The first region might be the instantaneous adsorption or external surface adsorption and the second region was due to the gradual adsorption resulting from the CO2 molecule diffusion.33 It can be seen that at the beginning, the amount of the adsorbed CO2 was rapidly increased, which corresponded to the dynamic chemical reaction. However, MgO–MO showed the rapidest increase in the CO2 adsorption capacity at subsequent step. The reason is that large pore size of MgO–MO allows CO2 molecules to be rapidly transported to the internal surface and then to be adsorbed. As a result, a high CO2 adsorption rate was achieved with MgO–MO within 4 hours. In accordance with the pore size distribution, MgO–BMC and MgO–MH showed the moderate and low adsorption rates, respectively. In the meantime, because of the same reason, the diffusion-limited adsorption became more dominant as the adsorption proceeded. The increased amount of the adsorbed CO2 became slow. However, MgO–MO could still rapidly reach the adsorption equilibrium as a result of large pore size. Moreover, since small pore size resisted CO2 molecules to be transported inside of pores, making the internal surface not be fully used. As a result, even though MgO–MO did not have the largest BET surface area, it could rapidly reach the adsorption equilibrium with the largest adsorption capacity. This fact further demonstrates that the pore size of synthesized MgO plays a vast role in the CO2 adsorption performance, which is significantly affected by the molecular weight per single Mg atom of the precursor. The precursor with large molecular weight per single Mg atom can result in MgO with better pore size and porous structure, which in turn leads to high adsorption rate and adsorption capacity as well.


image file: c5ra26595a-f11.tif
Fig. 11 Adsorption curves of MgO at 50 °C and CO2 partial pressure of 0.15 bar.

4. Conclusion

In this work, three kinds of precursors with different molecule weights were used to prepare porous MgO, by which the effect of precursor on the porous structure of synthesized MgO and the CO2 adsorption characteristics was investigated. The obtained results indicated that the precursor showed an obvious effect on the porous structure of synthesized MgO. The morphology of porous MgO was mainly affected by the morphology of its precursor and quite similar with that of its precursor. More importantly, the pore size and pore size distribution of synthesized MgO were significantly influenced by the molecular weight, particularly the molecular weight per single Mg atom. Larger molecular weight per single Mg atom could lead to larger pore volume, pore size as well as the internal surface area of pores. Moreover, the pore size showed more significant effect on the CO2 adsorption performance. As a consequence, although MgO–MH had the largest BET surface area, the adsorption capacity and rate were poor as a result of narrow pores, which hindered the CO2 molecules transport. However, for the MgO synthesized from magnesium oxalate, because its molecular weight per single Mg atom was rather large, a dramatic amount of the decomposition by-products emitted during the decomposition process. Accordingly, large pore volume and pore size could be formed in MgO–MO, which was favorable for alleviating the diffusion limitation in pores. As a result, high adsorption rate and capacity were achieved with MgO–MO. The experimental results indicate that the design and regulation of porous structure of porous MgO can be achieved by the selection of suitable precursor.

Acknowledgements

This work is supported by Natural Science Foundation of China (No. 51576022), National Natural Science Funds for Distinguished Young Scholar (No. 51325602), the State Key Program of National Natural Science of China (No. 51136007), Natural Science Foundation of China (No. 51276205), the Research Project of Chinese Ministry of Education (No. 113053A) and the Fundamental Research Funds for the Central Universities (No. 106112015CDJXY145501).

References

  1. IPCC Fourth Assessment Report: Climate Change 2007, http://www.ipcc.ch/publications_and_data/ar4/syr/en/contents.html.
  2. National Oceanic and Atmospheric Administration, http://www.esrl.noaa.gov/gmd/ccgg/trends/ Search PubMed.
  3. IPCC Fifth Assessment Report: Climate Change 2013, http://www.ipcc.ch/report/ar5/.
  4. D. P. Harrison, Proceedings of the 7th International Conference on Greenhouse Gas Control Technologies, Vancouver, Canada, 2004, pp. 1101–1106 Search PubMed.
  5. Z. Yong, V. G. Mata and A. E. Rodrigues, Adsorption, 2001, 7, 41–50 CrossRef CAS.
  6. D. Bonenfant, M. Kharoune, P. Niquette, M. Mimeault and R. Hausler, Sci. Technol. Adv. Mater., 2008, 9, 70–71 CrossRef.
  7. Z. Yong and A. E. Rodrigues, Energy Convers. Manage., 2002, 43, 1865–1876 CrossRef CAS.
  8. Q. A. Wang, J. Z. Luo, Z. Y. Zhong and A. Borgna, Energy Environ. Sci., 2011, 4, 42–55 CAS.
  9. J. Liu, P. K. Thallapally, B. P. McGrail and D. R. Brown, Chem. Soc. Rev., 2012, 41, 2308–2322 RSC.
  10. B. Feng, H. An and E. Tan, Energy Fuels, 2007, 21, 426–434 CrossRef CAS.
  11. S. Choi, J. H. Drese and C. W. Jones, ChemSusChem, 2009, 2, 796–854 CrossRef CAS PubMed.
  12. M. Bhagiyalakshmi, J. Y. Lee and H. T. Jang, Int. J. Greenhouse Gas Control, 2010, 4, 51–56 CrossRef CAS.
  13. D. P. Harrison, Ind. Eng. Chem. Res., 2008, 47, 6486–6501 CrossRef CAS.
  14. N. H. Florin and A. T. Harris, Energy & Fuels, 2008, 22, 2734–2742 CrossRef CAS.
  15. Y. Duan and D. C. Sorescu, J. Chem. Phys., 2010, 133, 074508 CrossRef PubMed.
  16. X. Jiao, H. Li, L. Li, F. Xiao, N. Zhao and W. Wei, RSC Adv., 2014, 4, 47012–47020 RSC.
  17. S. W. Bian, J. Baltrusaitis, P. Galhotra and V. H. Grassian, J. Mater. Chem., 2010, 20, 8705–8710 RSC.
  18. K. K. Han, Y. Zhou, W. G. Lin and J. H. Zhu, Microporous Mesoporous Mater., 2013, 169, 112–119 CrossRef CAS.
  19. K. K. Han, Y. Zhou, Y. Chun and J. H. Zhu, J. Hazard. Mater., 2012, 203, 341–347 CrossRef PubMed.
  20. Y. Y. Li, M. M. Wan, W. G. Lin, Y. Wang and J. H. Zhu, J. Mater. Chem. A, 2014, 2, 12014–12022 CAS.
  21. V. R. Choudhary, V. H. Rane and R. V. Gadre, J. Catal., 1994, 145, 300–311 CrossRef CAS.
  22. M. A. Aramendia, V. Borau, C. Jimenez, J. M. Marinas, A. Porras and F. J. Urbano, J. Catal., 1996, 161, 829–838 CrossRef CAS.
  23. S. A. El-Molla, S. M. Abdel-all and M. M. Ibrahim, J. Alloys Compd., 2009, 484, 280–285 CrossRef CAS.
  24. M. A. Aramendia, V. Borau, C. Jimenez, J. M. Marinas, J. R. Ruiz and F. J. Urbano, Appl. Catal., A, 2003, 244, 207–215 CrossRef CAS.
  25. J. K. Bartley, C. Xu, R. Lloyd, D. I. Enache, D. W. Knight and G. J. Hutchings, Appl. Catal., B, 2012, 128, 31–38 CrossRef CAS.
  26. Y.-D. Ding, G. Song, X. Zhu, R. Chen and Q. Liao, RSC Adv., 2015, 5, 30929–30935 RSC.
  27. K. S. W. Sing, D. H. Everett, R. A. W. Haul, L. Moscou, R. A. Pierotti, J. Rouquerol and T. Siemieniewska, Pure Appl. Chem., 1985, 57, 603–619 CrossRef CAS.
  28. H. Tsuji, F. Yagi, H. Hattori and H. Kita, J. Catal., 1994, 148, 759–770 CrossRef CAS.
  29. Z. Zhao, H. Dai, Y. Du, J. Deng, L. Zhang and F. Shi, Mater. Chem. Phys., 2011, 128, 348–356 CrossRef CAS.
  30. A. M. Ruminski, K.-J. Jeon and J. J. Urban, J. Mater. Chem., 2011, 21, 11486–11491 RSC.
  31. G. Song, Y.-D. Ding, X. Zhu and Q. Liao, Colloids Surf., A, 2015, 470, 39–45 CrossRef CAS.
  32. K.-Y. Kwak, M.-S. Kim, D.-W. Lee, Y.-H. Cho, J. Han, T. S. Kwon and K.-Y. Lee, Fuel, 2014, 137, 230–236 CrossRef CAS.
  33. B. H. Hameed, I. A. W. Tan and A. L. Ahmad, Chem. Eng. J., 2008, 144, 235–244 CrossRef CAS.
  34. J. A. C. Lercher, C. Colombier and H. Noller, J. Chem. Soc., 1984, 80, 949–959 CAS.
  35. J. Evans and T. Whateley, Trans. Faraday Soc., 1967, 63, 2769–2777 RSC.
  36. G. Busca and V. Lorenzelli, Mater. Chem., 1982, 7, 89–126 CrossRef CAS.

This journal is © The Royal Society of Chemistry 2016
Click here to see how this site uses Cookies. View our privacy policy here.