Preconcentration of sulfite from food and beverage matrices by ultrasonic assisted-cloud point extraction prior to its indirect determination by flame atomic absorption spectrometry

Nail Altunay* and Ramazan Gürkan
Cumhuriyet University, Faculty of Sciences, Department of Chemistry, TR-58140, Sivas, Turkey. E-mail: naltunay@cumhuriyet.edu.tr

Received 12th December 2015 , Accepted 10th February 2016

First published on 11th February 2016


Abstract

The additives used in foods and beverages may be harmful to human health. Thus, there is an increasing demand for analytical methods that allow the reliable identification and quantification of high-risk substances. In this context, we describe a new ultrasonic assisted-cloud point extraction (UA-CPE) method for the preconcentration of sulfite from foods and beverages prior to analysis by flame atomic absorption spectrometry (FAAS). The method is based on the reduction of Fe(III) to Fe(II) by the sulfite, and the subsequent selective complex formation of Fe(II) ion produced, which is linearly related to sulfite concentration, with 5,6-diphenyl-3-(2-pyridyl)-1,2,4 triazine (DPTZ) in the presence of sodium dodecyl sulfate (SDS) at pH 6.0. The method allows the determination of trace levels of sulfite in the range of 0.04–70 μg L−1 with a detection limit of 0.012 μg L−1. The method was successfully applied to food and beverage samples with good results. The method accuracy was controlled by comparing with those of the standard 5,5′-dithio-bis(2-nitrobenzoic acid) (DTNB) method.
1. Introduction

Sulfites such as sodium sulfite (Na2SO3), sodium metabisulfite (Na2S2O5), and sodium bisulfite (NaHSO3) are legal food additives and have been used in a large variety of foodstuffs and beverages contributing to the preservation of foods by preventing enzymatic oxidation, browning reactions, and microbial spoiling.1,2 When sulfites are added in food, they can present as free, reversibly bound, and irreversibly bound forms. Reversibly bound sulfites can be released using an appropriate extraction pH. The irreversibly bound sulfites cannot be detected by most analytical techniques as they form very stable addition compounds. The sum of free and reversibly bound sulfite is called total sulfite.3 Sulfites are cost-efficient and easy to be applied, which make them difficult to be replaced. However, hypersensitive individuals may suffer from asthmatic reactions and food intolerance symptoms if they ingest foods containing large amounts of sulfites, especially free sulfite fractions, which may be more responsible for the hypersensitive reaction.4 Thus, many strict limits have been set on the residual amount of sulfites in different foodstuffs (such as crustaceous ≤50 mg kg−1, beverages in the range of 20–2000 mg L−1, meat products ≤450 mg kg−1, vegetables in the range of 50–2000 mg L−1 and dry biscuit in the range of 30–50 mg kg−1),5–7 and accordingly the development of sensitive, selective, precise, and low-cost analytical methods is of vital importance.

Numerous analytical techniques, which are recently published, have demonstrated the importance of the need for developing fast, accurate and selective techniques for analysis of sulfite species in food and beverages. Different techniques in literature have widely been used for the determination of sulfite species. These techniques include dispersive liquid–liquid microextraction (DLLME) coupled to UV-vis Fiber Optic Linear Array Spectrophotometry (DLLME-UV-vis),8 liquid chromatography inductively coupled plasma mass spectrometry (LC-ICP-MS),9 vapor generation combined with potentiometric detection (VG-PD),10 ion chromatography (IC),11 vapor generation-inductively coupled plasma-optical emission spectrometry (VG-ICP-OES),12 amperometric detection using glassy carbon electrode modified with carbon nanotubes–PDDA–gold,13 headspace single-drop microextraction in combination with UV-vis microspectrophotometry (HS-SDME-UV-vis),14 inductively coupled plasma-optical emission spectrometry (ICP-OES),15 and diffuse reflectance Fourier transform infrared spectroscopic (DR-FTIR) analysis.16 Among all these techniques, flame atomic absorption spectrometry (FAAS) has potential due to its simplicity, low cost, wide availability and low susceptibility to matrix interferences for direct and indirect determination of chemical species. Although the other competitive techniques such as ICP-OES, VG-ICP-OES, and LC-ICP-MS offer lower detection limits, FAAS has survived due to its simplicity and wide availability. The indirect determination of sulfite species in foods and beverages by means of FAAS may be difficult due to the matrix effect. In order to overcome this problem, ultrasonic-assisted cloud point extraction (UA-CPE) is preferably adopted as separation and preconcentration tool. The use of the UA-CPE as an alternative to conventional solvent extraction techniques such as liquid–liquid extraction (LLE) and solid phase extraction (SPE) has the following advantages such as relatively low toxicity, high preconcentration factor, lower cost, higher safety and simplicity.17,18 Also, the UA-CPE was efficiently coupled to FAAS, and successfully used in order to enhance its low detection limit as well as the selectivity of the technique.

The purpose of the present study was to develop an accurate and reliable method for the indirect determination of sulfite in foods and beverages using UA-CPE procedure coupled to FAAS. The UA-CPE was adopted as a preconcentration tool prior to detection of Fe(II), which is linearly related to sulfite concentration, by FAAS. The method is selectively based on ternary complex formation of cationic Fe(PDTZ)22+ complex produced after the reduction of Fe(III) to Fe(II) with sulfite at pH 6.0, with PDTZ (as neutral tridentate chelating agent) in presence of sodium dodecyl sulfate (SDS) as counter ion, and then its extraction from aqueous solution into micelles of nonionic surfactant polyoxyethylene(7.5)nonylphenyl ether (PONPE 7.5) as an extracting agent. The method was applied successfully to its determination after the separation/releasing and preconcentration of sulfite (as free sulfite and total sulfite) from foods and beverage matrices pretreated with acidic (pH 2.0, 0.02 mol L−1 methanesulphonic acid/0.01 mol L−1 D-mannitol) and alkaline (pH 9.0, 0.02 mol L−1 Na2HPO4/0.01 mol L−1 D-mannitol) extraction solutions with UA-CPE.

2. Experimental

2.1. Reagents and apparatus

All the analytical reagents used throughout the current study were of analytical grade. Ultra-pure water (18.2 MΩ cm) was firstly deoxygenated using high purity N2 gas (>99%) and used through the entire study. Fresh standard solution of 500 mg L−1 of sulfite were prepared by dissolving the proper amounts of sodium sulfite (Merck, Germany) in the water and adding 0.2% (v/v) glycerol to stabilize the solution. The stock sulfite solution prepared has been preserved in an ice-CaCl2 bath until it is used. The stock solution of 500 mg L−1 Fe(III) was prepared by dissolving 0.088 g of iron(III)chloride anhydrous supplied from Sigma (St. Louis, MO, USA) with the water. The working solutions were prepared by the proper dilution of this stock solution. A 3.0 × 10⁻³ mol L−1 5,6-diphenyl-3-(2-pyridyl)-1,2,4 triazine (DPTZ) (Sigma) solution as chelating agent was prepared by dissolving appropriate amount of solid (Sigma) in methanol and diluting to 500 mL with the water. Acidic extraction solution was prepared by dissolving 1.82 g of D-mannitol in 800 mL of the degassed water in a volumetric flask of 1 L, adding 1.92 g conc. methanesulfonic acid, and bringing to volume with the degassed water. It was filtered through using a membrane filter of 0.45 mm pore size. Alkaline extraction solution was prepared by dissolving 2.84 g of disodium monohydrogenphosphate and 1.82 g of D-mannitol in 900 mL of the degassed water in a 1 L volumetric flask, then bringing to volume with the degassed water. The solutions of 2.5% (v/v) of non-ionic surfactants (Sigma) were prepared by dissolving 2.5 mL of each surfactant in the water and completed to 100 mL with the water. The 3.0 × 10⁻³ mol L−1 ionic-surfactant solutions (CPC, CTAB and SDS) were prepared by dissolving appropriate amounts of solids (Sigma) in the water. The 1000 mL of 0.1 mol L−1 pH 6.0 citrate buffer solution was daily prepared by mixing 82 mL of 0.1 mol L−1 citric acid (Merck) and 18 mL of 0.1 mol L−1 sodium citrate (Merck) solutions, and was diluted to 1000 mL with the water.

AAS-6300 atomic absorption spectrometer (Shimadzu, Kyoto, Japan) equipped with D2-background correction, an iron hollow cathode lamp, an air–acetylene flame atomizer was used for the indirect determination of sulfite species in surfactant-rich phases. The wavelength, lamp current, slit width and burner height used, was 248.3 nm, 12 mA, 0.2 nm and 7.0 mm, respectively. The measurements were carried out using an air/acetylene flame at flow rates of 18 and 2.2 L min−1. An ultrasonic cleaner (UCS-10 model, Seoul, Korea) was used to maintain the temperature, and efficiently and fastly to induce ternary complex formation in UA-CPE step. A vortex mixer (VM-96B model, Jeio Tech, Co., Ltd., Seoul, Korea) was used for thorough mixing of solutions. A centrifuge (Hettich Universal) was used to accelerate and facilitate the phase separation process. The pH measurements were carried out using a pH-2005 digital pH meter equipped with a glass–calomel electrode (pH-2005, JP Selecta, Barcelona, Spain). Eppendorf vary-pipettes (10–100 and 200–1000 μL) were used to deliver accurate volumes. A refrigerator was used to keep the selected food and beverages fresh and cool till the analysis.

2.2. Sampling and sample preparation procedures

Determination of sulfite species were investigated by the analysis of samples such as foods and beverages. All of the samples collected for analysis were supplied from a local supermarket in Sivas, Turkey. Sample preparation for sulfite can be very important in sulfite determination since it can easily be oxidized to sulfate. To prevent this conversion, D-mannitol solution as a stabilizer was preferably used to minimize the possible oxidation of sulfite in both acidic and alkaline extraction solutions for quantitative monitoring of free sulfite and total sulfite, respectively and moreover, the sulfite solutions were prepared freshly and daily. Specifically, a 0.1% (v/v) of 1-octanol solution as antifoaming agent was added to the wine and beer samples to prevent foaming, and they were degassed for 2 min using an ultrasonic bath.
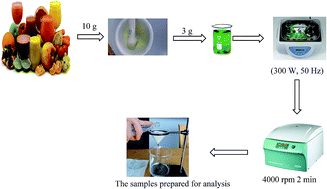
2.2.1. The first sample preparation process. The process to determine free sulfite is as follows: 10 mL of the acidic extraction solution was added to approximately 3 g or 3 mL of the solid or liquid sample into beaker of 100 mL. Then, the beakers were covered with watch glasses and left overnight for the extraction of free sulfite in samples. Later, the sample solutions were degassed and extracted using ultrasound energy (300 watt, 40 Hz) for 10 min at 30 °C in order to obtain a clear homogeneous solution. After centrifugation at 4000 rpm for 2 min, the extracted samples were filtered using a membrane filter (0.45 μm pore size) into a 50 mL volumetric flask and the final volume was diluted to 50 mL with ultra-pure water before analysis. To determine total sulfite, the same steps in the process of the determination of free sulfite with the utilizing of the alkaline extraction solution at 45 °C instead of the acidic extraction solution at 30 °C were followed.
2.2.2. The second sample preparation process. The process to determine free sulfite is as follows: 3 g or 3 mL of the solid or liquid sample is similarly added into 50 mL volumetric flask; 2.0 mL of 2-mercaptoethanol and approximately 45 mL ultra-pure water are added. Then, the sample solutions were degassed and extracted under maximum ultrasonic power (300 watt, 40 Hz) for 5 min at 35 °C in order to obtain a clear homogeneous solution. After centrifugation at 4000 rpm for 2 min, the extracted samples were filtered using a membrane filter (0.45 μm pore size). The total sulfite was determined by the following procedure. An approximately 3 g or 3 mL of the solid or liquid sample was added into 50 mL volumetric flask, and then 3.0 mL of 2-mercaptoethanol, 40 mL of water and 5–7 mL of 0.2 mol L−1 disodiumtetraborate were added. In the processes after this point the same steps were again followed with the difference of temperature at 50 °C.

2.3. The general UA-CPE procedure

For the UA-CPE, 3.0 mL aliquots of the sample or a series of standard solutions containing sulfite in the range of 0.04–70 μg L−1, 0.8 mL of citrate buffer at pH 6.0, 0.5 × 10⁻⁵ mol L−1 of DPTZ, 4.0 × 10⁻³ mg L−1 of Fe(III), 0.75 × 10⁻⁵ mol L−1 of SDS, and 0.6% (v/v) of PONPE 7.5 solution, respectively, were added to a 50 mL volumetric flask and diluted to the mark with water and transferred to a 50 mL glass tube. The glass tube was then incubated in the ultrasonic bath (350 watt, 40 Hz) at 35 °C for 5 min to start the process of extraction and preconcentration of analyte in the surfactant-rich phase. To accelerate the extraction and simplify the separation process, the mixture was separated to two separate phases by centrifugation for 5 min at 4000 rpm. Then, the test tube has been held in a refrigerator to facilitate phase separation, which is coacervated to the bottom of the vial. In this case, separation happens because there is a difference in density between the two phases. The separated surfactant-rich phase was diluted to 0.75 mL with methanol to decrease the viscosity using a vortex agitator at 3000 rpm for ten seconds and facilitate its introduction into the nebulizer of the FAAS. Moreover, a blank solution without sulfite was submitted to the same method and measured in parallel to the samples.

Also, in terms of applicability to real time samples, the UA-CPE/FAAS method was applied to accurate and reliable determination of sulfite (as free, total and reversibly bound) existing in the foods (onion slices, vinegar, seasoning powder, dried apple, dried grapes, nuts, preserved almond, and starch syrup) and beverages (sparkling white wine, white wine, beer, apple juice and mango juice). The reversibly bound sulfite level was calculated from difference between free sulfite and total sulfite levels after pre-treatment based on two different extraction approaches. The recovery rates of known amounts of sulfite spiked to the samples were analyzed by using the proposed method. The results are summarized in Table 1 in detail. It can be seen that the good recoveries are achieved in the range of 95.8–102.4% for foods and 95.6–102.8% for beverages with RSDs of 1.3–4.1% and 1.2–3.6% respectively.

Table 1 Determination of free, reversibly bound and total sulfite in foods and beverages (n: 5)
Samples Added free sulfite (μg L−1) By the first preparation process By the second preparation process
Found (μg kg−1) RSDs% Recovery% Found (μg kg−1) RSDs% Recovery%
Free sulfite Reversibly bound sulfite Total sulfite Free sulfite Reversibly bound sulfite Total sulfite
Food samples
Onion slices 9.4 ± 0.07 23.8 33.2 ± 0.2 3.3 9.3 ± 0.08 23.9 33.2 ± 0.1 3.5
1 10.1 ± 0.07 24.0 34.1 ± 0.2 2.5 96.9 10.0 ± 0.08 24.0 34.0 ± 0.1 2.4 97.5
5 14.1 ± 0.1 23.5 37.6 ± 0.3 1.9 98.2 14.2 ± 0.09 23.7 37.9 ± 0.2 1.8 98.9
Vinegar 11.2 ± 0.09 14.7 25.9 ± 0.1 4.1 11.4 ± 0.08 14.2 25.6 ± 0.2 3.9
1 11.8 ± 0.1 14.3 26.1 ± 0.2 3.5 97.7 12.0 ± 0.1 14.8 26.8 ± 0.2 3.3 96.9
5 16.1 ± 0.1 14.8 30.9 ± 0.3 2.3 99.1 16.2 ± 0.2 14.9 31.1 ± 0.3 2.0 98.8
Seasoning powder 1.5 ± 0.05 18.9 20.4 ± 0.1 3.1 1.4 ± 0.04 18.1 19.8 ± 0.1 3.0
1 2.4 ± 0.05 19.5 21.9 ± 0.2 2.5 95.8 2.5 ± 0.04 18.7 21.2 ± 0.2 2.7 101.8
5 6.4 ± 0.06 19.6 26.0 ± 0.2 1.8 98.1 6.3 ± 0.05 19.0 25.3 ± 0.2 1.9 99.0
Dried apple 11.9 ± 0.09 32.0 43.9 ± 0.3 3.7 12.1 ± 0.09 32.2 44.3 ± 0.3 3.9
1 13.2 ± 0.1 31.8 45.0 ± 0.3 2.5 102.1 13.4 ± 0.1 32.9 46.3 ± 0.3 2.6 102.4
5 16.7 ± 0.1 31.5 48.2 ± 0.4 1.8 98.9 17.1 ± 0.2 32.8 49.9 ± 0.4 1.5 101.1
Dried grapes 0.8 ± 0.04 5.4 6.2 ± 0.09 3.5 0.9 ± 0.03 5.2 6.1 ± 0.08 3.4
1 1.7 ± 0.05 5.8 7.5 ± 0.1 2.6 97.3 1.8 ± 0.04 5.7 7.5 ± 0.08 2.2 96.9
5 5.9 ± 0.05 5.3 11.2 ± 0.2 1.7 100.9 5.9 ± 0.04 5.5 11.4 ± 0.1 1.4 99.5
Nuts 10.5 ± 0.09 13.1 23.6 ± 0.2 3.2 10.9 ± 0.09 13.8 24.7 ± 0.2 3.3
1 11.0 ± 0.1 13.0 23.0 ± 0.2 2.1 95.9 11.5 ± 0.1 14.0 25.5 ± 0.2 2.6 96.5
5 15.1 ± 0.1 12.6 27.7 ± 0.3 1.3 97.4 15.7 ± 0.1 13.3 29.0 ± 0.3 1.7 98.9
Preserved almond 7.3 ± 0.07 8.3 15.6 ± 0.1 3.5 7.4 ± 0.08 8.3 15.7 ± 0.1 3.3
1 8.2 ± 0.08 8.5 16.7 ± 0.2 2.6 98.1 8.1 ± 0.08 8.8 16.9 ± 0.1 2.4 96.9
5 13.6 ± 0.1 8.6 22.2 ± 0.2 1.8 101.2 12.3 ± 0.1 8.2 20.5 ± 0.2 1.6 99.5
Starch syrup 3.8 ± 0.03 9.7 13.5 ± 0.1 3.3 4.0 ± 0.03 9.9 13.9 ± 0.1 3.5
1 5.3 ± 0.04 10.1 15.4 ± 0.1 2.2 101.9 5.1 ± 0.03 9.1 14.2 ± 0.1 2.3 102.2
5 8.7 ± 0.04 10.5 19.2 ± 0.2 1.7 99.4 9.1 ± 0.04 10.4 19.5 ± 0.2 1.5 101.0
Beverage samples
Sparkling white wine 11.5 ± 0.1 15.6 27.1 ± 0.2 3.6 11.7 ± 0.1 15.4 27.1[thin space (1/6-em)]±[thin space (1/6-em)]0.2 3.4
1 12.0 ± 0.1 16.1 28.1 ± 0.3 2.7 95.6 12.4 ± 0.2 16.3 28.7 ± 0.2 2.5 97.5
5 16.1 ± 0.2 15.8 31.9 ± 0.3 1.5 97.3 16.5 ± 0.2 16.0 32.5 ± 0.3 1.2 98.9
White wine 19.9 ± 0.2 21.7 41.6 ± 0.3 3.3 19.5 ± 0.2 21.1 40.6 ± 0.3 3.1
1 20.3 ± 0.2 21.8 42.1 ± 0.3 2.9 96.9 19.9 ± 0.2 22.0 41.9 ± 0.3 2.6 96.9
5 25.2 ± 0.3 21.0 46.2 ± 0.4 1.6 101.0 24.3 ± 0.3 21.8 46.1 ± 0.3 1.3 99.1
Beer 3.1 ± 0.05 15.2 18.3 ± 0.1 3.7 3.3 ± 0.06 15.3 18.8 ± 0.1 3.8
1 4.2 ± 0.05 14.8 19.0 ± 0.1 2.5 102.3 4.2 ± 0.06 15.7 19.9 ± 0.2 2.6 97.5
5 8.0 ± 0.08 15.1 23.1 ± 0.3 1.9 98.7 8.2 ± 0.07 14.4 22.6 ± 0.2 1.7 98.8
Apple juice 7.8 ± 0.09 13.4 21.2 ± 0.1 3.4 7.7 ± 0.08 13.6 21.3 ± 0.2 3.3
1 8.9 ± 0.1 13.6 22.5 ± 0.2 2.8 101.9 8.9 ± 0.1 13.3 22.2 ± 0.2 2.5 102.8
5 13.0 ± 0.1 13.9 26.9 ± 0.2 1.9 100.8 12.8 ± 0.1 13.7 26.5 ± 0.3 1.4 100.7
Mango juice 3.1 ± 0.03 5.4 8.5 ± 0.07 3.1 3.2 ± 0.03 5.5 8.7 ± 0.08 3.3
1 4.0 ± 0.05 5.9 9.9 ± 0.08 2.5 96.9 4.1 ± 0.04 5.2 9.7 ± 0.09 2.6 96.6
5 8.0 ± 0.06 5.7 13.7 ± 0.1 1.4 98.8 8.1 ± 0.05 5.4 13.5 ± 0.1 1.2 98.7


3. Results and discussion

The proposed method is based on the reduction of Fe(III) to Fe(II) using sulfite in citrate buffer at pH 6.0 and the subsequent selective ternary complex formation of reduced Fe(II) with DPTZ in presence of SDS as auxiliary ion-pairing ligand (eqn (1)–(3)). The initial studies were carried out using 0.5 × 10⁻⁵ mol L−1 of DPTZ, 4.0 × 10⁻³ mg L−1 of Fe(III), 0.75 × 10⁻⁵ mol L−1 of SDS, 0.6% (v/v) of PONPE 7.5, and citrate buffer (pH 6.0). The absorbance values of the resulting colored ternary complex were indirectly detected and measured by FAAS at resonance line of iron produced, which is linearly related to sulfite concentration, and correlated to the concentration of sulfite. Also, it was observed in literature19 that Fe(III) ions gave a stable complex with citrate (with a stability constant of log[thin space (1/6-em)]β = 19.8) at pH 6.1, and complex hydrolyzed with a pKa value of 3.3 as anionic complex, FeL(OH). Similarly, it was observed that Fe(III) ions gave stable dimeric complexes, Fe2(SO3)(OH)3+ or [Fe(OH)Fe(SO3)]3+ with log[thin space (1/6-em)]K21 = 3.37 ± 0.16 depending on pH and its concentration in pH range of 2.5–6.0 at 430 nm before pre-reduction of Fe(III) to Fe(II).20,21
 
FeL + H2O → FeL(OH) + H+, anionic citrate complex formation at pH 6.0 (1)
 
FeL(OH) + HSO3 → (HO)FeL(SO3H)2−, anionic bisulfite complex formation (2)
 
(HO)FeL(SO3H)2− + 2DPTZ as tridentate ligand → Fe(DPTZ)22+ + HL2− + HSO4 (3)
 
Fe(DPTZ)22+ + 2SDS → Fe(DPTZ)2(SDS)2(aqueous phase) ↔ Fe(DPTZ)2(SDS)2(surfactant rich phase) (4)

DPTZ is a selective Fe(II) binding reagent, and its metal complexes are easily soluble in water.22,23 Because of high water solubility, the cationic Fe(DPTZ)22+ complex can't quantitatively be extracted into surfactant rich phase. To determine minimum detectable levels of sulfite in a wide working range, the UA-CPE has been explored using anionic surfactant, SDS as ion-pairing agent with opposite charge. The UA-CPE can be used when the target analytical species are hydrophobic in nature. Though the Fe(DPTZ)22+ complex is water soluble, it has been successfully extracted into surfactant rich phase in presence of SDS as counter ion, and it can be explained through the following mechanism. When the concentration of surfactant is lower than the critical micellar concentration (CMC), only slightly soluble ion-associates can be formed between cationic Fe(DPTZ)22+ complex and mixed surfactant monomers causing turbidity. Electrostatic interaction between the cationic metal–ligand complex, Fe(DPTZ)22+ and the anionic surfactant, SDS takes place through the positively charged the metal–ligand complex and the negatively charged head group of the anionic surfactant molecule, SDS in presence of PONPE 7.5 as extracting agent. The solubilizing effect of the nonionic surfactant begins at CMC and above, hence the neutral hydrophobic ternary complex and/or ion-pairing complex gets trapped into the micelles. Once the ternary complex gets incorporated into the micellar core of nonionic surfactant, PONPE 7.5, it becomes easy to separate it from the aqueous phase. Addition of salts to ionic micellar solution reduces the mutual electrostatic repulsions of charged head groups. This leads to an increased aggregation number and micellar diameter. High concentrations of salt cause anionic surfactant solutions to separate into immiscible surfactant rich and surfactant-poor phases.24–26

3.1. Parameters of methodology affecting the extraction efficiency

The various analytical variables such as pH, buffer type and concentration, concentrations of Fe(III) and primary chelating agents, surfactants type and concentration, and incubation conditions were individually optimized by using model solutions in order to obtain the maximum extraction efficiency% (near to 100%). To obtain the EE%, a sample solution and a blank solution spiked 10 μg L−1 of sulfite were comparatively submitted to the proposed UA-CPE under the optimized reagent conditions. After the phase separation step, the surfactant-rich phases of both the sample solution and blank solution were diluted to 0.75 mL with methanol. The analytical signal of the spiked blank solution was accepted as 100%. The EE% of sulfite by nonionic surfactant, PONPE 7.5 as extracting agent from the aqueous sample was calculated as follows;
image file: c5ra26554a-t1.tif
where Ci symbolizes the concentration of sulfite in the initial sample of volume Vi, Cc symbolizes the concentration of sulfite in the aqueous phase of volume Vc, and Cs, symbolizes the concentration of sulfite in the surfactant rich phase of volume Vs.

The pH is the first evaluated parameters to obtain the best extraction efficiency, since the pH is one of the main parameters for ion-pairing formation and/or ternary complex formation reaction with enough hydrophobicity. Therefore, the effect of pH on indirect EE% of 10 μg L−1 of sulfite was investigated using different buffer solutions. The effect of pH on the analyte EE% is shown in Fig. 1(a), which shows higher EE% at pH 6.0 of citrate buffer for sulfite. Thus, a citrate buffer of pH 6.0 was chosen in terms of method development, resulting in RSD values ranging from 1.2% to 3.7%.


image file: c5ra26554a-f1.tif
Fig. 1 Effect of pH and concentrations of chemical reagents on extraction efficiency. Optimal conditions: 10 μg L−1 SO32−, 0.8 mL of citrate buffer at pH 6.0, 0.5 × 10⁻⁵ mol L−1 DPTZ, 4.0 × 10⁻³ mg L−1 Fe(III), 0.75 × 10⁻⁵ mol L−1 SDS, and 0.6% (v/v) PONPE 7.5 under ultrasonic power (350 watt, 40 Hz) at 35 °C for 5 min and centrifugation time of 5 min at 4000 rpm.

After determining the optimum pH, the effect of citrate buffer amount added on the analytes EE% was examined in range of 0.1–2.5 mL in Fig. 1(b). The EE% was maximum when 0.8 mL of citrate buffer solution was added to a final volume of 50 mL of analytical solution. Above 0.8 mL, there was a decrease in the EE% of ternary complex, which has a linearly related to sulfite concentration. In this stage, it was observed that the solution became more unclouded with the increase in citrate buffer amount. Thus, a 0.8 mL of pH 6.0 of citrate buffer solution was selected for the best EE%, for the further experiments.

DPTZ is a pyridylazo compound, which acts as a tridentate ligand. It binds the metal ions such as Fe(II), Cu(II) and Ni(II) through the pyridine nitrogen atom and the triazine–nitrogen atom, so as to give the stable cationic complexes. The chelating reagent was employed as chromogenic-extraction reagent during spectrophotometric determination of iron in acids and acidic solutions.27 It was also employed as precolumn derivatizing reagent in the HPLC method with UV absorbance detection for the Fe(II) determination.28 The stoichiometry of metal–chelate is 1[thin space (1/6-em)]:[thin space (1/6-em)]2. The EE% as a function of the chelating agent concentration was examined and the results were shown in Fig. 1(c). As could be understood from the results, the EE% for sulfite increased up to a concentration of 0.5 × 10⁻⁵ mol L−1. Above this concentration, there was a decrease in the EE% of sulfite, this decrease in EE% may be due to the concentration dependent transfer of DPTZ as a hydrophobic ligand into the surfactant rich phase as well as ternary complex at higher concentrations, so that it causes an increase in blank signal. Thus, a concentration of 0.5 × 10⁻⁵ mol L−1 was selected for the best EE% in all subsequent experiments. Moreover, the precision as RSD% at this concentration range are between 1.1% and 2.9%.

The variation of the EE% as a function of the concentration of the Fe(III) in the presence of 10 μg L−1 sulfite was studied in range of (1–10) × 10−3 mg L−1. The results in Fig. 1(d) show that the EE% of the analyte linearly increased with Fe(III) concentration up to 4.0 × 10⁻³ mg L−1. The maximum EE% gradually decreased with increasing slope at the higher volumes. The cause of this decrease in EE% may be (a) primary hydrolysis giving rise to low-molecular-weight complexes (monomer- and dimer-), i.e., Fe(OH)2+, Fe(OH)2+, Fe2(OH)24+; (b) formation and aging of polynuclear polymers, i.e., Fen(OH)m(H2O)x(3nm)+ or FenOm(OH)x(3n−2mx)+; (c) precipitation of ferric oxides and hydroxides, i.e., Fe(OH)3, FeOOH and Fe2O3, so as to cause increase in blank signal after electrostatic interaction with SDS in absence of sulfite. Thus, 4.0 × 10⁻³ mg L−1 Fe(III) was selected for the best EE% all subsequent experiments. Moreover, the RSD values at this optimal concentration ranged from 1.8% to 3.3%.

The variation of EE% as a function of ionic surfactants such as CPC, CTAB and SDS concentration is shown in Fig. 1(e). The dependence of UA-CPE to ionic surfactants concentration was studied in the range of (0.1–1.5) × 10−5 mol L−1 in the presence of sulfite. As a result of studies, it was found that EE% of ternary complex, which is linearly related to sulfite concentration, is more efficient in the presence of anionic surfactant, SDS. The cationic Fe(II)L22+ complex forms an ion-pairing complex with counter ion, SDS, and is extracted into non-ionic surfactant, PONPE 7.5. A concentration of 0.75 × 10⁻⁵ mol L−1 of SDS is chosen as optimum value for the best EE% of sulfite in all subsequent experiments. Moreover, the RSD values at this concentration were in range of 1.2–3.1%. Generally, the existence of chemically active groups in the nonionic surfactants such as Triton X-45, 100 and 114, PONPE 7.5 and Tween 20 can be evaluated to be advantageous under certain conditions when electrostatic interactions are suitable. In this study, the PONPE 7.5 was chosen as surfactant due to its low cloud point temperature (CPT) and high density of the surfactant-rich phase, which facilitates phase separation by centrifugation. Moreover, the surfactant is commercial availability, high purity grade, stable, non-volatile, relatively non-toxic and eco-friendly reagents when compared with organic solvents. Also, the concentration of the PONPE 7.5 is a critical factor for the UA-CPE. The PONPE 7.5 with small concentration was not enough for the complete extraction. When large concentration of PONPE 7.5 was used, the surfactant-rich phase obtained after UA-CPE was too sticky and more difficult for subsequent handling.29 In this context, the effect of PONPE 7.5 concentration on the EE% of sulfite was studied in range of 0.05–1.0% (v/v). As can be seen from Fig. 1(f), the maximum EE% was obtained using 0.6% (v/v) PONPE 7.5. At concentrations above this value, the EE% can be decreased depending on the increase of the surfactant volume, deteriorating the FAAS signal. At concentrations below this value, the EE% of ternary complex, which is linearly related to analyte concentration, was low because there are few molecules of the surfactant quantitatively to entrap the Fe(DPTZ)2(SDS)2 complex. Thus, 0.6% (v/v) PONPE 7.5 was selected for the best EE% in all subsequent experiments. Moreover, the RSD values at this concentration were in range of 1.5–3.0%. Optimal equilibration temperature and incubation time are necessary to the completion of the complex formation and efficient phase separation. These parameters are very important in UA-CPE of sulfite. The cloud point can be varied depending on the experimental conditions and surfactant type. The CPT of the PONPE 7.5 is about 30 °C in aqueous solution. Some experimental studies have stated that in order to obtain a more favorable preconcentration factor, the CPE should be carried out at the temperatures higher than the CPT.29 In this study, the effect of the equilibration temperature (from room temperature to 65 °C) under ultrasonic power (350 watt, 40 Hz) on the CPT was also examined. As a result of experimental studies, it was found that the EE% reached to maximum at 35 °C for sulfite. Higher temperatures lead reversibly to the disassociation of ternary complex, and thus the reduction of EE%. So, an equilibration temperature of 35 °C was selected. Then, at the fixed temperature of 35 °C, the effect of the incubation time on EE% was studied in the range of 2–20 min. The maximum EE% was observed at 10 min. When incubation time above 10 min is used, a significant decrease in EE% has been observed, probably due to instability of the ternary complex. Thus, the equilibration temperature of 35 °C and time of 10 min were selected for the best EE% in all subsequent experiments. In addition to these experiments, centrifugation time and rate have been studied because they are very necessary to preconcentrate trace amounts of sulfite with high EE% in a short time. The experimental results show that centrifugation for 5 min at 4000 rpm leads to the maximum EE% and sensitivity for sulfite.

For the analyte introduction into the nebulizer of the FAAS, because the surfactant-rich phase obtained after separation with UA-CPE is very viscous, it was necessary to decrease the viscosity of the surfactant-rich phase. The highly viscous phase could be decreased using diluting agents such as several synthetic mixtures of varying compositions with respect to organic solvents and their acid mixtures. As a result of studies, the best results were obtained by dilution of surfactant rich phase to 0.75 mL with methanol. In these conditions, the extraction efficiency was approximately up to 100%.

4. The analytical figures of merit

The linear working range of the proposed method was studied by using a series of sulfite standard solutions ranging from 0.05 to 100 μg L−1 under the optimized reagent conditions. However, the linear calibration range was established in the range of 0.04–70 μg L−1. The calibration equation is ΔA = (0.0104 ± 0.0012) × CSulfite (μg L−1) + (0.0475 ± 0.004) with correlation coefficient of 0.9964; in range of 0.04–70 μg L−1. Where ΔA is the analytical signal expressed as absorbance change, r is the linear correlation coefficient and C is concentration of the sulfite. The limits of detection (LOD) and quantification (LOQ) based on three and ten times the standard deviation of the twelve blank measurements (3σblank and 10σblank, n: 12) were 0.012 and 0.038 μg L−1 respectively. As a result of five replicate measurements, the precision as the percent relative standard deviation, RSDs% for 5, 10 and 25 μg L−1 of sulfite was in range of 2.1–5.2%. The sensitivity enhancement factor (EF) is calculated as the ratio of slopes of the calibration curves obtained with and without preconcentration by means of UA-CPE. The preconcentration factor (PF) is calculated as the concentration ratio of sulfite in the final diluted surfactant rich phase ready for FAAS determination. In this context, in order to investigate the PF and EF of the sulfite, five replicate extractions were performed under the optimized conditions by using blank water samples spiked with the sulfite at the concentration of 10.0 μg L−1. From the results obtained, the PE and the EF values were found to be 67 and 145, respectively.

5. The matrix effect

The effect of potential interfering ions can be related to the preconcentration step. Because the interfering ions can react with any one of Fe(III), SDS or DPTZ and minimize EE%. To perform this study, 50 mL solution containing 10 μg L−1 sulfite and potential interfering ions in different interfering-to-analyte ratios was subjected to the UA-CPE procedure under the recommended conditions. The tolerance limit was identified as the concentration of added ion causing a relative error smaller than ±5.0%, which are related to the preconcentration and determination steps of sulfite. The results show that the presence of some anionic and cationic interfering species such as Cl, Br, SCN, I, SO42−, HCO3 and HPO42−; Na+, K+, NH4+, Ca2+, Mg2+, Cu2+, Co2+, Ni2+, Mn2+, Cr3+, VO2+ and MoO2+, at large amounts, which can commonly be found in food and beverages, have no significant effect on the UA-CPE of sulfite.

6. The method accuracy and its analytical applications

The accuracy and precision of the proposed method were evaluated in two ways in terms of the percent recovery rates and RSDs, respectively; firstly, the method was studied in terms of calibration curves, matrix effect, limits of detection (LOD) and of quantification (LOQ), recovery rate and precision (intra-day and inter-day) in accordance to FDA guidelines for the analysis of independently three dried fruit and beverage mixtures (a mixture of three dried fruit: 0.75 g dried apricots, 0.50 g dried grapes and 0.25 g dried peaches; 0.75 mL apricots juice, 0.5 mL grapes juice and 0.5 mL orange juice) by FAAS after UA-CPE. The calibration curves were obtained for the levels of sulfite concentration in the range of 0.1–500 μg kg−1 in methanol and in the matrix blank extract, corresponding to a range of 1–120 μg kg−1 in the sample with five replicates, separately. To evaluate the matrix effect in the FAAS analysis, the slopes of the calibration curves obtained from methanol and in matrix blank extracts were compared, and a significant difference between the slopes was not observed in terms of possible matrix effect. The real accuracy and precision of the method were also calculated in terms of intra-day and inter-day repeatability as recovery% and RSD% for fixed sulfite concentration of 10 μg kg−1. The intra-day analyses were performed by ten replicate analysis of the dried apricots sample under the optimal experimental conditions in the same day. The inter-day precision was performed by analyzing this sample once a day on ten consecutive days. The results obtained were shown in Table 2 in detail.
Table 2 The accuracy and precision results obtained from the analysis of dried fruit and beverage matrices by UA-CPE/FAAS method
Sample matrix Regression equationa [y = b(m ± Sm)x + (b ± Sb)b] Linear range (μg kg−1) LOD (μg kg−1) LOQ (μg kg−1) Intra-day Inter-day
Free sulfitec (μg kg−1) Found reversibly bound sulfited (μg kg−1) Found, Total sulfitec (μg kg−1) RSD% Free sulfitec (μg kg−1) Found, reversibly bound sulfited (μg kg−1) Found, Total sulfitec (μg kg−1) RSDs%
a From matrix-matched calibration curves.b The Sm and Sb are their standard deviations of slope and intercept of matrix-matched calibration curves (n: 5) obtained in dried fruit and beverage mixtures in 0.1–150 μg kg−1 respectively.c image file: c5ra26554a-t2.tif; t-Student coefficient for n − 1 degrees of freedom for free and total sulfite after pre-treatment with D-mannitol and methanesulphonic acid at pH 2.0 and with mannitol/Na2HPO4 at pH 9.5, respectively.d The reversibly bound sulfite level calculated from the difference between free sulfite and total sulfite after pre-treatment based on two different approaches.
A mixture of three different dried fruit (1.5 g, 3[thin space (1/6-em)]:[thin space (1/6-em)]2[thin space (1/6-em)]:[thin space (1/6-em)]1, w/w) y = 0.0097 ± 0.0002C(sulfite,μg kg−1) − 0.025 ± 0.001 0.1–150 0.75 2.5 11.8 ± 0.1 36.7 48.5 ± 0.3 2.5 11.5 ± 0.2 37.5 49.0 ± 0.4 2.2
A mixture of three beverages (1.75 mL, 3[thin space (1/6-em)]:[thin space (1/6-em)]2[thin space (1/6-em)]:[thin space (1/6-em)]2, v/v) y = 0.0075 ± 0.0001C(sulfite,μg kg−1) − 0.042 ± 0.003 0.1–150 1.2 3.9 6.5 ± 0.1 27.4 33.9 ± 0.2 2.7 6.7 ± 0.2 27.5 34.2 ± 0.2 2.0


Secondly, the sulfite levels of the samples similarly pretreated at pH 2.0 and 9.5 were measured and evaluated by comparing with those of the standard 5,5′-dithio-bis(2-nitrobenzoic acid) (DTNB). The analysis of the samples by standard DTNB method30 was carried out as follows: a known amount of the samples was placed in a volumetric tube of 10 mL and diluted with water approximately to 8.0 mL. Then, 1 mL of DTNB solution (0.060 g of DTNB per 100 mL of 10% ethanol) was added and diluted to the 10 mL with the water. The absorbance was measured at 412 nm against water as analyte blank after 15 min reaction at 20 °C. In order to reduce the absorbance of analyte blank and suppress the interference effect of potential ions present in selected samples such as Cu2+, Co2+, Ni2+, Mn2+, Cr3+, VO2+ and MoO2+, the pH of sample solution was initially adjusted to 6.5 with 0.2 mol L−1 phosphate buffer containing 250 μL of 0.02 mol L−1 oxalic acid. When a regression analysis (n: 6, independently) was conducted for a serial standard sulfite solution in range of 0.2–4.0 mg L−1 in presence of oxalic acid at pH 6.5, according to standard method, a good improvement in regression data was obtained as follows:

Abs = (0.265 ± 0.012) × Csulfite (mg L−1) + (0.0132 ± 0.0011) with a correlation of coefficient of 0.9985

Linear range was 0.004–3.5 mg L−1 with limits of detection and quantification of 0.0012 and 0.004 mg L−1 respectively. When necessary, in order to prevent possible nitrite interference in analysis of selected samples, 150 μL of 0.01 mol L−1 sulfamic acid was added to the matrix environment before the UA-CPE. The results were shown in Table 3 in detail.

Table 3 Comparison of results of selected reference samples with the modified standard DTNB method for accuracy and precision of the proposed method
Selected reference samples Added, free sulfite (μg kg−1) By the proposed method By the modified standard DTNB methoda The calculated Student t- and F-testsb
Found Free Sulfite (μg kg−1) RSD% Recovery% Found, reversibly bound sulfite (μg kg−1) Found, total sulfite (μg kg−1) Found free sulfite (μg kg−1) RSD% Recovery% Found, reversibly bound sulfite (μg kg−1) Found, total sulfite (μg kg−1)
a The modified standard DTNB method, which is based on detection of anionic degradation product at 412 nm using pH 6.5 phosphate buffer containing oxalic acid after stabilization of sulfite with mannitol for monitoring of free sulfite and total sulfite at pH 2.0 and 9.5 in order to slow down and control sulfite oxidation.b In order to compare the mean values and their standard deviations for independent two samples t- and F-tests with equal sample size the statistical t- and F-critical values at 95% confidence level and 8 degrees of freedom are 2.31 and 6.39, respectively.
Dried apricots 15.7 ± 0.1 2.8 29.2 44.9 ± 0.3 15.5 ± 0.2 3.0 29.7 45.2 ± 0.3 0.75, 2.4
1 16.1 ± 0.2 2.4 96.3 30 46.1 ± 0.3 15.8 ± 0.3 2.5 95.8 30.2 46.0 ± 0.4
5 20.2 ± 0.2 1.8 97.8 30.2 50.4 ± 0.4 19.9 ± 0.3 1.9 97.0 30.7 50.6 ± 0.5
20 35.4 ± 0.3 1.3 99.1 30.7 66.1 ± 0.5 35.9 ± 0.4 1.5 101.3 30.8 66.7 ± 0.5
Red wine 9.80 ± 0.1 3.1 39.8 49.6 ± 0.4 10.1 ± 0.1 3.3 39.2 49.3 ± 0.3 1.10, 2.8
1 10.4 ± 0.2 2.3 96.8 40.1 50.5 ± 0.4 10.7 ± 0.3 2.8 96.4 39.7 50.4 ± 0.3
5 14.6 ± 0.3 1.9 98.5 40.4 55.0 ± 0.5 15.5 ± 0.4 2.1 102.7 40 55.5 ± 0.4
20 29.9 ± 0.3 1.4 100.6 38.2 68.1 ± 0.5 29.7 ± 0.4 1.6 98.8 38.9 68.6 ± 0.5


7. The comparison of the proposed method with other methods in literature

According to the results obtained, the proposed method has provided advantages such as low LOD (0.012 μg L−1), linear working range of 1750 fold (0.04–70 μg L−1), good recovery rates in the range of (95.9–102.8%), high sensitivity enhancement factor (EF, 145) and good preconcentration factor (PF, 67) with lower RSD than 5.2% for accurate and reliable determination of sulfite in foods and beverages. The results obtained by the proposed method were compared with those of different separation and detection methods such as DLLME-UV-vis for determination sulfite in beverage and food samples (0.2 μg L−1 of LOD and linear range 2–100 μg L−1 with EF of 133),8 LC-ICP-MS for determination of sulfite in dry vegetables and fruits (0.02 mg L−1 of LOD and linear range 0.05–5 mg L−1 with RSDs <5.0%),9 VG-PD for determination of sulfite in beverages (0.7 μg L−1 of LOD and linear range 2–25 μg L−1 with 1.2% of RSD),10 IC for determination of free and total sulfite in red globe grape (0.002 and 0.05 mg L−1 of limits detection and recoveries ranged from 88 to 93% and 87 to 98%, respectively),11 amperometric detection using glassy carbon electrode modified with carbon nanotubes–PDDA–gold nanoparticles for determination of sulfite in fruit juices and wines (0.03 mg L−1 of LOD and linear range of 2–200 mg L−1 with 1.5% of RSD),13 HS-SDME-UV-vis for determination of sulfite in fruits and vegetables (0.004 mg L−1 of LOD, 5.13% of RSD, and linear range of 0.004–0.100 mg L−1 with EF of 380).14 As a result, the experimental findings indicate that the determination of sulfite using the UA-CPE coupled to FAAS was advantages of wider linear range, low detection limit, high selectivity and cost-effective with a good sensitivity enhancement. Moreover, the method is relatively inexpensive and simple in terms of devices and chemicals used according to other methods.

8. Conclusions

In the present study, a new method based on UA-CPE coupled to FAAS has been developed for sulfite (as free, total and reversibly bound) determination in the dried fruit and beverage samples. The UA-CPE procedure is based on the cationic Fe(DPTZ)22+ complex formation after reduction of Fe(III) to Fe(II) with sulfite at pH 6.0 and extraction of its further ternary complex formed in presence of SDS into micelles of PONPE 7.5. The UA-CPE approach using mixed micellar system of SDS and PONPE 7.5 is versatile, highly sensitive and simple, and moreover provides good EF and PF as a result of efficient separation. The advantages of the UA-CPE procedure include ease of operation, less toxic and dense than the organic solvents. The method allows indirect detection of sulfite at 0.012 μg L−1 levels in wider linearity range of 0.04–70 μg L−1 with good RSD. When considering all the mentioned results, the proposed method can be considered as an alternative tool to sensitive, poor precise, expensive, time-consuming and experienced user-requiring complex analytical techniques such as ICP-AES, VG-ICP-OES, and LC-ICP-MS.

Conflict of interest

The authors declare that it is not any conflict of interest.

Compliance with ethics requirements

This article does not contain any studies with human or animal subjects.

Acknowledgements

Financial assistance from the Cumhuriyet University Scientific Research Projects Commission (CUBAP with projects number of F-419), Sivas in Turkey, is sincerely thanked.

References

  1. S. I. Martins, W. M. Jongen and M. A. Van Boekel, Trends Food Sci. Technol., 2000, 11, 364–373 CrossRef CAS.
  2. L. Manzocco, S. Calligaris, D. Mastrocola, M. C. Nicoli and C. R. Lerici, Trends Food Sci. Technol., 2000, 11, 340–346 CrossRef CAS.
  3. J. Lock and J. Davis, TrAC, Trends Anal. Chem., 2002, 21, 807–815 CrossRef CAS.
  4. A. F. Gunnison and D. W. Jacobsen, Crit. Rev. Toxicol., 1987, 17, 185–214 CAS.
  5. E.C. Directive No. 95/2/EC of the European Parliament and of the Council of 20 February 1995 on food additives other than colours and sweeteners, http://ec.europa.eu/food/fs/sfp/addit_flavor/flav11_en.pdf, (accessed February 7, 2012).
  6. E.C. Directive 2006/52/EC of the European Parliament and of the Council of 5 July amending Directive 95/2/EC on food additives other than colours and sweeteners and Directive 94/35/EC on sweeteners for use in foodstuffs, http://eur-lex.
  7. C. Ruiz-Capillas and F. Jiménez-Colmenero, Food Chem., 2009, 112, 487–493 CrossRef CAS.
  8. H. Filik and G. Çetintaş, Food Anal. Methods, 2012, 5(6), 1362–1367 CrossRef.
  9. Z. Ni, F. Tang, Y. Liu, D. Shen and R. Mo, Food Sci. Technol. Res., 2015, 21, 1–6 CrossRef.
  10. M. H. Arbab-Zavar, G. H. Rounaghi, S. Rajabzadeh and N. Ashraf, Journal of Food Measurement and Characterization, 2013, 7(2), 75–80 CrossRef.
  11. J. Lin, Y. Zhu, W. Cheng, J. Wang, B. Wu and J. Wang, Food Sci. Technol. Res., 2014, 20(5), 1079–1085 CrossRef CAS.
  12. J. Cmelík, J. Machát, V. Otruba and V. Kanický, Talanta, 2010, 80, 1777–1781 CrossRef PubMed.
  13. M. Amatatongchai, W. Sroysee, S. Chairam and D. Nacapricha, Talanta, 2015, 133, 134–141 CrossRef CAS PubMed.
  14. E. Gómez-Otero, M. Costas, I. Lavilla and C. Bendicho, Anal. Bioanal. Chem., 2014, 406, 2133–2140 CrossRef PubMed.
  15. M. Colon, J. L. Todoli, M. Hidalgo and M. Iglesias, Anal. Chim. Acta, 2008, 609, 160–168 CrossRef CAS PubMed.
  16. K. V. Santosh and K. D. Manas, J. Agric. Food Chem., 2007, 21, 8319–8324 Search PubMed.
  17. N. Altunay and R. Gürkan, Food Anal. Methods, 2015, 1–14 Search PubMed.
  18. N. Altunay, R. Gürkan and K. Sertakan, Food Anal. Methods, 2015, 8, 2094–2106 CrossRef.
  19. N. Seraghni, S. Belattar, Y. Mameri, N. Debbache and T. Sehili, Int. J. Photoenergy, 2012, 212, 1–10 CrossRef.
  20. F. J. Millero, M. Gonzalez-Davila and J. M. Santana-Casiano, J. Geophys. Res., 1995, 100, 7235–7244 CrossRef CAS.
  21. G. Lente and I. Fabian, Inorg. Chem., 1998, 37, 4204–4209 CrossRef CAS PubMed.
  22. P. L. Croot and K. A. Hunter, Anal. Chim. Acta, 2000, 406, 289–302 CrossRef CAS.
  23. R. Gürkan and N. Altunay, Pak. J. Anal. Environ. Chem., 2013, 14(2), 16–27 Search PubMed.
  24. S. Devaramani and P. Malingappa, Sci. World J., 2012, 2012, 1–8,  DOI:10.1100/2012/152016.
  25. G. Jankovskiene and A. Padarauskas, Chemija, 2003, 14(3), 159–163 CAS.
  26. N. Altunay and R. Gürkan, Food Anal. Methods, 2015, 8, 994–1004 CrossRef.
  27. D. Chriswell and A. A. Schilt, Anal. Chem., 1974, 46(8), 992–996 CrossRef.
  28. W. Zhu, F. Wu, J. Zheng and C. Liu, Anal. Sci., 2007, 23(11), 1291–1296 CrossRef CAS PubMed.
  29. Y. Qin, J. Meng, X. Y. Li, J. Zhou, X. L. Sun and A. D. Wen, J. Chromatogr. B: Biomed. Sci. Appl., 2008, 872, 38–42 CrossRef PubMed.
  30. Y. Li and M. Zhao, Food Control, 2006, 17(12), 975–980 CrossRef CAS.

This journal is © The Royal Society of Chemistry 2016
Click here to see how this site uses Cookies. View our privacy policy here.