 Open Access Article
Understanding the self-assembly of TCNQ on Cu(111): a combined study based on scanning tunnelling microscopy experiments and density functional theory simulations
Daniele
Stradi
abd,
Bogdana
Borca
c,
Sara
Barja
ac,
Manuela
Garnica
ac,
Cristina
Díaz
b,
Josefa M.
Rodríguez-García
c,
Manuel
Alcamí
ab,
Amadeo L.
Vázquez de Parga
*a,
Rodolfo
Miranda
ac and
Fernando
Martín
ab
aInstituto Madrileño de Estudios Avanzados en Nanociencia (IMDEA-Nanociencia), Cantoblanco 28049, Madrid, Spain. E-mail: fernando.martin@uam.es
bDep. Química Módulo 13, Universidad Autónoma de Madrid, Cantoblanco 28049, Madrid, Spain
cDep. Física de la Materia Condensada, Universidad Autónoma de Madrid, Cantoblanco 28049, Madrid, Spain
dDepartment of Micro- and Nanotechnology (DTU Nanotech) and Center for Nanostructured Graphene (CNG), Technical University of Denmark, Ørsteds Plads, Building 345B, 2800 Kgs. Lyngby, Denmark
First published on 29th January 2016
Abstract
The structure of self-assembled monolayers of 7,7′,8,8′-tetracyano-p-quinodimethane (TCNQ) adsorbed on Cu(111) has been studied using a combination of scanning tunnelling microscopy (STM) experiments and density functional theory (DFT) calculations. We show that the polymorphism of the self-assembled molecular layer can be controlled by tuning of the experimental conditions under which the deposition is carried out. When the Cu(111) substrate is held above room temperature (TCu(111) = 350 K) during deposition, a structure is formed in which the two molecules in the unit cell are oriented one perpendicular to the other. Conversely, when the substrate is held at room temperature during deposition and slightly annealed afterwards, a more complex structure with five molecules per unit cell is formed. DFT calculations complement the experimental results by revealing that the building blocks of the two superstructures are two mutually orthogonal adsorption configurations of the molecule. The relative stability between the two observed polymorphs is reproduced by models of the two superstructures based on these two adsorption configurations.
1 Introduction
The ability of organic molecules to form self-organised structures on metallic surfaces has attracted considerable attention during the last decade, due to their potential application in a wide range of emerging technologies such as nano-electronics and solar energy conversion. Nowadays, complex hybrid interfaces with pre-defined functionalities can be created almost routinely by controlling the shape and composition of the supramolecular pattern.1–3 However, despite these achievements, the rational synthesis of such superstructures remains a difficult task. In fact, the atomic-scale order of the molecular assembly results from the delicate balance between all the possible types of interactions, of either chemical (covalent or ionic bonding) or physical origin (vdW bonding, dipole–dipole, etc.), taking place during the deposition process. Further complications arise for molecular deposition on reactive surfaces, as the spectrum of interactions includes not only those occurring between the individual adsorbates, but also those between the latter and the substrate.The systems which are probably the most exemplifying ones of such natural complexity are those in which the driving force for the self-assembly process is the result an ensemble of multiple competing interactions. In these systems, the relative equilibrium between these competing interactions might be altered depending on the precise experimental conditions under which the self-assembly process develops, such as the sample temperature or the molecular coverage. As a result, for a given combination of substrate and adsorbate, different polymorphic phases can be obtained depending on the fine-tuning of the experimental conditions.4–7
Hitherto, a considerable number of studies has focused either on the use of direct inter-molecular interactions,8–15 or of coordinating metallic centers,16 either supplied in a second deposition step,17–20 or being already present on the surface in the form of diffusing adatoms,21–24 to mediate the self-assembly process. On the other hand, while it is generally acknowledged that the presence of periodic molecular arrays may perturb the substrate electronic structure,25–27 the role of direct molecule–surface bonding has been rarely investigated.
7,7′-8,8′-Tetracyano-p-quinodimethane (TCNQ), together with its derivate 2,3,5,6-tetrafluoro-7,7′,8,8′-tetracyano-p-quinodimethane (F4-TCNQ) and the parent molecule tetracyanoethylene (TCNE), form a well known group of strong molecular electron acceptors. They have been regarded as promising building blocks for potential applications in magnetic,28,29 optics,30,31 and electronics32,33 molecular devices. Recent studies on the adsorption of TCNQ on Au(111)34,35 have revealed that the interaction between the molecule and the surface is rather weak, and the charge transfer between them negligible. The observed self-assembled structure has been claimed to be the result of the stabilization induced by N⋯H hydrogen bonds between neighbouring molecules. A very similar arrangement has also been found when the same molecules are deposited on graphene grown on Ir(111).36
On the other hand, a charge transfer-mediated strong molecule/substrate interaction appears to be an important factor governing the adsorption of this family of molecules on low-index copper surfaces.37–39 In particular, the bonding between the molecular cyano groups and the surface atoms is strengthened as a result of the transfer of electrons from the surface to the molecule, which charges it negatively and enhances its flexibility. Such strong interaction not only modifies the molecular charge state and geometry, but also induces a complex surface reconstruction, which in turn mediates the molecular self-assembly process.39 Adsorption-mediated surface reconstructions have also been observed for TCNE on the same surfaces.40
On Cu(111), most of the studies the have been focused on properties of the isolated molecules, rather than their monolayers. It has been demonstrated that TCNE co-exists in several different adsorption configurations, each one having different electronic properties depending on the extent of the molecular deformation.41 The interface between an isolated F4-TCNQ37,38 molecule and the Cu(111) surface has been also found to involve a strongly bent molecular geometry, as a result of the strong interaction with the metal. Recently, it has been suggested that such interaction is thermally activated.42
Early studies on TCNQ/Cu(111)43,44 have pointed out that, in analogy with TCNQ/Cu(100) and F4-TCNQ/Cu(111), the molecules are negatively charged upon deposition on the surface. After adsorption at room temperature, and subsequent imaging at 77 K, the absence of isolated molecules on the terraces has been interpreted as a sign of the strong inter-molecular interaction and high mobility at room temperature.44 Disordered regions have been found to co-exist with a variety of different ordered patterns organized in small domains. In this work, we use scanning tunnelling microscopy (STM) under ultra-high vacuum (UHV) conditions to show that, by tuning the experimental growth conditions, it is possible to control the formation of the different superstructures of TCNQ on Cu(111), which can thus be grown in much larger and homogeneous domains. We complement these experiments by accurate calculations based on density functional theory (DFT) including van Waals (vdW) interactions for both the isolated molecule and the two observed superstructures. We argue that the two superstructures are formed by two mutually orthogonal adsorption configurations of the isolated molecule. The relative energetic stability of the models of the two superstructures based on these two configurations is in agreement with the experimental observations.
2 Experimental details
The experimental measurements have been performed in an ultra-high vacuum (UHV) chamber with a base pressure of 3 × 10⁻¹¹ Torr equipped with a variable temperature scanning tunnelling microscopy (STM). The Cu(111) crystal has been cleaned according to usual cycles of Ar+ ion sputtering (1.5 keV) followed by annealing to 900 K. The TCNQ molecules (solid compound) have been sublimated at 350 K from a glass crucible heated by a tungsten filament. The STM images have been measured at room temperature (RT) by a variable temperature STM which has been operated in the constant current mode using etched tungsten tips cleaned in UHV.453 Computational details
The theoretical analysis has been performed using Density Functional Theory (DFT) and the projector augmented wave (PAW) method46,47 to describe the ionic cores, as implemented in VASP.48The adsorption of aromatic molecules on metals is a theoretical challenge, due to the significant contribution of the van der Waals interactions to the van der Waals adsorption energy and geometry.49,50 Such contributions are missing in most common used functionals within the local (LDA) and the generalized-gradient (GGA) approximations, usually employed to model solid-state systems and surfaces within DFT.51 To overcome this shortcoming, we have used two different approaches that consider explicitly the dispersion component in the evaluation of the total energy. In the first one, the vdW contribution has been included using a semi-empirical potential on top of the DFT energy (DFT+D2),52 calculated employing the GGA/PBE functional.53 Although this approach has been successfully used to describe the geometries of organic molecules and monolayers on metallic substrates,49,50,54,55 it is also known to overestimate their adsorption energies, due to the neglect of the expected screening of the metallic substrate.49,56 Therefore, we have also checked the reliability of the results obtained with DFT+D2 by performing a second set of calculations with the vdW-DF functional,57 using the OPT86B exchange term.58,59 Since the latter approach is computationally much more expensive than the former, we have used the DFT+D2/PBE method during the structural optimizations, and computed the vdW-DF total energies by performing single-point calculations on the DFT+D2/PBE optimized geometries.
To model the isolated TCNQ molecule on Cu(111) we have used a four-layer slab and a 5 × 6 surface unit cell. The surface lattice parameter of Cu(111) has been set to the experimental value a = 2.56 Å.60 The structures have been optimized sampling the Brillouin zone at the Γ-point with a convergence criterion for the forces equal to 0.01 eV Å−1. During the structural optimization, the two topmost surface layers and the molecule have been allowed to move. The total energies have been then computed using a regular grid of 3 × 3 × 1 k-points (for some selected calculations a 5 × 5 × 1 k-points grid has been also used). The transition paths between different configurations have been computed using the Climbing-Image Nudged Elastic Band (CI-NEB) method,61 and a 3 × 3 × 1 k-points grid.
Two different models of the full TCNQ monolayer on Cu(111) have been also considered, corresponding to the two superstructures observed experimentally. The models have been described using supercells of different size. For that representative of the complex one, we have used 288 Cu atoms (4 metal layers) and 5 TCNQ molecules, while for that representative of the orthogonal one we have used 136 Cu atoms (4 metal layers) and 2 TCNQ molecules. We have optimized both structures sampling the Brillouin zone at the Γ-point with a convergence criterion for the forces of 0.05 eV Å−1, allowing the two topmost metal layers and the molecules to relax. In order to ensure that the computed adsorption energies were meaningful despite of the different unit cells employed, we have checked that the calculated trends in the adsorption energy are maintained when the number of k-points is increased, by computing the adsorption energies of the complex model using a Γ point only and a Γ-centered 2 × 2 × 1 k-points meshes, and the adsorption energies of the orthogonal model using a 3 × 3 × 1 and a 5 × 5 × 1 k-points meshes. In all the supercells considered, a vacuum layer larger than 15 Å has been used. STM images have been calculated using the Tersoff–Hamann approximation.62
4 Experimental results
TCNQ molecules evaporated under UHV conditions on Cu(111), with the substrate held at room temperature, tend to form aggregate into large islands on the terraces. The molecular films grown under these conditions lack of long-range ordered domains, as shown in Fig. 1, where small domains of ordered molecules coexist with disordered regions. Similar results were previously obtained by Kamna et al.44 The observation of the coexistence of multiple local TCNQ arrangements suggests the coexistence of different adsorption configurations for TCNQ on Cu(111). At this point, it is also worth noticing that the absence of isolated TCNQ molecules in the STM images, which was already noticed in the experiments by Kamna et al.,44 seems to indicate high mobility of the molecule on Cu(111) at room temperature.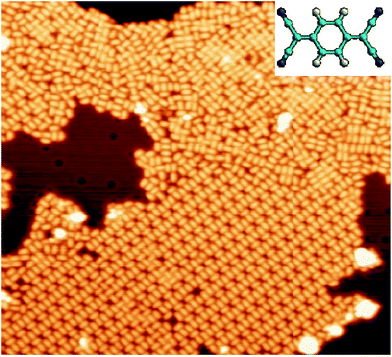 | ||
| Fig. 1 STM image (450 Å × 410 Å) displaying the TCNQ arrangement after deposition at room temperature. Vs = +1 V and It = 0.1 nA. Inset: schematic ball-and-stick representation of TCNQ molecule. | ||
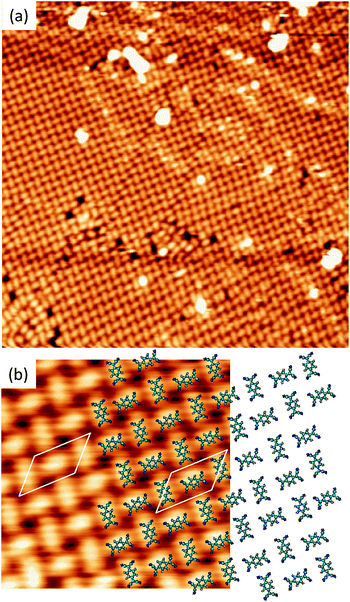
Long range domains can be achieved by annealing the sample, up to 350 K, after TCNQ deposition at RT. Annealing in fact allows the molecules to rearrange according to the minimum energy configuration by increasing their kinetic energy. At difference with the image shown in Fig. 1, STM images taken after annealing show highly ordered domains extending more than 150 nm (see Fig. 2a). The local arrangement of the molecules can be described by a rhombus-shape unit cell containing five TCNQ molecules. In Fig. 2b we show a sketch of a model that can account for the TCNQ arrangement observed experimentally, in which the unit cell presents a rhombus-shape. The lateral size of the unit cell measured in the STM images gives a length of 47.6 Å for the long diagonal and 19.5 Å for the short one. These values agree well with those obtained in the calculations (see below). The unit cell of this structure can be described in matrix notation as  based on the DFT calculation model (see below). In this complex structure, the three TCNQ molecules at the center of the unit cell locally arrange perpendicular to the unit cell long axis, whereas the remaining two molecules at both ends of the unit cell arrange parallel to the unit cell long axis. High-resolution measurements performed at 4.6 K fully support this assignment, showing that the two molecules at both ends of the unit cell are orthogonal to the three central ones.
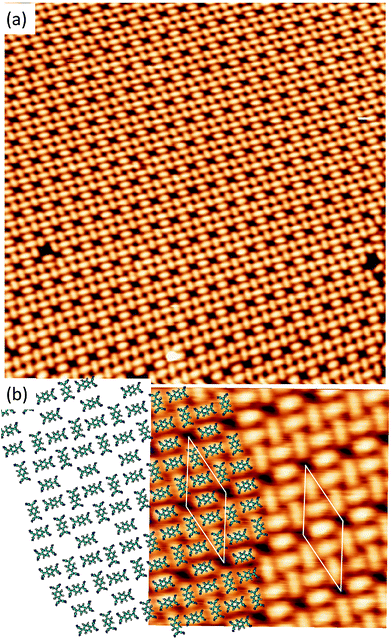
A different scenario occurs if the TCNQ deposition is carried out keeping the substrate temperature at 350 K. In this case, a new molecular arrangement is observed (see Fig. 3a). In this new arrangement the TCNQ molecules form an orthogonal structure in which two neighbouring molecules are rotated by 90° one with respect to the other (see Fig. 3b). In this figure we present a model that can account for the observed arrangement. In this case, the unit cell is a parallelogram that contains two molecules, has a lateral size of 16 Å × 8 Å and is described in matrix notation as  . Also in this case, this assignment in which two molecules in each unit cell are mutually orthogonal is fully supported by high-resolution measurements at 4.6 K.
The presence, in the two stable structures, of molecules perpendicular to each other implies that at least two different adsorption configurations occur in the TCNQ monolayer on Cu(111) surface, as the latter has hexagonal symmetry.
5 Theoretical results
The formation of the two patterns observed experimentally can not be explained by considering only intermolecular interactions as the driving force for the assembly. In both cases, the close vicinity of the electronegative cyano groups of neighbouring molecules would result in an unfavourable electrostatic repulsion, preventing the formation of an ordered monolayer in extended domains. Therefore, other effects balancing the unfavourable intermolecular interactions must be present, as also suggested by the fact that the different superstructures can be obtained depending on the precise experimental conditions.
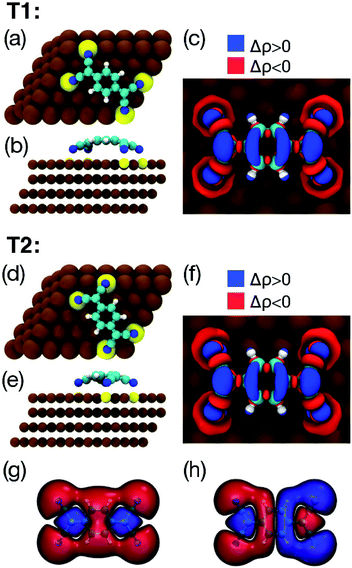
Fig. 4 shows the two lowest energy configurations, among all those considered, for an isolated TCNQ molecule adsorbed on Cu(111), as calculated using DFT+D2/GGA. The geometry of the most stable configuration (T1, see Table 1) is shown in Fig. 4a and b. The calculated adsorption energy of 3.72 eV (3.30 eV using the vdW-DF and the same k-points grid) is indicative of a strong interaction between the molecule and the surface. In this geometry the long axis of the molecule is aligned with the surface high symmetry direction [1![[2 with combining macron]](https://www.rsc.org/images/entities/char_0032_0304.gif) 0]. The molecule is strongly bent, with the phenylene ring lying on top of a Cu atom and 3.33 Å over the surface plane, 1.31 Å above the four N atoms (see Table 2). The Cu atoms sitting right below the cyano groups are lifted up by 0.18 Å with respect to the surface plane, similarly to what observed previously for TCNQ/Cu(100)39 and TCNE/Cu(100).40 As in the case of TCNQ/Cu(100),39 the bending of the molecule occurs because of the charge transfer from the surface, which destroys the typical conjugation of gas-phase TCNQ, enhancing its conformational freedom. Indeed, an analysis of the charge transfer based on Bader partition of the electronic density63 indicates that, upon adsorption on Cu(111), the molecule gains about 1.4 electrons, and that the negative charge is concentrated on the nitrogen atoms. The comparison between the charge redistribution upon TCNQ adsorption (Fig. 4c) and the frontier molecular orbitals of gas-phase TCNQ (Fig. 4g and h) support the idea that the electrons are transferred from the surface to the LUMO of the neutral molecule. Similarly to the case of F4-TCNQ on Cu(111)37 and Ag(111),64 there is also a weaker back-donation to Cu(111) from deeper molecular orbitals localised mainly on the cyano groups.
0]. The molecule is strongly bent, with the phenylene ring lying on top of a Cu atom and 3.33 Å over the surface plane, 1.31 Å above the four N atoms (see Table 2). The Cu atoms sitting right below the cyano groups are lifted up by 0.18 Å with respect to the surface plane, similarly to what observed previously for TCNQ/Cu(100)39 and TCNE/Cu(100).40 As in the case of TCNQ/Cu(100),39 the bending of the molecule occurs because of the charge transfer from the surface, which destroys the typical conjugation of gas-phase TCNQ, enhancing its conformational freedom. Indeed, an analysis of the charge transfer based on Bader partition of the electronic density63 indicates that, upon adsorption on Cu(111), the molecule gains about 1.4 electrons, and that the negative charge is concentrated on the nitrogen atoms. The comparison between the charge redistribution upon TCNQ adsorption (Fig. 4c) and the frontier molecular orbitals of gas-phase TCNQ (Fig. 4g and h) support the idea that the electrons are transferred from the surface to the LUMO of the neutral molecule. Similarly to the case of F4-TCNQ on Cu(111)37 and Ag(111),64 there is also a weaker back-donation to Cu(111) from deeper molecular orbitals localised mainly on the cyano groups.
| Config. | d N–Cu (Å) | d phenyl–Cu (Å) | d shift (Å) |
|---|---|---|---|
| T1 | 2.02 | 3.33 | 0.18 |
| T2 | 2.10 | 3.07 | 0.10 |
| B | 2.07 | 3.17 | 0.21 |
The geometry of the second most stable configuration (T2, see Fig. 4d and e) is aligned with the surface [1![[1 with combining macron]](https://www.rsc.org/images/entities/char_0031_0304.gif) 1] high symmetry direction. By comparing the relevant molecular parameters of the two configurations in Table 2, it can be seen that, when the molecule is adsorbed in the T2 configuration, the phenylene ring lies closer to the surface (3.07 Å), 0.97 Å above the four nitrogen atoms, i.e., the molecular geometry is flatter than in T1. The larger distance between the TCNQ nitrogen atoms and the underlying Cu atoms, and the smaller displacement of the latter from the surface plane, suggest that in this case the Cu–N bonding is weaker than in the case of the T1 configuration, which is consistent with the lower adsorption energy.
1] high symmetry direction. By comparing the relevant molecular parameters of the two configurations in Table 2, it can be seen that, when the molecule is adsorbed in the T2 configuration, the phenylene ring lies closer to the surface (3.07 Å), 0.97 Å above the four nitrogen atoms, i.e., the molecular geometry is flatter than in T1. The larger distance between the TCNQ nitrogen atoms and the underlying Cu atoms, and the smaller displacement of the latter from the surface plane, suggest that in this case the Cu–N bonding is weaker than in the case of the T1 configuration, which is consistent with the lower adsorption energy.
When the molecular aromatic ring sits above a bridge site (B configuration), the picture is slightly different. Even if the geometrical parameters (see Table 2) suggest a stronger interaction between the cyano groups and the surface than that present for the molecule having the T2 configuration, the adsorption energy is only −2.69 eV (see Table 1), 0.98 eV lower than that of T2 (DFT+D2/PBE level of theory and 3 × 3 × 1 k-points grid, see Table 1). This last result remains unchanged if the vdW-DF is employed. This means that, in addition to the hybridization of the cyano groups with the surface, also the position of the aromatic ring above the surface has an influence in determining the energetics of adsorption.
The adsorption energy of T1 and T2 differs only by 50 meV (80 meV using the vdW-DF). Fig. 5 shows the energy path for the interconversion between these two configurations. It can be seen that no other minima are present along this path, and that the barrier calculated using DFT+D2 is fairly high (0.63 eV).
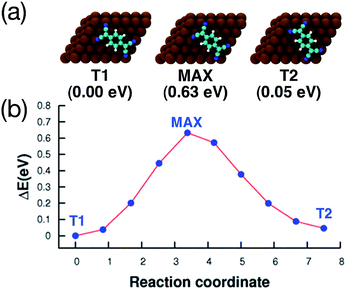 | ||
| Fig. 5 Interconversion between the two adsorption configurations shown in Fig. 4, calculated using the CI-NEB method. (a) Top view of the geometries and energies relative to the most stable adsorption configuration (T1), the configuration at the maximum of the barrier (MAX), and the second most stable configuration (T2). Cu, C, N and H atoms are printed in brown, cyan, blue and white, respectively. (b) Reaction path for the interconversion. In both axis, the 0 is placed at the most stable adsorption configuration. | ||
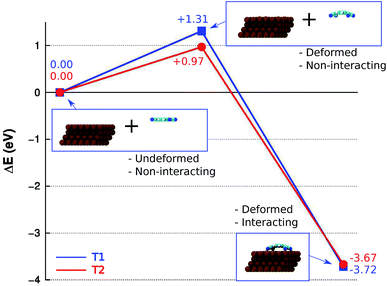
The DFT+D2 energy decomposition diagram associated with the interaction between the isolated molecule and the Cu(111) surface for minima T1 and T2, shown in Fig. 6, provides an insight into the role of the deformations of each fragment in the energetics of the adsorption process. In the case of T1, the energy loss associated with the deformation of the molecule, ΔEdef.,TCNQ(T1) = +0.74 eV, and of the substrate ΔEdef.,Cu(111)(T1) = +0.57 eV, from they initial ground state geometry, leads to an overall increase in energy ΔEdef.(T1) = +1.31 eV. The latter is larger than the overall energy increase calculated for T2, ΔEdef.(T2) = +0.97 eV, for which ΔEdef.,TCNQ(T2) = +0.35 eV and ΔEdef.,Cu(111)(T2) = +0.63 eV. However, the energy gain associated with the interaction of the distorted fragments is larger for T1, ΔEint.(T1) = +5.03 eV, than for T2, ΔEint.1(T2) = +4.64 eV, leading to a larger stability of the T1 minimum with respect to the T2 minimum. The origin of such trend can be understood by considering that the larger distortions in T1 lead to a more favourable overlap, compared to T2, between the molecular orbitals involved in the molecule–surface bonding and the Cu(100) electronic bands, resulting in the larger stability of T1 with respect to T2. Overall, the results obtained for the isolated TCNQ molecule on Cu(111) suggest that, among all the possible adsorption configurations considered, the T1 and T2 configurations shown in Fig. 4 will be the most frequently occupied.
Indeed, a mixture of the T1 and T2 configurations is well suited to construct the two superstructures observed experimentally. Fig. 7a and 8a show the optimized geometries of the complex and orthogonal superstructures, respectively, constructed by using geometries T1 and T2 as building blocks. The simulated STM images shown in Fig. 7b and 8b are in excellent agreement with the experimental data, demonstrating the reliability of these two models in describing the observed patterns. In the monolayer, each molecule behaves very similarly as in the isolated case. The charge transfer between each molecule and the surface (1.3 electrons per molecule, according to Bader's analysis of the electronic density) enhances the molecular flexibility, strengthening the interaction between the cyano groups of the molecule and the underlying Cu atoms.
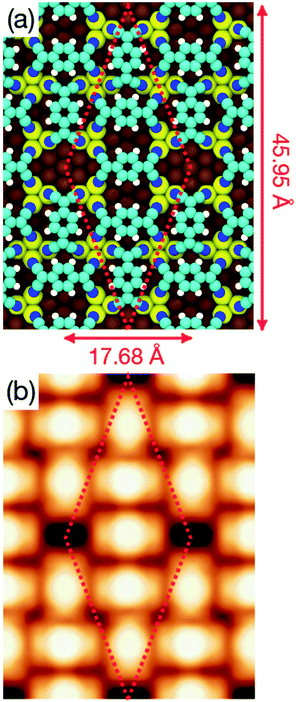 | ||
| Fig. 7 (a) Optimized geometry of the complex structure obtained at the DFT+D2/PBE level of theory. Colour code for atoms is the same as in Fig. 4. (b) Simulated STM topography of the same structure for an applied bias voltage Vs = +1.0 V. | ||
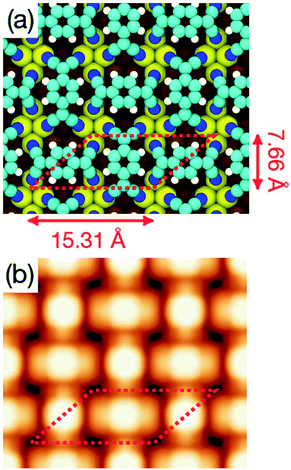 | ||
| Fig. 8 (a) Optimized geometry of the orthogonal structure monolayer obtained at the DFT+D2/PBE level of theory. Color code for atoms is the same as in Fig. 4. (b) Simulated STM topography of the same structure for an applied bias voltage Vs = +1.0 V. | ||
Table 3 lists the adsorption energies of the two superstructures calculated at different levels of theory and k-points meshes. It can be seen that, independently of the functional and k-points mesh used, theory predicts the complex structure to be favoured over the orthogonal one by ∼0.3 eV per molecule. The higher stability of the complex structure is in agreement with the experimental observation that an annealing treatment leads to the formation of large areas of this pattern. As speculated previously in the case of F4-TCNQ,38 the lower adsorption energies of the monolayer, compared to those of the isolated molecule, might be due to the small lattice parameter of Cu(111), which forces the molecules in the densely packed layer to adopt an highly distorted geometry. Furthermore, it should be noticed that the interconversion energy barrier between the T1 and T2 configurations is considerably larger than that corresponding to the temperature at which the experiments are carried out. As the chemistry involved in this interconversion process can be expected to be rather similar to that associated with the transition from the complex to the orthogonal self-assembled structures, it is reasonable to assume that the two processes will have comparable energy barriers. This explains why a spontaneous interconversion between the two self-assembled structures is not observed even in the room-temperature experiments.
The higher stability of the complex pattern, in addition to the higher T1![[thin space (1/6-em)]](https://www.rsc.org/images/entities/char_2009.gif) :
:![[thin space (1/6-em)]](https://www.rsc.org/images/entities/char_2009.gif) T2 ratio, can be associated with its sparser packing. On the one hand, the strain induced by the surface reconstruction, due to the molecular adsorption, will be accommodated more efficiently, if large areas of free surface are present within the monolayer structure. Indeed, this is the case for the complex structure, which presents relatively large portions of the unit cell in which the Cu(111) substrate remains exposed even after adsorption. This characteristic is reflected also in the larger surface area available per molecule (81.26 Å2 per molecule) compared to the denser orthogonal one (67.72 Å2 per molecule). On the other hand, the complex structure also presents a larger variety of bonding patterns involving the electronegative cyano groups than the orthogonal one. In both structures, the unfavourable contribution deriving from the close vicinity of the negatively charged cyano groups belonging to neighbouring TCNQ molecules is counterbalanced by the upward shift of the underlying copper atoms. However, in the orthogonal geometry, every nitrogen atom bonded to the surface is close to other three nitrogen atoms. Whereas the complex structure also presents bonding situations in which each nitrogen has only two other neighbours. This will decrease the average number of neighbours per nitrogen atoms in the complex structure (2.4 neighbours per atom), with respect to the orthogonal structure (3 neighbours per atom). While the favourable contribution per Cu–N bonding pair is comparable in the two structures (all the copper atoms below a nitrogen atom tend to relax outward by the same amount), the smaller electrostatic repulsion within each unit cell will tend to favour energetically the complex structure.
T2 ratio, can be associated with its sparser packing. On the one hand, the strain induced by the surface reconstruction, due to the molecular adsorption, will be accommodated more efficiently, if large areas of free surface are present within the monolayer structure. Indeed, this is the case for the complex structure, which presents relatively large portions of the unit cell in which the Cu(111) substrate remains exposed even after adsorption. This characteristic is reflected also in the larger surface area available per molecule (81.26 Å2 per molecule) compared to the denser orthogonal one (67.72 Å2 per molecule). On the other hand, the complex structure also presents a larger variety of bonding patterns involving the electronegative cyano groups than the orthogonal one. In both structures, the unfavourable contribution deriving from the close vicinity of the negatively charged cyano groups belonging to neighbouring TCNQ molecules is counterbalanced by the upward shift of the underlying copper atoms. However, in the orthogonal geometry, every nitrogen atom bonded to the surface is close to other three nitrogen atoms. Whereas the complex structure also presents bonding situations in which each nitrogen has only two other neighbours. This will decrease the average number of neighbours per nitrogen atoms in the complex structure (2.4 neighbours per atom), with respect to the orthogonal structure (3 neighbours per atom). While the favourable contribution per Cu–N bonding pair is comparable in the two structures (all the copper atoms below a nitrogen atom tend to relax outward by the same amount), the smaller electrostatic repulsion within each unit cell will tend to favour energetically the complex structure.
6 Conclusions
In this paper we have shown that the self-assembly pattern obtained by depositing TCNQ molecules on Cu(111) under UHV conditions can be controlled by varying the growth conditions under which the molecular deposition is carried out. A complex structure, with five molecules per unit cell, is formed if the molecular deposition proceeds by keeping the substrate at room temperature and then annealing up to 350 K, whereas an orthogonal structure, with two molecules per unit cell, is obtained by depositing the molecule while keeping the substrate temperature fixed at 350 K. A theoretical analysis based on accurate density functional theory (DFT) simulation shows that the two superstructures are possible due to the presence of two almost degenerate adsorption configurations for the isolated TCNQ on Cu(111). The experimental results suggest a kinetic origin of the interconversion process. Theoretical simulations, which provide additional information on its thermodynamics, show that when these two configurations are considered as building blocks for the observed superstructures, the model representative of the complex structure is energetically more stable than that representative of the orthogonal one.Acknowledgements
We acknowledge allocation of computer time at the Red Española de Supercomputación (RES) and the Centro de Computación Científica at the Universidad Autónoma de Madrid (CCC-UAM). Work supported by the MICINN projects FIS2013-42002-R and CTQ2013-43698-P, the CAM project NANOFRONTMAG-CM ref. S2013/MIT-2850, and the European COST Action CM1204 XLIC. DS acknowledge support from the FPI-UAM program and from the HC Ørsted post-doctoral program at DTU. C. Díaz acknowledge the Ramón y Cajal program of the MICINN.References
- J. V. Barth, G. Constantini and K. Kern, Nature, 2005, 437, 671 Search PubMed.
- J. V. Barth, Annu. Rev. Phys. Chem., 2007, 58, 375 CrossRef CAS PubMed.
- L. Bartels, Nat. Chem., 2010, 2, 87 CrossRef CAS PubMed.
- S. Barlow and R. Raval, Surf. Sci. Rep., 2003, 50, 201 CrossRef CAS.
- F. Rosei, M. Schunack, Y. Naitoh, P. Jiang, A. Gourdon, E. Laegsgaard, I. Stensgaard, C. Joachim and F. Besenbacher, Surf. Sci. Rep., 2003, 71, 95 CAS.
- S. Barlow, S. Louafi, D. L. Roux, J. Williams, C. Muryn, S. Haq and R. Raval, Surf. Sci., 2005, 590, 243 CrossRef CAS.
- D. C. Madden, I. Temprano, M. Sacchi, M. Blanco-Rey, S. J. Jenkins and S. M. Driver, J. Phys. Chem. C, 2014, 118, 18589 CAS.
- J. A. Teobald, N. S. Oxtoby, M. A. Phillips, N. R. Champness and P. Benton, Nature, 2003, 424, 1029 CrossRef PubMed.
- M. Stöhr, M. Wahl, C. Galka, T. Riehm, T. Jung and L. Gade, Angew. Chem., Int. Ed., 2005, 44, 7394 CrossRef PubMed.
- D. L. Keeling, N. Oxtoby, C. Wilson, M. Humphry, N. Champness and P. Benton, Nano Lett., 2003, 3, 9 CrossRef CAS.
- T. Yokoyama, S. Yokoyama, T. Kamikado, Y. Okuno and S. Mashiko, Nature, 2001, 413, 619 Search PubMed.
- J. Rabe and S. Buchholz, Science, 1991, 253, 424 CAS.
- L. Grill, M. Dyer, L. Lafferentz, M. Persson, M. Peters and S. Hecht, Nat. Nanotechnol., 2007, 2, 687 CrossRef CAS PubMed.
- U. Schlickum, R. Decker, F. Klappenberger, G. Zoppellaro, S. Klyatskaya, W. Auwärter, S. Neppl, K. Kern, H. Brune, M. Ruben and J. V. Barth, J. Am. Chem. Soc., 2008, 130, 11778 CrossRef CAS PubMed.
- M. Ruben, D. Payer, A. Landa, A. Comisso, C. Gattinoni, N. Lin, J.-P. Collin, J.-P. Sauvage, A. D. Vita and K. Kern, J. Am. Chem. Soc., 2006, 128, 15664 CrossRef PubMed.
- J. V. Barth, Surf. Sci., 2009, 603, 1533 CrossRef CAS.
- U. Schlickum, R. Decker, F. Klappenberger, G. Zoppellaro, S. Klyatskaya, M. Ruben, I. Silanes, A. Arnau, K. Kern, H. Brune and J. V. Barth, Nano Lett., 2007, 7, 3813 CrossRef CAS PubMed.
- T.-C. Tseng, N. Abdurakhmanova, S. Stepanow and K. Kern, J. Phys. Chem. C, 2011, 115, 10211 CAS.
- T.-C. Tseng, C. Lin, X. Shi, S. L. Tait, X. Liu, U. Starke, N. Lin, R. Zhang, C. Minot, M. A. V. Hove, J. I. Cerda and K. Kern, Phys. Rev. B: Condens. Matter Mater. Phys., 2009, 80, 155458 CrossRef.
- S. Stepanow, M. Lingenfelder, A. Dimitriev, H. Spillmann, E. Delvigne, N. Lin, X. Deng, C. Cai, J. Barth and K. Kern, Nat. Mater., 2004, 3, 229 CrossRef CAS PubMed.
- A. Dmitriev, H. Spillmann, N. Lin, J. V. Barth and K. Kern, Angew. Chem., Int. Ed., 2003, 42, 2670 CrossRef CAS PubMed.
- J. Björk, M. Matena, M. S. Dyer, M. Enache, J. Lobo-Checa, L. H. Gade, T. A. Jung, M. Stöhr and M. Persson, Phys. Chem. Chem. Phys., 2010, 12, 8815 RSC.
- G. Pawin, K. Wong, D. Kim, D. Sun, L. Bartels, S. Hong, T. Rahman, R. Carp and M. Marsella, Angew. Chem., Int. Ed., 2008, 47, 8442 CrossRef CAS PubMed.
- S. Haq, F. Hanke, M. S. Dyer, M. Persson, P. Iavicoli, D. B. Amabilino and R. Raval, J. Am. Chem. Soc., 2011, 133, 12031 CrossRef CAS PubMed.
- G. Pawin, K. L. Wong, K.-Y. Kwon and L. Bartels, Science, 2006, 313, 961 CrossRef CAS PubMed.
- S. Lukas, G. Witte and C. Wöll, Phys. Rev. Lett., 2002, 88, 028301 CrossRef CAS PubMed.
- P. Han and P. Weiss, Surf. Sci. Rep., 2012, 67, 19 CrossRef CAS.
- J. S. Miller and A. J. Epstein, Angew. Chem., Int. Ed., 1994, 33, 385 CrossRef.
- S. J. Blundell and F. L. Pratt, J. Phys.: Condens. Matter, 2004, 16, R771 CrossRef CAS.
- H. S. Nalwa, Adv. Mater., 1993, 5, 341 CrossRef CAS.
- A. Krishnan, S. K. Pal, P. Nandakumar, A. G. Samuelson and P. K. Das, Chem. Phys., 2001, 265, 313 CrossRef CAS.
- P. Samori, N. Severin, C. D. Simpson, K. Müllen and J. P. Rabe, J. Am. Chem. Soc., 2002, 124, 9454 CrossRef CAS PubMed.
- J. R. Gong, L. J. Wan, S. B. Lei, C. L. Bai, X. H. Zhang and S. T. Lee, J. Phys. Chem. B, 2005, 109, 1675 CrossRef CAS PubMed.
- I. Fernández-Torrente, K. J. Franke and J. I. Pascual, Int. J. Mass Spectrom., 2008, 277, 269 CrossRef.
- F. Jaäckel, U. G. E. Perera, V. Iancu, K.-F. Braun, N. Koch, J. P. Rabe and S.-W. Hla, Phys. Rev. Lett., 2008, 100, 126102 CrossRef PubMed.
- S. Barja, M. Garnica, J. J. Hinarejos, A. L. Vázquez de Parga, N. Martín and R. Miranda, Chem. Commun., 2010, 46, 8198 RSC.
- L. Romaner, G. Heimel, J. L. Brédas, A. Gerlach, F. Schreiber, R. L. Johnson, J. Zegenhagen, S. Duhm, N. Koch and E. Zojer, Phys. Rev. Lett., 2007, 99, 256801 CrossRef PubMed.
- G. M. Rangger, O. T. Hofmann, L. Romaner, G. Heimel, B. Bröker, R.-P. Blum, R. L. Johnson, N. Koch and E. Zojer, Phys. Rev. B: Condens. Matter Mater. Phys., 2009, 79, 165306 CrossRef.
- T. C. Tseng, C. Urban, Y. Wang, R. Otero, S. L. Tait, M. Alcamí, D. Écija, M. Trelka, J. M. Gallego, N. Lin, M. Konuma, U. Starke, A. Nefedov, A. Langner, C. Wöll, M. A. Herranz, F. Martín, N. Martín, K. Kern and R. Miranda, Nat. Chem., 2010, 2, 374 CrossRef CAS PubMed.
- S. Bedwani, D. Wegner, M. F. Crommie and A. Rochefort, Phys. Rev. Lett., 2008, 101, 216105 CrossRef PubMed.
- T. Choi, S. Bedwani, A. Rochefort, C.-Y. Chen, A. J. Epstein and J. A. Gupta, Nano Lett., 2010, 10, 4175 CrossRef CAS PubMed.
- T. Katayama, K. Mukai, S. Yoshimoto and J. Yoshinobu, J. Phys. Chem. Lett., 2010, 1, 2917 CrossRef CAS.
- W. Erley and H. Ibach, Surf. Sci., 1986, 178, 565 CrossRef CAS.
- M. M. Kamna, T. M. Graham, J. C. Love and P. S. Weiss, Surf. Sci., 1998, 419, 12 CrossRef CAS.
- A. L. Vázquez de Parga, O. S. Hernán, R. Miranda, A. Levy Yeyati, N. Mingo, A. Martín-Rodero and F. Flores, Phys. Rev. Lett., 1998, 80, 357 CrossRef.
- P. E. Blöch, Phys. Rev. B: Condens. Matter Mater. Phys., 1994, 50, 17953 CrossRef.
- G. Kresse and D. Joubert, Phys. Rev. B: Condens. Matter Mater. Phys., 1999, 59, 1758 CrossRef CAS.
- G. Kresse and J. Hafner, Phys. Rev. B: Condens. Matter Mater. Phys., 1993, 47, 558 CrossRef CAS.
- G. Mercurio, E. R. McNellis, I. Martin, S. Leyssner, S. Soubatch, J. Meller, M. Wolf, P. Tegeder, F. S. Tautz and K. Reuter, Phys. Rev. Lett., 2010, 104, 036102 CrossRef CAS PubMed.
- D. Stradi, C. D. S. Barja, M. Garnica, B. Borca, J. J. Hinarejos, C. Sánchez-Portal, M. Alcamí, A. Arnau, A. L. Vázquez de Parga, R. Miranda and F. Martín, Phys. Rev. Lett., 2011, 106, 186102 CrossRef CAS PubMed.
- A. Tkatchenko, L. Romaner, O. Hofmann, E. Zojer, C. Ambrosch-Draxl and M. Scheffler, MRS Bull., 2010, 35, 435 CrossRef CAS.
- S. Grimme, J. Comput. Chem., 2006, 27, 1787 CrossRef CAS PubMed.
- P. Perdew, K. Burke and M. Ernerzhof, Phys. Rev. Lett., 1996, 77, 3865 CrossRef PubMed.
- D. Sun, D.-H. Kim, D. Le, O. Borck, K. Berland, K. Kim, W. Lu, Y. Zhu, M. Luo, J. Wyrick, Z. Cheng, T. L. Einstein, T. S. Rahman, P. Hyldgaard and L. Bartels, Phys. Rev. B: Condens. Matter Mater. Phys., 2010, 82, 201410 CrossRef.
- K. Toyoda, I. Hamada, K. Lee, S. Yanagisawa and Y. Morikawa, J. Chem. Phys., 2010, 132, 134703 CrossRef PubMed.
- V. G. Ruiz, W. Liu, E. Zojer, M. Scheffler and A. Tkatchenko, Phys. Rev. Lett., 2012, 108, 146103 CrossRef PubMed.
- M. Dion, H. Rydberg, E. Schröder, D. C. Langreth and B. I. Lundqvist, Phys. Rev. Lett., 2004, 92, 246401 CrossRef CAS PubMed.
- J. Klimeš, D. R. Bowler and A. Michaelides, Phys. Rev. B: Condens. Matter Mater. Phys., 2011, 83, 195131 CrossRef.
- Y. N. Zhang, F. Hanke, V. Bortolani, M. Persson and R. Q. Wu, Phys. Rev. Lett., 2011, 106, 236103 CrossRef CAS PubMed.
- W. A. Hofer and A. Garcia-Lekue, Phys. Rev. B: Condens. Matter Mater. Phys., 2005, 71, 085401 CrossRef.
- G. Henkelman, B. Uberuaga and H. Jónsson, J. Chem. Phys., 2000, 113, 9901 CrossRef CAS.
- J. Tersoff and D. R. Hamman, Phys. Rev. Lett., 1983, 50, 1998 CrossRef CAS.
- W. Tang, E. Sanville and G. J. Henkelman, J. Phys.: Condens. Matter, 2009, 21, 084204 CrossRef CAS PubMed.
- G. M. Rangger, O. T. Hofmann, L. Romaner, G. Heimel, B. Bröker, R.-P. Blum, R. L. Johnson, N. Koch and E. Zojer, Phys. Rev. B: Condens. Matter Mater. Phys., 2009, 79, 165306 CrossRef.
| This journal is © The Royal Society of Chemistry 2016 |

