The transitions of time-independent spreading diameter and splashing angle when a droplet train impinging onto a hot surface

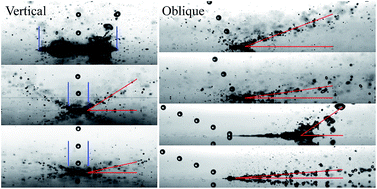
Lu Qiuab, Swapnil Dubeyb, Fook Hoong Choob and Fei Duan*a
aSchool of Mechanical and Aerospace Engineering, Nanyang Technological University, 50 Nanyang Avenue, Singapore 639798. E-mail: feiduan@ntu.edu.sg
bEnergy Research Institute @ NTU, Nanyang Technological University, 1 Cleantech Loop, 06-04 Cleantech One, Singapore 637141

Received 9th December 2015 , Accepted 25th January 2016

First published on 27th January 2016


Abstract

The hydrodynamic patterns of the impingement of a water droplet train on a high temperature substrate are captured with a high-speed camera, and then analyzed. The tested droplets range from 8.8 m s−1 to 18.9 m s−1 in velocity, from 92 μm to 121 μm in diameter and from 28.01 kHz to 56.56 kHz in frequency. Three different orientations of the impact droplet trains are tested. It is found that the hydrodynamic pattern varies significantly with the wall temperature. The time-independent spreading diameter as well as the stable splashing angle reduces with the increase in wall temperature. The two transitions exist in all the experiments with various droplet impact velocities, frequencies or impact angles. Once the splashing is established, the size, the velocity magnitude and the moving direction of splashed secondary droplets obey a bell-shaped distribution. A lower impact velocity renders a wider range of the secondary droplet sizes. The lowest impact velocity case presents outstanding splashing characteristics in the post-transition regime, indicating that an impact velocity of around 10 m s−1 would be a threshold. Those two transitions are not notably influenced by the droplet frequency but significantly affected by the impact angle. The transition of the splashing angle is observed at a lower wall temperature when the droplet train is inclined.

1 Introduction

Surface tension plays an important role in sculpting the interface between water and air during the droplet impingement which appears frequently in many industrial applications such as printing, steel processing, spray cooling, coating, combustion, etc. Two distinguished characteristics should be highlighted: the high temperature of the target surface and the interaction among droplets. In the fundamental experimental investigations, a high temperature of the substrate is relatively easy to be actualized, however, the interaction between droplets is somehow difficult to be produced and well controlled. Thereby, a droplet train could be considered as the simplified model to show the significance of the interaction among droplet impingements.1 Ahead of the studies of droplet train impingement, single droplet impingement on a solid surface has attracted attentions in many different aspects, such as spreading, splashing, receding, bouncing, formation of crown and secondary droplets.2 Wide ranges of droplet sizes and velocities have been examined. Various impingement patterns such as deposition, prompt splash, corona splash, receding break-up, partial rebound and complete rebound could be formed due to the different surface conditions.3 The droplet impingement experiments with very high speed (around 100 m s−1) and small size (around 10 μm in diameter) of droplets were performed.4,5 The effects of stationary dry surface,6,7 moving dry surface,8 stationary wet surface7,9 and moving liquid film covered surface10 were investigated. Regarding the dry surfaces with an ambient temperature11–13 or high temperature,14 the effects of surface conditions were studied. High temperature substrate would initiate boiling during the impingements.15,16 Once the wall temperature was high enough, the Leidenfrost point would be reached.17,18 The further contact between the liquid droplet and the hot surface would be prevented by a generated vapour layer.

The interactions among droplets, on the other hand, are diverse. For example, a droplet interacts with the others in the form of collision and coalescence in the liquid spray before the impingement. However, this study pays particular attention to the case that the droplet hits the residual of the previous impinged droplet, which means the interaction among the impingements. A droplet train, thereby, is a way to mimic this interaction. Yarin and Weiss19 experimentally and theoretically investigated the droplet train impingement on the ambient temperature substrate. Self-similar capillary waves were experimentally observed and theoretically predicted. Droplet splashing was observed and the splashing threshold depended on the impact parameters. Sellers and Black20 investigated the critical heat flux and the droplet cooling effectiveness when a droplet train impinged onto a hot substrate. Trujillo, et al.21,22 numerically and experimentally investigated the impingement of a HFE-7100 droplet train onto a heated surface which was covered by a thin liquid layer. A thin-film heater was employed in the experiment to generate an iso-flux boundary condition. The wall temperature distribution was measured by an infrared camera from the substrate bottom. After an initial transition period, a statistically steady state was reached, and the stable craters and rims were generated. Due to the impingement, the heat transfer inside the crater was higher than the outside area. However, the wall temperature was not high enough to initiate boiling especially inside the crater, therefore, the heat was transferred from the wall to the liquid with single phase convection. Dunand, et al.23 studied the impingement of a droplet train onto a hot surface with the temperature above the Leidenfrost point. They employed a two-color laser-induced fluorescence thermometry technique to measure the temperature distribution of the splashed secondary droplets. The droplet train was orientated at an angle of 1.22 rad (70°) with respect to the surface. However, when a droplet hit the surface, the residual of the previous impingement was very rare. Therefore, the interaction between two impingements was not very apparent. Park, et al.24 investigated the resident time and the heat transfer of a water droplet train impingement on a hot surface over the Leidenfrost point via the pump–probe thermal transport measurements technique and a high-speed camera. The captured image proved that a vapour layer was formed when the wall temperature was around 200 °C, after which the wall-to-droplet heat transfer decreased significantly. However, the droplet interval was so large that the interaction between droplet impingements was not very apparent. Those works focused on the characteristics of the single droplet impingement but not the interaction between droplet impingements.16,24,25 The droplet train generator was nothing but a tool to generate the desired “single” droplet.

More recently, it was found that an ordered and axis-symmetrical droplet splashing could be established when the high velocity and high frequency droplet train impinged onto hot surface higher than 180 °C.1 The splashing angle reduced with an increase in the wall temperature. After the transition, a further increase in the wall temperature did not reduce the angle any more. Besides, a statistical steady-state wetted area was observed. The time-independent spreading diameter decreased with an increase in wall temperature until reached an ultimate diameter. This was very different from the single droplet impingement scenario. The observation was made in the case that the droplet diameter was 0.117 mm, droplet velocity was around 15.2 m s−1 and droplet frequency was 39.20 kHz. However, it is unknown how those two transitions are affected by the parameters such as impact velocity, droplet frequency, impact angle, etc. Besides, the characteristics of the splashed secondary droplets are important, but have not been investigated yet. Therefore, this work reports the new findings regarding the droplet train impingement onto a high-temperature surface. Since the phase change convective heat transfer greatly depends on the fluid flow, the investigation of the hydrodynamic pattern would give a better understanding of the heat transfer from the fundamental point of view.

2 Experiments

The photo and schematic of the experiment system are showed in Fig. 1(a) and (b), which consists of three major parts: droplet train generation sub-system, high-speed shadow image recording sub-system, and surface heating sub-system. The experiments were conducted in a lab where the ambient temperature (as same as the droplet temperature) was 26 ± 1 °C, the ambient pressure was 1 atm, and the relative humidity was 48 ± 5%.
image file: c5ra26314j-f1.tif
Fig. 1 The photo (a) and schematics (b) of the experimental system. (c) The positions of nozzle, high-speed camera and lamp. (d) Measured 3D surface roughness. The system consists of (1) compressed air supply, (2) pressure vessel filled with DI water, (3) flow meter and pressure gauge, (4) nozzle, (5) function generator, (6) lamp, (7) high-speed camera, (8) copper rod, (9) temperature measurements and data acquisition unit, (10) AC power supply, (11) cartridge heaters, (12) signal synchronizer and (13) computer.

In order to generate the desired droplet train, a droplet generator produced by FMP Technology GMBH, Germany was employed. The deionized (DI) water was pressurized by compressed air out of a pressure vessel into the nozzle. A water filter was installed at the outlet of the pressure vessel. An OMEGA FLR-1616A flow meter was installed before the nozzle in order to measure the water pressure and the mass flow rate. A pin-hole plate was assembled by the end of the nozzle, from where a water jet was ejected. In the current study, the pin-hole diameter was 50 μm. The water jet broke into droplets at the downstream due to the interface instability. The jet breakup could be manipulated once it was disturbed by a regular excitation. Therefore, a piezo-ceramic vibrating element was assembled inside the nozzle. The vibration signal came from a function generator (TCE7404). Once the nozzle diameter was given, the generated droplet size and velocity were determined by the upstream water pressure and the droplet frequency.

As shown in Fig. 1(c), the nozzle could be rotated in XZ plane so that the impact angle, α, was able to be adjusted. Shadow images were captured with the Phantom v711 high-speed camera in Y-direction. Once the splashing was established, a splashing angle, β, could be observed from the camera. The high-speed camera has a wide-screen 1280 × 800 CMOS sensor producing higher than 7 gigapixels per second throughput. A maximum speed of 7530 frames per second (fps) at full resolution, and up to 1[thin space (1/6-em)]400[thin space (1/6-em)]000 fps at a reduced resolution of 128 × 8 are able to be achieved. The minimum exposure time is 300 ns. In this study, one 65 mm f 2.8–16 lens was used and the aperture was set to be 2.8. The exposure time was 1 microsecond. An additional light-emitting diode lamp (LEICA CLS150 LED) was placed at the rear of the droplet train (in Y-direction) to supply sufficient light. After the recording, the calibration of the camera was conducted. It showed that the scale factor was around 3.9604 μm per pixel. The captured image had an area of 4.06 mm × 2.03 mm at a resolution of 1024 × 512. The measurements of the impact droplet diameter, impact droplet velocity, secondary droplet diameter, secondary droplet velocity and splashing angle were accomplished with the tool integrated in Phantom Camera Control software (PCC V2.14). The software could measure the distance and angle from two points in the same frame, and could measure the velocity of a point by tracing it in two frames with given time interval. Alternatively, the droplet velocity could be calculated from the droplet frequency and the measured droplet interval. The uncertainty of the distance measurements was 0.5 pixel which equalled to 1.98 μm. Therefore, a larger object presented a smaller percentage uncertainty of the distance measurements. Besides, all the measurements were repeated at least three times. The deviation of the measurements was also included in the uncertainty evaluation. In the measurements of steady-state spreading diameter and the splashing angle, there were some small fluctuation from frame to frame due to the unstable nature of the boiling. In this case, the deviation of the repeated measurements made the major contribution to the reported uncertainty.

The substrate was made by copper due to its high conductivity. Four cartridge heaters (220 V/50 W each) were inserted into the copper rod from the bottom. Two calibrated K-type thermocouples were inserted into the blind holes that beneath the top surface with a distance of 1 mm and 6 mm, respectively. The wall temperature was adjusted by varying the output voltage of the AC power supplier. Without the droplet impingement, it was tested that the temperature difference between two thermocouples was around 0.25 °C when the wall temperature was in the range from 150 °C to 350 °C. However, with the droplet impingement, the maximum temperature difference was around 3.1 °C in the same wall temperature range. In the following analysis, the wall temperature, Tw, is the temperature that measured with the thermocouple that closer to the impingement surface. As shown in Fig. 1(d), the three-dimensional area roughness was measured with a surface profile scanner (Talyscan 150). The target surface was furnished by a sand paper (#1200) and the surface roughness parameter, SA, was 0.257 μm in a typical case.

In order to measure the velocity and splashing angle of the splashed secondary droplets, two frames were needed. The velocity measurements was conducted by measuring the displacement of a specific secondary droplet in those two images. Therefore, the camera was operating at a frame rate of 14[thin space (1/6-em)]000 fps, resolution of 1024 × 512, because it was tested that the secondary droplets could be tracked in two consecutive frames at this sampling rate. With the resolution and frame rate, the memory of camera would be full with a recording less than 2 seconds. On the other hand, to measure the diameter and velocity of the droplet train, the steady-state spreading diameter and the splashing angle, a single frame would be enough. The droplet velocity was calculated by the distance of two neighbour droplets and the known frequency. To speed up the experiments, the copper substrate was heated up continuously at a speed of around 3 °C per second. The wall temperature was recorded with Keysight 34792A LXI data acquisition unit, and synchronized with the captured images. At the same time, the camera was working at a reduced frame rate of 100 fps but same resolution so that a relatively long period of continuous recording could be achieved. The quasi-stable measurements was reasonable because the steady state was reached almost instantaneously compared to the wall temperature increasing rate. It was found that the stable hydrodynamic pattern could be reached within 0.02 s when the wall temperature was higher than 150 °C.1 With the same time period, the wall temperature variation was estimated as only 0.06 °C.

As shown in Fig. 2, the baseline test was conducted at a velocity of 13.5 m s−1 with the upstream gauge pressure at 138.6 kPa and a frequency of 40 kHz. Increasing the upstream water pressure resulted in an larger droplet size and higher velocity. The droplet frequency did not influence the droplet velocity, but increasing the droplet frequency reduced the droplet diameter significantly due to the conservation of the water mass. The droplet diameter, d, is a function of nozzle diameter, Dn, droplet velocity, Ud, and frequency, f, with the relation of image file: c5ra26314j-t1.tif ideally. Fig. 2 presents the droplet diameters and the velocities that used in current work. The droplet velocity and diameter ranged from 8.8 m s−1 to 18.9 m s−1 and 92 μm to 121 μm, respectively. The reported value of each parameter is the average of 10 repeated measurements. The Weber number, We, and Reynolds number, Re, varied from 101.8 to 602.8 and 939.3 to 2548.0, respectively.


image file: c5ra26314j-f2.tif
Fig. 2 The variation of droplet diameter with droplet velocity and frequency.

3 Results and discussion

3.1 Examination of the splashed secondary droplets

As shown in Fig. 3(a–c), three regimes with distinct hydrodynamic patterns can be observed when the droplet train impinges onto the hot surface, namely, the boiling regime (Tw < 180 °C), the transition regime (180 °C < Tw < 210 °C), and the post-transition regime (Tw > 210 °C), which depends on the surface temperature.1 The crown forming are shown in Fig. 3(d and e). The establishment and the transition of the orderly splashing are the interesting phenomena that deserve further examinations. Therefore, the splashed secondary droplets are measured in this work.
image file: c5ra26314j-f3.tif
Fig. 3 Three regimes with distinct hydrodynamic patterns are observed at different wall temperatures, (a) boiling regime, (b) transition regime, and (c) post-transition regime. (d) It is well known that the crown can be formed when droplet impinges onto wet surface. (e) Similarly, the formation and growth of crown are also observed in the transition regime (f = 40.00 kHz, Ud = 14.8 m s−1).

Two typical cases in the regimes of transition and post-transition are selected for conducting the measurements. The camera fps is set to be 14[thin space (1/6-em)]000 in the experiments, with which the splashed tiny droplets can be tracked in two consecutive frames. Finally, the diameter, the velocity magnitude and the splashing angle of more than 100 randomly selected secondary droplets in the different frames are measured and presented in Fig. 4. The results show that the diameter, the velocity and the splashing angle of the splashed droplets are not uniform in both cases. Generally, all of the three parameters are subject to a bell-shaped distribution. The distributions of the diameter and the velocity have not changed apparently after the transition. The measured diameter ranges roughly from 15 μm to 70 μm, the velocity ranges from 2.2 m s−1 to 9 m s−1 in the both cases. The mean diameter and the velocity are around 38 μm and 5.5 m s−1. The secondary droplet diameter is the smallest object measured in current study, therefore, it has the largest uncertainty which varies from 2.8% to 13.2%. But the uncertainty of the velocity varies from 0.3% to 1.3% since the displacement of each droplet in two consecutive frames is relatively long. Different from the distributions of diameter and the velocity, the distribution of the splashing angle changes significantly after the transition. It ranges from 0.15 rad to 0.85 rad and from 0.01 rad to 0.4 rad when the wall temperature is 191 °C and 250 °C, respectively. The mean splashing angle decreases significantly from 0.45 rad to 0.18 rad as the wall temperature increases from 191 °C to 250 °C. The result suggests that the transition does not influence the kinetic energy of the group of splashed secondary droplets, but impacts the direction of the kinetic momentum. The horizontal component of the velocity of the splashed secondary droplet increases whereas the vertical component decreases after the transition. One thing to be mentioned is that, after the transition, many of the splashed droplets are in irregular shapes. The reported secondary droplet diameter is the mean diameter of the shadow of each splashed droplet in the captured images.


image file: c5ra26314j-f4.tif
Fig. 4 The distributions of the diameter, velocity and splashing angle of 100 randomly selected splashed secondary droplets at two typical wall temperatures that in the regime of transition and post-transition (f = 40.00 kHz, Ud = 14.8 m s−1).

One possible explanation can be that the transition is a sign of reaching Leidenfrost temperature. As shown in Fig. 3(e), in the transition zone which is before the Leidenfrost point, the crown is formed inside the wetted area, then spreads to the edge and finally breaks into tiny droplets. Compared to the crown formed on wet surface at ambient temperature (Fig. 3(d)), those crowns at high wall temperatures are not so perfect due to the boiling. The hydraulic jump supplies the initial vertical component of the splashing velocity. In the post-transition zone which is after the Leidenfrost point, a thin vapour cushion should be formed between the droplet and the hot surface, so the wall is lubricated. Therefore, the droplet spreading is enhanced and the crown formation is difficult to be observed. The horizontal component of the velocity increases, resulting in a decrease in the splashing angle (Fig. 4). It could be inferred that the heat transfer in the boiling regime should be significant since the heat transfer area is relatively large. Increasing the wall temperature decreases the contact area, and in turn weakens the heat transfer. When it steps into the post-transition regime, the vapour cushion increases the thermal resistance between the wall and the liquid so that the heat transfer should be further abated.

3.2 Outstanding splashing pattern at low impact velocity

The droplet velocity gives rise to the value of We and Re. With a given nozzle diameter, the droplet velocity has a specific relation with those two parameters. Therefore, the impact velocity is employed to index each case in this section. Fig. 5 presents the steady-state spreading diameter and splashing angle variations at six different velocities. The tested velocity ranges from 8.8 m s−1 to 18.9 m s−1. Both steady-state spreading diameter and splashing angle are measured three times in consecutive frames. Since the deviation of the spreading diameter is relatively small and uniform (less than 5%), it is reported in the text but not showed in the figure to keep it neat. However, the deviation of the splashing angle varies significantly from case to case so that they are marked in the figure. Fig. 5 shows that the droplet velocity plays no significant role in influencing the steady-state spreading diameter at all six conditions. Besides, the droplet velocity does not influence the splashing angle in the transition regime. However, after the transition, the diverse results regarding splashing angle are observed. When the droplet velocity is sufficiently low (8.83 m s−1), the splashing angle increases again after the transition. The standard deviation of the splashing angle in the post-transition regime is relatively high, indicating that the fluctuation of the splashing angle is apparent. However, at higher droplet velocities, the wall temperature and the droplet velocity do not influence the splashing angle in the post-transition regime significantly. The lowest velocity case is a very outstanding scenario among six tested cases, indicating that an impact velocity of around 10 m s−1 would be a threshold.
image file: c5ra26314j-f5.tif
Fig. 5 Effect of droplet velocity on the transitions of steady-state spreading diameter (left) and the splashing angle (right). The lowest velocity case presents outstanding characteristics of the transition of the splashing angle among the tested cases (f = 40.00 kHz).

The images, captured by the high-speed camera and showed in Fig. 6 (a–c), reveal that the hydrodynamic patterns at the lowest droplet velocity in the post-transition zone are quite different from the previous reported ones. At a high impact velocity (Fig. 3(b)), the droplet breaks into numerous tiny fractions. However, under the lowest impact velocity, the diameters of the splashed droplets are relatively large, and have same magnitude with the original droplets (see Fig. 6(c)). It can be observed that the impact droplet merges into the previously formed water layer on the surface but is not able to be splashed into tiny droplets. Therefore, big secondary droplets are generated.


image file: c5ra26314j-f6.tif
Fig. 6 In the case of the lowest impact velocity (f = 40.00 kHz, Ud = 8.8 m s−1), the splashing in post-transition zone is notably different from other high-velocity cases. The diameters of the secondary droplets are significantly larger, and an apparent vapour gap between the wall and the liquid can be observed.

Similarly, the diameters of more than 100 randomly selected secondary droplets in the post-transition regime are measured and the distributions are shown in Fig. 7. Generally, decreasing the impact velocity increases the mean diameter of the splashed droplets and broadens the band of the distribution. The mean diameter is around 28 μm at the highest velocity, and it increases to 65 μm at the lowest velocity. The deviation of the droplet diameter distribution increases significantly when the droplet velocity decreases to 8.8 m s−1. The maximum diameter of the splashed droplet reaches to 160 μm which is much larger than the impact droplet diameter (92 μm). Fig. 7 illustrates that more than 10% of the measured secondary droplets are larger than the initial impact droplets in the experiments of the lowest impact velocity.


image file: c5ra26314j-f7.tif
Fig. 7 The distribution of the diameter of more than 100 randomly selected splashed droplets at six different impact velocities in the post-transition regime (f = 40.00 kHz, Tw = 250 °C).

The above observations strengthen the assumption that the Leidenfrost point is reached when the splashing steps into the post-transition zone. The direct contact between water and the surface is segregated by the vapour cushion. Therefore, the resident time of droplet would increase. Given that the surface energy increases when the droplet is splashed into tiny secondary droplets, the kinetic energy of the impact droplet is the source that powers the breakup. However, with a small kinetic energy of impact droplet, it is not able to be broken into tiny droplets. It should be noticed that, although the droplet velocity plays an important role in the post-transition regime, the splashing characteristics in the transition zone are not influenced by the droplet velocity. It suggests that the mechanism in the transition regime is different from the post-transition one. In the transition regime, the droplet touches the hot surface and absorbs heat from the wall, the surface tension of the splashed droplets decreases with an increase in droplet temperature. Therefore, the droplet is easier to be splashed into tiny droplets compared to the post-transition regime. A lower impact velocity could not supply sufficient kinetic energy to take the liquid layer closing to the wall, thereby, a thicker vapour layer could be observed in Fig. 6(c), indicating that a higher thermal resistance would be produced compared to the high velocity cases.

3.3 Effect of droplet frequency

The droplet frequency is another factor may influence the impact patterns. Once the time interval of the droplet train is shorter than the droplet resident time, the incoming droplet impinges onto the residual of the previous impingement rather than the dry surface. Therefore, the droplet train impingement should present different characteristics from the single droplet impingement. In the current work, three frequencies at 28.01 kHz, 40.00 kHz and 56.56 kHz, are tested. With the same nozzle exit jet velocity, the droplet diameter decreases from 121 μm to 92 μm while the droplet frequency increases. Counterproductively, Fig. 8 shows that the droplet frequency plays no significant role in influencing the two transitions. The ultimate steady-state spreading diameter, when the wall temperature is higher than 210 °C, is slightly influenced by the droplet frequency. Because the ultimate wetted area is related to the aforementioned crown formation. A higher frequency produces smaller droplets, and in turn results in a smaller ultimate steady-state spreading diameter.
image file: c5ra26314j-f8.tif
Fig. 8 Effect of droplet frequency on the transitions of steady-state spreading diameter (left) and the splashing angle (right) in the case of Ud = 13.5 m s−1.

Fig. 9 presents the images captured by the high-speed camera at the three different droplet frequencies and two typical wall temperatures. It shows that the variation of the droplet diameter and interval among different frequencies are very significant, whereas the droplet velocities in three cases are exactly same as 13.5 m s−1. Increasing droplet velocity decreases the droplet size and droplet interval. However, it demonstrates that the hydrodynamic splashing pattern at a given wall temperature is not influenced by the droplet frequency and droplet size in the both transition and post-transition zones. In current study, the time interval between two droplets is in the magnitude of 10−5 s. This time period is much shorter than the resident time of each droplet. Therefore, the interaction between the droplets is inevitable. However, if the time interval of droplets is in the same magnitude of the droplet resident time, the droplet frequency may influence the results notably. It should be interesting to investigate the threshold of the interaction of impingements at lower frequencies. Unfortunately, the equipment employed in the current study is not able to generate the droplet at lower frequency. With the nozzle diameter of 50 μm and the velocity of 13.5 m s−1, the minimum stable droplet frequency is around 28 kHz.


image file: c5ra26314j-f9.tif
Fig. 9 The hydrodynamic patterns of the splashing in transition zone (left column) and post-transition zone (right column) at three different droplet frequencies (Ud = 13.5 m s−1).

3.4 Effect of impact angle

The orientation of the impact droplet train is important, because the direction of the droplet train gives rise to the initial momentum of the impingement. Varying the impact angle, α, may influence the splashing characteristics reported above. Therefore, the effect of impact angle on both interested parameters are investigated. Aside from the baseline test (α = 1.56 rad), the other two configurations (α = 1.04 rad and 0.38 rad) have been tested. Fig. 10 shows that the impact angle does not influence the steady state spreading diameter much. This result is reasonable since the steady-state is reached when the water supply equals to the water consumption that induced by the evaporation and the splashing. When the wetted area is significantly larger than the droplet diameter, the equilibrium is not influenced by the direction of the water supply. When an inclined jet impinges onto the hot substrate, the shape of the wetted area is no longer in circular because of the inertia of the droplet train. This brings a bias to the measurement of spreading diameter especially when the spreading area is relatively small. For example, the steady-state spreading diameters in the inclined impingement cases are slightly higher than the baseline case when the wall temperature is around 180 °C.
image file: c5ra26314j-f10.tif
Fig. 10 Effect of impact angle on the transitions of time-independent spreading diameter (left) and the splashing angle (right) in the case of f = 40.00 kHz and Ud = 14.54 m s−1.

Besides, the transition of the splashing angle is significantly influenced by the impact angle. In the case of α at 1.04 rad, the stable splashing angle is lower than the baseline test. Reducing the impact angle to 0.38 rad shifts the transition to lower temperatures. For example, the transition starts from 180 °C and ends at 210 °C in the baseline test (α = 1.56 rad), but it starts from 130 °C and ends at 190 °C in the case of α at 0.38 rad. Moreover, the stable post-transition splashing angle is only around 0.05 rad in the case of the lowest impact angle. The oblique droplet train supplies the initial horizontal momentum to the splashed secondary droplets, which in turn renders a higher horizontal velocity and a lower splashing angle at the same wall temperature. Nevertheless, since it is supposed that the transition of the splashing angle should be a sign of the reaching Leidenfrost point, decreasing the impact angle significantly reduces the Leidenfrost temperature, and in turn weakens the wall heat transfer.

Fig. 11 shows the hydrodynamic patterns of the impingements at different impact angles and wall temperatures. When the wall temperature is 160 °C, the directional splashing has been established in the case of α at 0.38 rad, but significant boiling and random-direction splashing are observed in the case of α at 1.04 rad. When the wall temperature is 190 °C, the stable splashing is just established in the case of α at 1.04 rad. However, with the same wall temperature, the transition of the splashing angle has finished already in the case of α at 0.38 rad. Therefore, the further increase in wall temperature does not influence the splashing pattern in the case of α at 0.38 rad, but decreases the splashing angle in the case of α at 1.04 rad.


image file: c5ra26314j-f11.tif
Fig. 11 The hydrodynamic patterns of the splashing with two different impact angles: α = 1.04 rad (left column) and α = 0.38 rad (right column). Decreasing the impact angle results in an earlier establishing of the orderly splashing and transition (f = 40.00 kHz, Ud = 14.54 m s−1).

From the captured images, it should be noted that the diameters of the splashed droplets are quite large when the splashing is just established (around Tw = 160 °C) in the case of α at 0.38 rad, but it reduces significantly in high temperature scenarios. The measurements of the secondary droplet diameter that before and after the transition at three different droplet train orientations are presented in Fig. 12. Before the transition of the splashing angle, decreasing the impact angle from 1.56 to 1.04 does not change the distribution of the secondary droplet much. However, the average diameter and the range of the distribution increase significantly. In the post-transition regime, decreasing the impact angle increases the mean diameter as well as the range of the distribution monotonously, indicating that the breakup of the droplet is undermined by the inclination of the droplet train. Unlike the baseline test, crown formation and crown breakup are not observed. The hydrodynamic pattern is no longer axis-symmetry, therefore, the phenomenon is more sophisticated than the vertical impingement cases.


image file: c5ra26314j-f12.tif
Fig. 12 The distribution of the diameter of more than 100 randomly selected splashed droplets before and after the transition of the splashing angle (f = 40.00 kHz, Ud = 14.54 m s−1).

4 Conclusion

When a water droplet train impinged onto a high temperature substrate, two kinds of transition phenomena were observed on the time-independent spreading diameter and the stable splashing angle. The effects of impact droplet velocity, droplet frequency and impact angle on the two transitions were experimentally investigated. The diameter, velocity and splashing angle of the splashed secondary droplets were not uniform. Those three parameters were subject to a bell-shaped distribution. In the baseline test, the mean diameter and mean velocity of the splashed secondary droplets were not significantly changed, whereas the mean splashing angle significantly decreased after the transition. The lowest impact velocity case presented the outstanding splashing characteristics in the post-transition regime, indicating that an impact velocity of around 10 m s−1 would be a threshold. In the post-transition regime, lower impact velocity resulted in a higher mean diameter of the splashed secondary droplets and a wider range of the distribution of secondary droplet. The droplet frequency did not influence the both transitions throughout the tests in current study. However, the orientation of the impact droplet train significantly influenced the transition of the splashing angle. With the same substrate temperature, a lower impact angle resulted in a smaller splashing angle. The transition of the orderly splashing was observed at a lower temperatures when the impingement was inclined. Moreover, the inclination of the droplet train decreased the minimum splashing angle in the post-transition regime and increased the averaged diameter as well as the range of the distribution of the secondary droplets.

Acknowledgements

The authors would like to thank National Research Foundation, Energy Innovation Programme Office, and Energy Market Authority (EMA) of Singapore for their full support to work carried out in this paper under a research grant no. NRF2013EWT-EIRP001-017.

References

  1. L. Qiu, S. Dubey, F. H. Choo and F. Duan, Appl. Phys. Lett., 2015, 107, 164102 CrossRef.
  2. A. L. Yarin, Annu. Rev. Fluid Mech., 2006, 38, 159–192 CrossRef.
  3. R. Rioboo, C. Tropea and M. Marengo, Atomization Sprays, 2001, 11, 155–165 CAS.
  4. C. W. Visser, Y. Tagawa, C. Sun and D. Lohse, Soft Matter, 2012, 8, 10732–10737 RSC.
  5. C. W. Visser, P. E. Frommhold, S. Wildeman, R. Mettin, D. Lohse and C. Sun, Soft Matter, 2015, 11, 1708–1722 RSC.
  6. C. Mundo, M. Sommerfeld and C. Tropea, Int. J. Multiphase Flow, 1995, 21, 151–173 CrossRef CAS.
  7. R. L. Vander Wal, G. M. Berger and S. D. Mozes, Exp. Fluids, 2006, 40, 53–59 CrossRef.
  8. J. C. Bird, S. S. H. Tsai and H. A. Stone, New J. Phys., 2009, 11, 063017 CrossRef.
  9. R. Rioboo, C. Bauthier, J. Conti, M. Vout'e and J. De Coninck, Exp. Fluids, 2003, 35, 648–652 CrossRef.
  10. X. Gao and R. Li, Phys. Rev. E: Stat., Nonlinear, Soft Matter Phys., 2015, 92, 053005 CrossRef PubMed.
  11. Z. Wang, C. Lopez, A. Hirsa and N. Koratkar, Appl. Phys. Lett., 2007, 91, 023105 CrossRef.
  12. T. Deng, K. K. Varanasi, M. Hsu, N. Bhate, C. Keimel, J. Stein and M. Blohm, Appl. Phys. Lett., 2009, 94, 133109 CrossRef.
  13. J. B. Lee and S. H. Lee, Langmuir, 2011, 27, 6565–7463 CrossRef CAS PubMed.
  14. A. Alizadeh, V. Bahadur, S. Zhong, W. Shang, R. Li, J. Ruud, M. Yamada, L. Ge, A. Dhinojwala and M. Sohal, Appl. Phys. Lett., 2012, 100, 111601 CrossRef.
  15. S. L. Manzello and J. C. Yang, Int. J. Heat Mass Transfer, 2004, 47, 1701–1709 CrossRef CAS.
  16. J. Shen, C. Graber, J. Liburdy, D. Pence and V. Narayanan, Exp. Therm. Fluid Sci., 2010, 34, 496–503 CrossRef CAS.
  17. J. Y. Park, A. Gardner, W. P. King and D. G. Cahill, J. Heat Transfer, 2014, 136, 092902 CrossRef.
  18. M. Khavari, C. Sun, D. Lohse and T. Tran, Soft Matter, 2015, 11, 3298–3303 RSC.
  19. A. Yarin and D. Weiss, J. Fluid Mech., 1995, 283, 141–173 CrossRef CAS.
  20. S. M. Sellers and W. Black, J. Heat Transfer, 2008, 130, 054504 CrossRef.
  21. M. F. Trujillo, J. Alvarado, E. Gehring and G. S. Soriano, J. Heat Transfer, 2011, 133, 122201 CrossRef.
  22. M. F. Trujillo and S. R. Lewis, Phys. Fluids, 2012, 24, 112102 CrossRef.
  23. P. Dunand, G. Castanet, M. Gradeck, F. Lemoine and D. Maillet, C. R. Mec., 2013, 341, 75–87 CrossRef.
  24. J. Y. Park, C.-K. Min, S. Granick and D. G. Cahill, J. Heat Transfer, 2012, 134, 101503 CrossRef.
  25. M. Gradeck, N. Seiler, P. Ruyer and D. Maillet, Exp. Therm. Fluid Sci., 2013, 47, 14–25 CrossRef.

This journal is © The Royal Society of Chemistry 2016
Click here to see how this site uses Cookies. View our privacy policy here.