DOI:
10.1039/C5RA26137F
(Paper)
RSC Adv., 2016,
6, 41785-41792
Heat stability improvement of whey protein isolate via glycation with maltodextrin without control of the relative humidity
Received
10th December 2015
, Accepted 30th March 2016
First published on 5th April 2016
Abstract
The reduction of protein aggregation and their improved heat stability in solutions are often achieved through glycation. While a controlled relative humidity (RH) is standard practice in the glycation process, its requirement and associated cost, as a condition of the treatment, has not been demonstrated. The improved heat stability of whey protein isolate (WPI) at pH 3–7 and 0–150 mM NaCl after glycation with maltodextrin (MD) using the Maillard reaction in the dry state without the need to control the RH is reported in this study. Dispersions of glycated WPI remained transparent after heating at 88 °C for 2 min at pH values that are close to whey protein pI values, including pH 5.0. Transparent dispersions were enabled as indicated by circular dichroism of the WPI–MD conjugates heated in aqueous solutions that underwent secondary structure changes and by AFM images that indicated globular aggregates smaller than 40 nm.
1. Introduction
Whey protein isolates (WPI), a by-product of cheese manufacturing, is a rich source of high quality protein. WPI contain over 90% protein. WPI and WP products have received considerable research interest mainly due to their quality, functionality and relative abundance.1 However, the acidity of the main WPI proteins, β-lactoglobulin, α-lactalbumin and bovine serum albumin present in WPI (pI = 5.2, 4.8–5.1 and 4.8–5.1, respectively)2,3 causes these molecules to aggregate during the processing of low pH products as a consequence of the low electrostatic repulsion due to the comparable charges on the protein molecules and the aqueous medium.4 This effect is enhanced with the increased ionic strength of the solution.5 Compounding this is the fact that thermal pasteurization denatures proteins with a consequent increase in hydrophobic interactions and increased disulfide bond formation.6 Low pH beverages in particular are more susceptible to undesirable turbidity and protein precipitation as a result of the combined effects of these interactions.
Induction of the Maillard reaction through glycation of dry protein products at various relative humidity values (RH) has been reported to improve their stability in processed products.7–9 However, the effectiveness of the treatment is dependent on the properties of the saccharides used, including their emulsifying and stabilizing capabilities10,11 and molecular weights.12–14 Protein solutions (7% w/v; pH 5) were reported to be transparent and flexible after heating at 88 °C for 2 min.8,9 While the protein glycation for use in protein stabilization appears to have been conducted under a controlled RH,8,9 there seems to have been no study performed without a controlled RH during the process. The ability to efficiently glycate proteins for this purpose without the need to control the RH would significantly reduce processing costs. In addition, most reports do not address the heat-induced structural changes in glycated WPI, particularly as these relate to controls in which the RH was not controlled during the glycation process. The hydrodynamic radius of β-lactoglobulin, α-lactalbumin and bovine serum albumin, the main whey proteins, is 2.6–4.9,15 2.0
16 and 3.7 nm,17 respectively. Consequently, their colloidal properties are expected to have an impact on the structural changes and stability of their glycated products in heated solutions.
The choice of maltodextrin in the present study was made due to its commercial availability, aqueous solubility and low viscosity,18 and it has been extensively used in the glycation of whey protein under a controlled relative humidity.9 Nonuniform MW distribution of maltodextrin (MD), a dextrose equivalent of 18 corresponding to a molecular weight (MW) of 1000 Da, is produced by the acidic or enzymatic hydrolysis of starch.19
In this study, we report the Maillard reaction-mediated glycation of WPI at different pH values and ionic strengths with maltodextrin (MD) in an uncontrolled RH environment. The effects of glycation and the conditions under which they were carried out on WPI structure were determined. The nanoscale structures of glycated WPI as they relate to colloidal interactions and heat stability are also discussed.
2. Materials and methods
2.1. Materials
WPI was obtained from Hilmar Ingredients (Hilmar, CA). MD with a dextrose equivalent of 18, corresponding to an average molecular weight of ca. 1000 Da and was acquired from Grain Processing Corporation (Muscatine, IA). Polyacrylamide gel, Coomassie Blue and protein markers were purchased from Bio-Rad Laboratories Inc. (Hercules, CA). β-Mercaptoethanol (2-ME) and deuterium oxide were purchased from Sigma-Aldrich (St. Louis, MO). Phosphate buffer and deionized water were bought from Thermo Fisher Scientific Inc. (Pittsburgh, PA). All other chemicals were of analytical grade.
2.2. Preparation of glycated WPI
WPI and MD were dissolved in distilled water at a mass ratio of 2
:
1, adjusted to pH 7.0, and spray-dried using a model 290 Mini-Spray Dryer (Büchi Laboratoriums-Technik, Flawil, Switzerland). The inlet air temperature and the rate of aspiration were set at 160 °C and 30 m3 h−1, respectively. The outlet temperature was controlled to be approximately 65 °C by adjusting the pump flow rate at 2 mL min−1. The resultant powder was collected and placed in an oven for heating at 90 and 115 °C for 2 h or 135 °C for 10, 30 and 60 min without control of the relative humidity.
2.3. Analysis of the structures of the conjugates via analytical ultracentrifugation (AUC)
AUC was used to study structure and aggregation properties of the conjugates under different pH conditions by estimating the sedimentation profiles. Solutions were prepared at a protein concentration of 1.2 mg mL−1 in deionized water and adjusted to the target pH values. Sedimentation velocity (SV) runs were performed on a Beckman XL-I analytical ultracentrifuge using an An50-Ti rotor (Beckman Coulter, Palo Alto, CA). 400 μL of the sample and reference solutions were placed in an Epon charcoal-filled double sector cell with an optical pathlength of 12 mm. The absorbance at 280 nm was recorded every 4 min at 50
000 rpm and 25 °C. Data were analyzed using the continuous c(s) distribution model in SEDFIT, which uses solutions to the Lamm equation to produce size distribution profiles.20 Additional analysis of the AUC data for the WPI–MD conjugates was performed using continuous c(s, f/f0) and continuous c(s) fixed f/f0 variable
models.
2.4. Sodium dodecyl sulfate-polyacrylamide gel electrophoresis (SDS-PAGE)
SDS-PAGE was used to qualitatively assess the molecular weight distributions of the conjugates produced under different conditions. The protein solutions were diluted 5 times in SDS-PAGE sample buffer (GenScript Corp., Piscataway, NJ). After heating at 95 °C for 5 min, 10 μL of each sample was loaded onto a precast 4–20% gradient polyacrylamide gel purchased from Bio-Rad Laboratories, Inc. (Hercules, CA). Electrophoresis at 150 V was terminated after the indicator dye reached the gel bottom, followed by fixing, staining with Coomassie Blue and destaining until satisfactory band visibility.
2.5. Heat stability test
The heat stability was evaluated for dispersions prepared at 5% w/v protein, pH 3.0–7.0, and 0–150 mM NaCl. A 1 or 2 mL volume of aqueous dispersion was placed in a sealed vial for heating in a 88 °C water bath for 2 min, simulating a hot-fill process in the beverage industry.21 The vials were inverted and photographed after cooling to room temperature.
2.6. Conformational changes studied by using circular dichroism (CD) spectroscopy
Far-UV CD spectra were obtained using an AVIV model 202 CD spectrometer (AVIV Instrument, Inc.). Untreated and glycated WPI samples were diluted to a protein concentration of 0.1 mg mL−1 in phosphate buffer solution, adjusted to pH 3.0, 5.0 or 7.0, heated at 88 °C for 0.5, 1, 1.5 and 2 min, and centrifuged at 18
000g for 20 min prior to loading into a quartz cuvette with a pathlength of 2 mm. Scanning over a wavelength range from 190 to 250 nm was performed at a rate of 50 nm min−1. Data were expressed as the mean residue ellipticity (θ) in deg cm2 dmol−1 using a mean value of 115 for the amino acid residues of WPI as a reference in all calculations.22 The recorded spectra were corrected by subtracting the spectrum of a protein-free buffer.
2.7. Characterization of the conjugate structures using AFM
The dimension and morphology of the glycated WPI molecules and their aggregates were imaged using AFM, which has been successfully used to study proteins,23 polysaccharides,24,25 and DNA.26,27 The glycated WPI was dissolved in deionized water, the pH adjusted, heated at 88 °C for 2 min and diluted to a protein concentration of 10 ppm using deionized water. Aliquots (2 μL) of the diluted samples were spread on freshly cleaved mica disks and air-dried for more than 2 h. The topographical images were collected at room temperature using a NanoScope IIIA Multimode microscope (Veeco Instruments Inc., Santa Barbara, CA) operating in the tapping mode. The 200–250 μm long silicon-etched FESPA cantilever had a nominal spring constant of 1–5 N m−1 and was operated at a typical resonant frequency of 71.0 kHz (Bruker Nanoprobe, Camarillo, CA) and a scan rate of 1.0 Hz. The images were analyzed using the software (Version 5.30r3, Digital Instruments, Veeco) provided by the manufacturer.
3. Results and discussion
3.1. Structure changes of whey protein after glycation with MD
The structural changes of WPI glycated by MD were studied by the complementary techniques SDS-PAGE, AUC and FTIR. All treatments were analyzed using SDS-PAGE, whereas FTIR and AUC were studied only for the sample showing the highest extent of glycation.
SDS-PAGE. Fig. 1 shows results from SDS-PAGE analysis of untreated WPI and the WPI–MD conjugates prepared via heating under various conditions. The presence of high molecular weight products is more evident for the conjugates prepared at a higher conjugation temperatures and longer heating times. For example, the products glycated at 135 °C show prominent bands with molecular weights greater than 170 kDa (lanes 3 and 4 of Fig. 1). Heating for 10 min (lane 3) resulted in both modified monomeric proteins and high molecular weight species, whereas extending the heating time to 1 h led to most protein being present in the high molecular weight band (lane 4). For reactions using a shorter heating time (lane 3) or lower temperatures (lanes 5 and 6), the major protein band corresponding to β-lactoglobulin demonstrated an increase of MW by 2000–5000 Da. The SDS-PAGE results are consistent with previous studies that reported the higher molecular weight products of whey protein and saccharide mixtures heated for a longer time.28–31
 |
| Fig. 1 SDS-PAGE of WPI and the WPI–MD conjugates. (lane a) Molecular weight markers; (lane 1) WPI, (lane 2) a mixture of WPI and MD; (lanes 3–5) the WPI–MD conjugates prepared via heating at 135 °C for 10, 30 and 60 min; (lane 6) the WPI–MD conjugate prepared via heating at 90 °C for 2 h; (lane 7) the WPI–MD conjugate prepared via heating at 115 °C for 2 h. | |
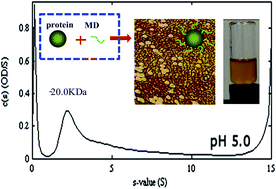
AUC. AUC is a non-destructive method used to study the molecular weight and self-assembled structures of water-soluble polymers, including proteins.32,33 The sedimentation coefficient (s) distributions, c(s), of WPI and WPI–MD conjugates are presented in Fig. 2. The weight-average molecular masses of untreated WPI were determined to be 18.0, 38.2, 29.1 and 18.0 kDa at pH 3.0, 4.0, 5.0 and 6.0, respectively (Fig. 2). At each pH, the major peak comprised more than 95% of the total signal and the higher order species were insignificant. These results indicate that untreated whey proteins are primarily monomeric at pH 3.0 and 6.0, form some dimers at pH 5.0 and are predominately dimers at pH 4.0. After conjugation with MD via heating at 135 °C for 60 min, the sedimentation profile showed both a change in the s value of the major peak relative to untreated WPI and the appearance of higher order species (Fig. 2). At pH 3.0, 4.0 and 6.0, the major peak is shifted to a higher s value reflecting the added mass after conjugation. At pH 5.0, the major peak shifts to a lower s value. This change results from a shift to mostly monomeric species from the mixture of monomers and dimers observed in untreated WPI. Thus, MD attachment inhibits dimer formation at pH 5.0. This is likely caused by the pI shift of whey protein towards a lower pH after conjugation (Fig. 4D below). It is also possible that the WPI–MD conjugate is unable to form dimers at this pH due to steric hindrance provided by the MD molecules attached to WPI. At each pH condition tested, greater than one half of the protein sedimented as a higher order (larger than dimer) species. The WPI–MD conjugates showed a lower degree of polymerization with increasing pH (Table 1). At pH 6.0, 44.2% of the loading concentration was in the monomer/dimer range. This value decreased with a decrease in pH, dropping to 34.7% at pH 3.0.
 |
| Fig. 2 The best-fit distributions obtained from the analytical ultracentrifugation of WPI (A) and the WPI–MD conjugates (B) at pH 3.0–6.0. | |
Table 1 Size-distribution of the WPI–MD conjugate determined by the sedimentation velocity obtained via analytical ultracentrifugation
pH |
Parameters |
Major peak |
Multimeric species ≤ 200 kDa |
Multimeric species > 200 kDa |
3.0 |
c(s) range |
1.03–3.51 |
3.61–10.38 |
≥10.40 |
Percentage of sample |
34.7% |
33.3% |
32.0% |
Weight average c(s) |
2.27 |
6.13 |
14.40 |
4.0 |
c(s) range |
2.69–5.23 |
5.23–10.51 |
≥10.52 |
Percentage of sample |
40.9% |
33.0% |
26.1% |
Weight average c(s) |
3.51 |
7.59 |
13.89 |
5.0 |
c(s) range |
1.01–4.02 |
4.02–10.00 |
≥10.01 |
Percentage of sample |
42.3% |
28.6% |
29.1% |
Weight average c(s) |
2.41 |
6.32 |
13.8 |
6.0 |
c(s) range |
1.09–3.52 |
3.52–10.00 |
≥10.01 |
Percentage of sample |
44.2% |
33.4% |
22.4% |
Weight average c(s) |
2.19 |
5.96 |
13.47 |
The molecular weight calculations for the WPI–MD conjugates are complicated because the exact number of modifications per protein molecule is not known. Increasing the number of modifications will both increase the frictional coefficient (f/f0) and decrease the partial specific volume (
) of the glycated protein.34 Both these properties are variables in the molecular weight calculations from the sedimentation velocity data. Therefore, only a range of molecular weight values could be determined for the WPI–MD data using a combination of continuous c(s, f/f0) and continuous c(s) with fixed (f/f0) analysis. The values are shown in Fig. 2B. At pH values of 3.0 and 5.0, the major peak contains monomeric protein with 3–5 MD molecules attached. This calculation uses the molecular weight of 18.0 kDa determined by AUC of untreated WPI and the molecular weight of 1.0 kDa for MD. At pH 6.0, this calculation shows 2–4 MD molecules per protein. At pH 4.0, the major peak appears to contain 2–8 MD molecules per dimer (or 1–4 MD per monomer).
3.2. Heat stability of the glycated WPI
The heat stability of the WPI–MD conjugates was evaluated by heating aqueous solutions containing 5% w/v protein at 88 °C for 2 min, as shown in Fig. 3 for a simple mixture of WPI and MD, and the WPI–MD conjugates prepared via heating at 115 °C for 2 h and 135 °C for 30 min and 1 h (Fig. 3). All samples at pH 3.0 remained flowable and clear after heating at all NaCl concentrations. At pH 7.0, the unconjugated WPI became more turbid at a higher ionic strength, which is in contrast with the transparent appearance of all the conjugate samples. At pH 4.0–6.0, near the pI of whey proteins, unconjugated WPI formed turbid weak gels that flew upon inverting the vials. The conjugate prepared via heating at 115 °C had a similar heat stability as unconjugated WPI, with improvement only at pH 7. The conjugate prepared via heating at 135 °C for 30 min remained transparent at pH 3.0, 6.0 and 7.0 and that glycated at 135 °C for 1 h remained transparent at pH 3.0 and 5.0–7.0. For both conjugate samples prepared at 135 °C for 30 min and 1 h, no remarkable effects due to the salt concentration were noticed. The darker color generated by glycation at a higher temperature is a drawback to be studied in future research, this unfavorable change in color also existed in the glycation under controlled RH conditions.9,35 Approaches towards reducing color generation during the Maillard reaction include the adoption of high pressure36 and incorporation of catechol-containing compounds37 and ferulic acid.38
 |
| Fig. 3 Images of aqueous dispersions containing 5% w/v WPI after heating at 88 °C for 2 min: a simple mixture of WPI and MD at a mass ratio of 2 : 1 (A), the WPI–MD conjugates prepared via heating at 115 °C for 2 h (B), 135 °C for 0.5 h (C) and 135 °C for 1 h (D). All samples were adjusted to pH 3.0–7.0 and 0, 50, 100 and 150 mM NaCl (vials from left to right in each image) before heating. | |
As discussed previously, the weakened electrostatic repulsion at pH values approaching the pI and increased ionic strength favors protein aggregation as a result of short-range hydrophobic and long-range van der Waals attractions.39 Hydrophobic attraction is further strengthened after thermal denaturation.6 This was demonstrated for unconjugated WPI in Fig. 3A. For conjugates, the glycated MD creates a molecular layer on protein molecules to provide steric hindrance against protein aggregation, as demonstrated in Fig. 3B–D and previously discussed.28,29,40 Because MD is non-ionic and much bulkier than ions, the steric repulsion is not affected by the NaCl concentration, as shown for the samples glycated at 135 °C. After glycation, the pI of WPI shifted to ∼pH 4.0 (Fig. 5D), which is in agreement with the literature.41 Therefore, the steric repulsion is strong enough to prevent extensive aggregation before heating but the thermal denaturation of whey protein strengthens the hydrophobic attraction that is strongest at the pI, still causing turbid gels after heating at pH 4.0.
3.3. Secondary structure changes of glycated whey protein after heating in solution at different pH conditions
Dispersions of WPI and WPI–MD conjugates prepared by heating at 135 °C for 1 h were adjusted to pH 3.0, 5.0 and 7.0 for heating at 88 °C up to 2 min and the resulting samples were characterized using far-UV CD spectra (Fig. 4 and Table 2). The negative peak near 210–220 nm was observed for WPI and is characteristic of a β-sheet-type secondary structure.22,42 The secondary structure compositions of WPI and the WPI–MD conjugates calculated using the CONTIN/LL program in CDPro software43 are tabulated in Table 2. Before heating, WPI was composed of 24.5% α-helix, 35.4% β-sheets, 12.5% turns and 30.8% aperiodic structures at pH 7.0. These numbers are a slightly different to an earlier study reporting 20.5% α-helix, 42.5% β-sheet, 1.5% turns, and 34.5% aperiodic structures at pH 7.0,22 the difference between them may be attributed to processing and the variety of WPI. When WPI was heated at pH 3.0, the CD spectra remained practically unchanged (Fig. 4). At pH 5.0, the ellipticity became less negative after heating for a longer time and the peak shifted to a longer wavelength (Fig. 4), corresponding to a significant increase in the content of the aperiodic structures (from 31.2% to 47.3%) and decreases in the β-sheet (from 37.2% to 20.9%) and α-helix (from 24.7% to 10.4%) structures (Table 2). At pH 7.0, a shift in the CD spectra to a longer wavelength after heating for a longer time was also observed, which was in general agreement with a study where WPI was heated at 70 °C and pH 7.0.22 Increases in the content of the aperiodic structures after heating were the most significant at pH 5.0 (Table 2), indicating protein denaturation after heating is more pronounced near the pI.
 |
| Fig. 4 Far-UV CD spectra of aqueous solutions containing WPI (A–C) and the WPI–MD conjugates prepared via heating at 135 °C for 1 h (D–F). Samples were adjusted to pH 3.0 (A and D), 5.0 (B and E) and 7.0 (C and F) and heated at 88 °C for 0 (black), 0.5 (red), 1 (blue), 1.5 (green), and 2 min (pink). | |
Table 2 Secondary structure compositions (%) of WPI and the conjugatea before and after heating at 88 °C for different durations
|
Duration (min) |
α-Helix |
β-Strand |
Turns |
Aperiodic structure |
The conjugate was prepared via heating at 135 °C for 1 h. |
WPI |
pH 3.0 |
0 |
25.7 |
35.2 |
10.6 |
31.4 |
0.5 |
24.5 |
34.3 |
11.5 |
31.1 |
1.0 |
23.4 |
34.0 |
11.1 |
32.1 |
1.5 |
23.2 |
32.6 |
11.3 |
32.6 |
2.0 |
22.6 |
32.1 |
10.9 |
32.7 |
pH 5.0 |
0 |
24.7 |
37.2 |
11.9 |
31.2 |
0.5 |
21.6 |
34.5 |
16.1 |
33.8 |
1.0 |
18.2 |
30.1 |
16.1 |
34.5 |
1.5 |
15.3 |
22.4 |
19.4 |
45.4 |
2.0 |
10.4 |
20.9 |
18.8 |
47.3 |
pH 7.0 |
0 |
24.5 |
35.4 |
12.5 |
30.8 |
0.5 |
23.3 |
34.6 |
9.5 |
31.4 |
1.0 |
22.6 |
32.5 |
9.2 |
29.7 |
1.5 |
21.0 |
31.8 |
10.6 |
32.2 |
2.0 |
19.7 |
30.4 |
9.9 |
33.6 |
Conjugate |
pH 3.0 |
0 |
30.3 |
29.9 |
9.2 |
21.5 |
0.5 |
26.2 |
22.7 |
4.3 |
22.8 |
1.0 |
21.5 |
21.3 |
4.9 |
28.6 |
1.5 |
20.7 |
20.9 |
5.6 |
29.2 |
2.0 |
20.3 |
20.6 |
6.5 |
33.9 |
pH 5.0 |
0 |
26.8 |
35.0 |
12.8 |
24.2 |
0.5 |
25.9 |
29.2 |
7.6 |
26.8 |
1.0 |
22.9 |
27.5 |
11.3 |
30.2 |
1.5 |
22.4 |
23.0 |
10.1 |
32.5 |
2.0 |
21.3 |
20.4 |
8.6 |
33.3 |
pH 7.0 |
0 |
28.5 |
38 |
11.9 |
22.7 |
0.5 |
26.6 |
34.8 |
19.2 |
26.7 |
1.0 |
22.9 |
30.3 |
15.8 |
29.2 |
1.5 |
22.7 |
28.9 |
12.9 |
30.5 |
2.0 |
22.1 |
27.8 |
15.7 |
32.9 |
After glycation with MD, the percentage of aperiodic structures significantly decreased (Table 2). When the WPI–MD conjugates were heated at 88 °C for 2 min, the magnitude of negative ellipticity decreased significantly under all the pH conditions examined, corresponding to significant decreases in the β-sheet and α-helix structures and increases in the content of aperiodic structures (Table 2). It can be noted that major changes in the CD spectra occurred within 1 min after heating at 88 °C for both WPI and the WPI–MD conjugate (Table 2), indicating that heating for 2 min was long enough to compare the heat stability characteristics of the WPI treatments.
3.4. Morphology of glycated WPI after heating in solution at pH 3.0 and 5.0
AFM was applied to further investigate the structures of glycated WPI after heating at pH 3.0 and 5.0 without NaCl. AFM has the unique ability to study the topographical images of both separated and aggregated proteins without complicated sample preparation.23 At an identical mass concentration (10 ppm), a greater number of ellipsoidal particles were observed at pH 5.0 than at pH 3.0 (Fig. 5A and B), indicating a greater extent of protein aggregation at pH 5.0. The representative height profiles of the protein particles are shown in Fig. 5C. The particles formed at pH 5.0 were generally taller than those at pH 3.0, with maximum heights of 34.5 and 20.2 nm at pH 5.0 and 3.0, respectively. Therefore, it can be concluded that the conjugated sample had a greater tendency to aggregate at pH 5.0 than at pH 3.0, resulting in the increased turbidity at pH 5.0 (Fig. 3). The structures smaller than 40 nm were not sufficiently big to cause turbidity, enabling mostly transparent dispersions after heating.
 |
| Fig. 5 Topographical (left) and error (right) AFM images of the WPI–MD conjugates prepared via heating at 135 °C for 1 h, after heating at 88 °C for 2 min in aqueous solutions at pH 5.0 (A) and (B) 3.0. The particle heights at the drawn lines are shown in (C). Scan sizes: 2 × 2 μm (top), 5 × 5 μm (middle) and 20 × 20 μm (bottom). (D) The zeta potential profiles of WPI and the WPI–MD conjugate before and after heating at 88 °C for 2 min. The conjugate sample was prepared by 1 h glycation at 135 °C. Error bars are standard errors from triplicate measurements. | |
4. Conclusions
It has been demonstrated that the heat stability of whey protein can be improved by glycation with MD even without control of the relative humidity with more pronounced improvements observed with a greater degree of glycation. Glycation at a higher temperature for a longer time increased the MW to a greater extent, as previously reported based on SDS-PAGE. With AUC, the increase in MW was estimated to be about 4 MD molecules glycated onto each whey protein molecule. The percentage of ordered secondary structures of WPI decreased after glycation and decreased further after heating in an aqueous solution. Glycation lowered the pI of WPI from pH 4.5 to 4.0, which is similar to that previously reported in the literature. The glycated MD provided steric hindrance that reduced protein aggregation during heating over a wide range of pH and ionic strength, except at pH values near the pI when the hydrophobic interactions are stronger than the repulsive steric interactions. AFM revealed that glycated WPI aggregated to a greater extent at pH 5.0, near the pI of WPI than at pH 3.0, but the aggregated protein particles were small enough to prevent turbidity. The present study provides helpful guidelines for the development of transparent beverages containing relatively high contents of whey proteins.
Acknowledgements
This study was supported by the National Natural Science Foundation for Young Scholars of China (31401640), the Scientific Research Foundation for the Returned Overseas Chinese Scholars, the State Education Ministry, and the Chen Guang Project supported by the Science Technology Foundation for Young Scientist of HuBei Province, China (2014072704011258). We also appreciate funding from the Science and Technology Support Program of Hubei Province, China (2015BBA167).
References
- E. A. Foegeding, J. P. Davis, D. Doucet and M. K. McGuffey, Trends Food Sci. Technol., 2002, 13, 151 CrossRef CAS.
- B. Hickstein and U. A. Peuker, Biotechnol. Prog., 2008, 24, 409 CrossRef CAS.
- T. Nakano and L. Ozimek, Biotechnol. Lett., 2000, 22, 1081 CrossRef CAS.
- A. P. Golovanov, G. M. Hautbergue, S. A. Wilson and L. Y. Lian, J. Agric. Food Chem., 2004, 126, 8933 CAS.
- W. Zhang and Q. Zhong, J. Agric. Food Chem., 2009, 57, 9181 CrossRef CAS.
- C. M. Bryant and D. J. McClements, Trends Food Sci. Technol., 1998, 9, 143 CrossRef CAS.
- A. Visser and A. Thomas, Food Rev. Int., 1987, 3, 1 CrossRef.
- G. Liu and Q. Zhong, Food Hydrocolloids, 2013, 32, 87–96 CrossRef CAS.
- G. Liu and Q. Zhong, J. Agric. Food Chem., 2012, 60, 9754–9762 CrossRef CAS.
- C. A. Dunlap and G. L. Côté, J. Agric. Food Chem., 2005, 53, 419 CrossRef CAS.
- N. Neirynck, P. Van Der Meeren, S. Bayarri Gorbe, S. Dierckx and K. Dewettinck, Food Hydrocolloids, 2004, 18, 949 CrossRef CAS.
- K. Fujiwara, T. Oosawa and H. Saeki, J. Agric. Food Chem., 1998, 46, 1257 CrossRef CAS.
- E. Dickinson and S. R. Euston, in Food Polymers, Gels and Colloids, ed. E. Dickinson, Royal Society of Chemistry: Cambridge, UK, 1991, p. 132 Search PubMed.
- D. Zhu, S. Damodaran and J. A. Lucey, J. Agric. Food Chem., 2010, 58, 2988 CrossRef CAS.
- R. Parker, T. R. Noel, G. J. Brownsey, K. Laos and S. G. Ring, Biophys. J., 2005, 89, 1227 CrossRef CAS.
- J. R. Molek and A. L. Zydney, Biotechnol. Prog., 2007, 23, 1417 CrossRef CAS.
- G. J. Brownsey, T. R. Noel, R. Parker and S. G. Ring, Biophys. J., 2003, 85, 3943 CrossRef CAS.
- L. M. Marchal, H. Beeftink and J. Tramper, Trends Food Sci. Technol., 1999, 10, 345–355 CrossRef CAS.
- F. Avaltroni, P. Bouquerand and V. Normand, Carbohydr. Polym., 2004, 58, 323–334 CrossRef CAS.
- P. Schuck, Biophys. J., 2000, 78, 1606 CrossRef CAS.
- M. R. Etzel, J. Nutr., 2004, 134, 996S CAS.
- H. Zhu and S. Damodaran, J. Agric. Food Chem., 1994, 42, 846 CrossRef CAS.
- G. Liu, J. Li, K. Shi, S. Wang, J. Chen, Y. Liu and Q. Huang, J. Agric. Food Chem., 2009, 57, 4552 CrossRef CAS.
- M. Rief, F. Oesterhelt, B. Heymann and H. E. Gaub, Science, 1997, 275, 1295 CrossRef CAS.
- A. R. Kirby, A. P. Gunning and V. J. Morris, Biopolymers, 1996, 38, 355 CrossRef CAS.
- C. Mao, W. Sun and N. C. Seeman, J. Am. Chem. Soc., 1999, 121, 5437 CrossRef CAS.
- H. G. Hansma, D. Laney, M. Bezanilla, R. L. Sinsheimer and P. K. Hansma, Biophys. J., 1995, 68, 1672 CrossRef CAS.
- J. Lillard, D. Clare and C. Daubert, J. Dairy Sci., 2009, 92, 35 CrossRef CAS.
- M. Akhtar and E. Dickinson, Colloids Surf., B, 2003, 31, 125–132 CrossRef CAS.
- J. Boratyński and R. Roy, Glycoconjugate J., 1998, 15, 131 CrossRef.
- M. Akhtar and E. Dickinson, Food Hydrocolloids, 2007, 21, 607 CrossRef CAS.
- T. M. Laue and W. F. Stafford III, Annu. Rev. Biophys. Biomol. Struct., 1999, 28, 75 CrossRef CAS PubMed.
- X. T. Hao, T. Ryan, M. F. Bailey and T. A. Smith, Macromolecules, 2009, 42, 2737 CrossRef CAS.
- H. Durchschlag, Colloid Polym. Sci., 1989, 267, 1139 CAS.
- M. J. Spotti, M. J. Perduca, A. Piagentini, L. G. Santiago, A. C. Rubiolo and C. R. Carrara, Food Hydrocolloids, 2013, 31, 26–32 CrossRef CAS.
- Y. G. Guan, P. Yu, S. J. Yu, X. B. Xu, W. H. Shi and W. W. Sun, Food Chem., 2011, 127, 596 CrossRef CAS PubMed.
- Y. Fujiwara, N. Kiyota, K. Tsurushima, M. Yoshitomi, K. Mera, N. Sakashita, M. Takeya, T. Ikeda, T. Araki and T. Nohara, Free Radical Biol. Med., 2011, 50, 883 CrossRef CAS PubMed.
- J. M. Silván, S. H. Assar, C. Srey, M. D. del Castillo and J. M. Ames, Food Chem., 2011, 128, 208 CrossRef PubMed.
- Y. L. Xiong, K. A. Dawson and L. Wan, J. Dairy Sci., 1993, 76, 70 CrossRef CAS.
- E. Dickinson and V. B. Galazka, Food Hydrocolloids, 1991, 5, 281 CrossRef CAS.
- Q. Wang and B. Ismail, Int. Dairy J., 2012, 25, 112 CrossRef.
- D. Zirwer, K. Gast, H. Welfle, B. Schlesier and K. Dieter Schwenke, Int. J. Biol. Macromol., 1985, 7, 105 CrossRef CAS.
- N. Sreerama and R. W. Woody, Anal. Biochem., 2000, 287, 252 CrossRef CAS PubMed.
|
This journal is © The Royal Society of Chemistry 2016 |
Click here to see how this site uses Cookies. View our privacy policy here.