Interband-transition-modified third-order nonlinear optical properties of Al nanoshells in carbon disulfide

Guangyi Jiaa and Chungang Guo*b
aSchool of Science, Tianjin University of Commerce, Tianjin 300134, PR China
bKey Laboratory of Beam Technology and Material Modification of the Ministry of Education, College of Nuclear Science and Technology, Beijing Normal University, Beijing 100875, PR China. E-mail: hngcg@bnu.edu.cn

Received 6th December 2015 , Accepted 11th January 2016

First published on 14th January 2016


Abstract

Interband transitions have important impacts on the nonlinear responses of metal nanoparticles. This work calculated the third-order nonlinear refraction index n2eff and absorption coefficient βeff of Al nanoshells in liquid carbon disulfide (CS2) by using Maxwell-Garnett effective medium theory. Calculation results reveal that the interband-transition-induced absorption (IA) of Al nanoshells can enhance the nonlinear refraction index and absorption coefficient of composites in the near-infrared region. The peak values of n2eff and βeff deviate from the IA peak and occur on the long-wavelength side of the interband transitions, which could be qualitatively interpreted by the increase in the linear refraction index of the CS2 induced by the irradiation of incident light. With decreasing nanoshell thickness, the n2eff and βeff peaks shift toward longer wavelengths and their deviations from the IA position become more noticeable. Besides, by controlling the nanoshell thickness together with the volume fraction of Al nanoparticles, one can optimize the nonlinear optical response of Al–CS2 composites.

1. Introduction

Motivated by their potential applications in various optoelectronic devices, third-order nonlinear optical materials are attracting extensive interest.1 These materials generally have large optical nonlinearities and fast nonlinear response times, which are very suitable to and versatile in data storage, optical fibers, and all-optical switching, etc.1–4 To realize suitable nonlinear applications in devices, a variety of novel methods have been proposed to improve the nonlinear optical effects. One of these popular approaches involves the design of metallic nanostructures which can excite strongly enhanced localized surface plasmon resonance (LSPR) fields. For example, by incorporating metal nanoparticles (NPs) on or in the expected materials, the third-order nonlinear refraction index and absorption coefficient of the nanocomposites can be increased by several or even tens of times near the LSPR wavelengths relative to those of the host matrices.1–3,5–7 Even so, most of the current research emphasizes the use of noble metal NPs, e.g., Au, Ag, and Cu NPs, which may be due to the fact that their LSPRs generally appear in the visible region. However, noble metals are limited by resources and are very expensive. Instead, metal Al has recently been considered as a potential low-cost alternative since it supports strong LSPR from deep-ultraviolet to infrared wavelengths by good controlling nanostructures.8–10 Particularly, our recent study has shown that the LSPR of Al nanoshells can greatly enhance the third-order nonlinear optical responses of nanocomposites in the deep-ultraviolet to near-visible light region.11

In addition to the strong LSPR, metal Al is also an ideal material for studying the energy-band structure of simple metals since its absorption spectrum is modified by a single strong peak near 1.5 eV (∼827 nm).10 This 1.5 eV absorption peak mainly arises from the transitions between two parallel bands ∑3 → ∑1 in the vicinity of the ∑[110] axis near the K point.10,12 The intrinsic third-order nonlinearity of metallic NPs is just closely related to the interband excitation of non-equilibrium electrons. Especially, if the pump frequency is resonant with certain interband transitions of metal, numerous electrons could be excited to the conduction bands, inducing the reduction and increase of the occupation probabilities for electron states at valence and conduction bands, respectively. As a result, the third-order nonlinearity of metal nanocomposites could be significantly modified.13–16 Unfortunately, current studies on third-order nonlinearity near the interband transitions still mainly focus on noble metal NPs.13–16 The impact of interband transitions of Al NPs on the third-order nonlinear effects has rarely been studied.

In this paper, we investigated the third-order Kerr-type nonlinearity of Al NPs near the interband transitions by using Maxwell-Garnett (MG) effective medium theory. Among various nanostructures, Al nanoshells are preferred here because their resonance wavelengths locate at the ultraviolet region away from the onset of interband transitions. This provides the opportunity to inspect the interband transitions alone. The surrounding medium is liquid carbon disulfide (CS2) which is a stand reference material for characterizing third-order nonlinear optical properties.17,18 Our results show that the interband-transitions-induced absorption (IA) can enhance the third-order nonlinearity of Al–CS2 composite in the near-infrared region. The dependence of the composite nonlinearity on the nanoshell thickness is investigated in detail. This work is useful for better understanding the nonlinear mechanism of Al nanocomposites in wavelengths where the interband transitions occur.

2. Theoretical model and linear optical properties

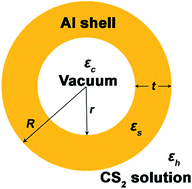
It is assumed that Al nanoshells are uniformly distributed in liquid CS2. The volume fraction f of Al nanoshells is set as 0.01 unless otherwise specified. Each Al nanoshell has an outside radius R = 20 nm. In the following, we will modify and discuss the linear and nonlinear optical properties of Al–CS2 composite by tuning the inside radius r of Al nanoshells. In order to express more clearly, Fig. 1 gives the geometry diagram of one Al nanoshell, where εc, εs, and εh are the dielectric constants of the core, shell, and host material, respectively. The εh value for CS2 is given by εh = ηh2 with ηh = 1.580826 + 15[thin space (1/6-em)]238.9/λ2 + 4.8578 × 10⁸/λ4 − 8.2863 × 10¹³/λ6 + 1.4619 × 10¹⁹/λ8 where λ is the wavelength of incident light.19 The εc value is set as 1.0, indicating a vacuum core. For the calculation of εs value, it is necessary to use the bulk dielectric function εbulk(ω) measured experimentally for Al, which have the contributions from interband transitions and Drude-like free electrons20
 
εbulk(ω) = εinter(ω) + εfree(ω) (1)

image file: c5ra25981a-f1.tif
Fig. 1 Al nanoshell geometry and the defined parameters used for simulations of linear and nonlinear optical properties.

In the Drude model, the free-electron dielectric function is given by

 
image file: c5ra25981a-t1.tif(2)
where ωp is the bulk plasma frequency, ω is the optical angular frequency, and Γbulk is the bulk damping constant arising from the dispersion of electrons. For metallic nanoshells, if the shell thickness t becomes comparable or smaller than the electron mean free path l in bulk metal (l = 16 nm for Al), the scattering of free electrons on particle surface could increase the free-electron collision frequency. Therefore, the damping constant is size-dependent and modified as Γ = Γbulk + vF/t, where vF is the Fermi velocity. Then the dielectric function εs of metallic nanoshells including both the interband transitions part εinter(ω) and the free-electron part εNPfree(ω,t) can be written as
 
image file: c5ra25981a-t2.tif(3)

For the best fit to the dielectric function εbulk(ω) of bulk Al published by Palik,21 the parameters of ωp = 2.24 × 10¹⁶ rad s−1, Γbulk = 7.82 × 10¹⁴ rad s−1, and vF = 1.55 × 10⁶ m s−1 are utilized.

Under the condition of low-concentration Al nanoshells embedded in CS2, MG theory considers the whole system as a homogeneous material with an effective linear dielectric function20,22

 
image file: c5ra25981a-t3.tif(4)

In the above, γ and α stand for the field enhancement factor and the quasi-static polarizability of per hollow NP, respectively. The field enhancement factor γ indicates the ratio of the internal particle response field relative to the incident field. And the quasi-static polarizability α can be described as20,23

 
image file: c5ra25981a-t4.tif(5)

Then we can calculate the linear absorption coefficient of MG composite by

 
image file: c5ra25981a-t5.tif(6)
where εeff,1 and εeff,2 are the real and imaginary parts of εeff, respectively, c is the velocity of light in the vacuum.

Fig. 2 shows the spectral dependence of linear absorption coefficients on nanoshell thicknesses t. In this figure as well as the following figures, “×M” (M is a number) indicates that the corresponding spectrum is obtained from multiplying the original data by M. One can see from Fig. 2 that an absorption peak originating from the LSPR of Al NPs is appeared for each t value in the short-wavelength range. As the t value decreases from 20 to 2 nm, the LSPR peak gradually shifts from 266.8 to 430.0 nm along with the widening of full width at half maximum (FWHM) and the decreasing of peak intensity. Besides the LSPR peaks in the short wavelengths, close views of the optical absorption spectra in the 700–1100 nm range (see the inset in Fig. 2) reveal that Al NPs for each t value give rise to a clear absorption band around 800–1000 nm, which can be attributed to the IA.10 Describe in more detail, interband transitions in an Al NP correlate to the electron excitation from the occupied p-like states to unoccupied s-like states near the Fermi surface.12 On the reduction of the shell thickness, the IA peak gradually shifts toward the long-wavelength side as shown in the inserted figure in Fig. 2. According to previous studies on the IA of noble metal NPs,24,25 the decrease of particle size could increase the discrete nature of the energy bands. This discrete nature can lead the unoccupied discrete level to shift toward the p band. As a consequence, the energy band gap could be narrowed, giving rise to the redshift of IA.


image file: c5ra25981a-f2.tif
Fig. 2 Linear optical absorption coefficients of Al NPs with different nanoshell thicknesses t. The inset shows the partially magnified optical spectra for clarity.

3. Third-order nonlinear optical properties

For one third-order nonlinear optical material with a linear refractive index η = n + ik, its nonlinear complex refraction index η2 = n2 + ik2 is generally given by the following equations in the international system of units (SI)26
 
image file: c5ra25981a-t6.tif(7a)
 
image file: c5ra25981a-t7.tif(7b)
where χ(3)R and χ(3)I stand for the real and imaginary parts of the nonlinear susceptibility χ(3), respectively, and ε0 = 8.85 × 10⁻¹² F m−1 is the free-space permittivity. Using eqn (7b), we can deduce the usually measured nonlinear absorption coefficient β = 4πk2/λ.

According to the Z-scan measurement by using 475 fs pulses at a pumping wavelength of 1054 nm, the nonlinear refraction index n2h and absorption coefficient βh of liquid CS2 are 0.35 nm2 W−1 and 8 × 10⁻⁷ nm W−1, respectively.18 In this study, values of n2h and βh are assumed to be constants in the wavelength range 650–1200 nm around the IA of Al nanoshells. Then the third-order nonlinear susceptibility χ(3)h of the liquid CS2 can be deduced via solving the inverse expressions of eqn (7a) and (7b). Accordingly, the effective nonlinear susceptibility of the composite can be calculated by22

 
χ(3)eff = g(3)χ(3)h (8)
with
 
image file: c5ra25981a-t8.tif(9)
here, g(3) is an enhancement factor of the third-order nonlinear susceptibility, arising from the inhomogeneous distribution of the electric fields inside and outside the nanoshell. Substituting eqn (8) and (9) into eqn (7a) and 7(b), the nonlinear complex refraction index η2eff = n2eff + ik2eff of the Al–CS2 composite can be obtained.

Fig. 3 gives the calculated nonlinear refraction index n2eff (panel a) and nonlinear absorption coefficient βeff (panel b). One can see from the figure that all the composites show enhanced nonlinear refraction indexes and absorption coefficients in the near-infrared region compared with the n2h and βh values of the pure liquid CS2. Different from the previous study in which n2eff and βeff could present negative values near the LSPR wavelengths,7,11 all the values of n2eff and βeff are positive around the IA wavelengths. Moreover, the peak values of n2eff and βeff locate at the long-wavelength side of the IA, and this deviation becomes more and more noticeable as the t value decreases, as shown in Fig. 4. Around the LSPR wavelengths, the extreme value of n2eff gradually shifts toward the resonance wavelength with increasing the nanoshell thickness and just appears at the LSPR position when t = R.7 In contrast, the difference between the peak values of n2eff (or βeff) and IA tends to a nonzero constant with increasing the nanoshell thickness (see Fig. 4b). And the values of n2eff,peak–IApeak and βeff,peak–IApeak are 90.8 and 5.8 nm, respectively, for solid Al NPs with t = 20 nm.


image file: c5ra25981a-f3.tif
Fig. 3 Nonlinear (a) refraction indexes and (b) absorption coefficients of Al–CS2 composites.

image file: c5ra25981a-f4.tif
Fig. 4 (a) Peak positions of IA, n2eff and βeff, and (b) the differences between the peak values of n2eff (or βeff) and IA. Symbols are from the calculated data, and lines are just drawn as a guide to the eye.

The shell thickness-dependent electron surface scattering may account for the gradual deviations of n2eff and βeff peaks from the IA wavelengths with decreasing the t value.11 Nevertheless, the n2eff and βeff peaks locate at the long-wavelength side of the IA wavelength even in the case of solid Al NPs, which are different from the behaviors of n2eff and βeff near the LSPR. This discrepancy could be qualitatively explained by the variation of the host refractive index as a high irradiance of incident light can generally increase the linear refractive index ηh of the host matrix.7 The increase of the real part of ηh can give rise to a red-shift of LSPR absorption peak and the appearance of the imaginary part of ηh can broaden and weaken the resonance absorption peak of the nanocomposite.20 However, Fig. 5a shows that the IA wavelength of solid Al NPs is nearly unchanged after an artificial increase in the real part of ηh, and the IA peak disappears after an introduction of the imaginary part in ηh. By contrast, the n2eff peak gradually shifts toward long wavelengths along with the increase of kh while its position keeps nearly unchanged after increasing nh (Fig. 5b). As for the βeff peak (Fig. 5c), it slightly shifts from 834.8 to 839.8 nm as the nh increases to nh + 0.3, and is seriously weakened by the introduction of kh. From these results, we can see that the increases of nh and kh could not induce the change of IA wavelength in solid Al NPs. Nevertheless, they could cause the redshifts of βeff and n2eff peaks, respectively. This could be responsible for the deviations of n2eff and βeff peaks from the IA wavelength in the case of solid Al NPs. By comparing Fig. 5b and c, one can also find that the redshift of n2eff peak induced by increasing kh is larger than that of βeff peak induced by increasing nh. For hollow Al NPs, e.g., Al nanoshells with t = 4 nm as shown in Fig. S1 (see the ESI), the n2eff and βeff peaks shift to the largest wavelengths when the kh value increases to 0.3. However, the redshifts of n2eff and βeff peaks are about 43 and 35 nm, respectively. These results mean that the largest redshift of n2eff peak induced by changing the host refractive index is larger than that of βeff peak. This may explain why the n2eff peaks are longer than βeff peaks as shown in Fig. 3 and why the n2eff,peak–IApeak values are much larger than βeff,peak–IApeak values as shown in Fig. 4b.


image file: c5ra25981a-f5.tif
Fig. 5 (a) Linear absorption coefficient σabs, nonlinear (b) refraction index n2eff and (c) absorption coefficient βeff of an Al–CS2 composite with and without artificial increases in the linear refractive index or absorption coefficient of the CS2 host. The thickness of Al nanoshells is set as t = 20 nm. Dashed vertical lines indicate the peak positions of σabs, n2eff and βeff without changing the ηh value, i.e., ηh = nh.

To evaluate the interplay between the linear and nonlinear absorptions near the interband transitions, the transmitted intensity Iout being a function of irradiance intensity Iinc is calculated at 850 nm. Considering the presence of both linear and third-order nonlinear absorptions in the media, one can obtain the transmitted intensity by27

 
image file: c5ra25981a-t9.tif(10)
where L is the length of the sample, and
 
image file: c5ra25981a-t10.tif(11)
is the reflectivity at normal incidence, and neff is the real part of linear refractive index of the composite.

Fig. 6a presents the intensity transmitted through one Al–CS2 composite with L = 10 μm. One can see from the figure that the transmission function is nearly linear at lower irradiance intensities. As the value of Iinc increases, the nonlinear effect becomes noticeable and Iout begins to deviate from the linear response. An irradiance threshold value at which Iout deviates from the linear transmission by 50 percent can be defined. And this irradiance threshold value decreases from ∼1.9 × 10⁵ GW cm−2 for t = 20 nm to ∼5.2 × 10⁴ GW cm−2 for t = 2 nm. Further increasing the irradiance intensity will lead the total transmitted intensity to become saturated. Because the nonlinear absorption coefficient βeff increases as the nanoshell becomes thinner as shown in Fig. 3b, the saturation intensity transmitted through the sample decreases with reducing the t value. Besides, the linear transmission in the lower irradiance intensities also decreases with reducing the t value. This could originate from the interband-transitions-induced linear absorption that gradually increases with decreasing the nanoshell thickness as observed in the inset in Fig. 2. These results mean that one challenge being similar with that occurs in utilizing LSPR to enhance the nonlinear refraction and absorption may also exist in the current case: even if the nonlinear response can be enhanced by the IA, the linear loss induced by interband transitions should be minimized.


image file: c5ra25981a-f6.tif
Fig. 6 Transmitted intensity as a function of irradiance intensity at 850 nm for Al–CS2 composites with different nanoshell thicknesses t and volume fractions f.

Apart from the nanoshell thickness t, the volume fraction f of NPs is also one important factor to modify the transmission function.7 The larger volume fraction generally gives a larger linear absorption coefficient. Nevertheless, the thicker Al nanoshells present a lower linear absorption value near the IA wavelength as shown in the inset in Fig. 2. Considering this, it is possible to obtain the similar transmission function curves by simultaneously increasing the nanoshell thickness and the volume fraction of Al NPs. For example, the Iout values of Al–CS2 composite with t = 2 nm and f = 0.01 are close to those of composite with t = 20 nm and f = 0.078 as shown in Fig. 6b. Additionally, Fig. 6b also shows that if the nanoshell is fixed, one can enhance the nonlinear transmitted intensity by decreasing the volume fraction. Combining the nanoshell thickness with the volume fraction provides more degrees to modulate and optimize the nonlinear response of metallic nanocomposites.

4. Conclusions

On the basis of MG theory, we investigated the influence of interband transitions on the third-order nonlinear optical properties of Al nanoshells in liquid CS2. Our results reveal that the IA can enhance the nonlinear optical response of Al–CS2 composite in the near-infrared region. It may be due to the increase in the linear refraction index of the host matrix induced by the irradiation of incident light, the n2eff and βeff peaks appear at the long-wavelength side of the IA wavelength for the solid Al NPs, which are distinct from the behaviors of n2eff and βeff near the LSPR. As the nanoshell becomes thinner, the n2eff and βeff peaks shift toward longer wavelengths and their deviations from the IA wavelength become more noticeable. For a fixed volume fraction of Al NPs, the nonlinear transmitted intensity decreases with reducing the nanoshell thickness. If the nanoshell thickness keeps unchanged, one can obtain the enhanced nonlinear transmitted intensity by decreasing the volume fraction of NPs. These results may provide insights into the interplay between the interband transitions and the third-order nonlinearity of Al NPs, and give more degrees to modify and optimize the nonlinear optical properties of nanocomposites.

Notes and references

  1. A. L. Stepanov, Rev. Adv. Mater. Sci., 2011, 27, 115–145 CrossRef CAS.
  2. O. Sánchez-Dena, P. Mota-Santiago, L. Tamayo-Rivera, E. V. García-Ramírez1, A. Crespo-Sosa, A. Oliver and J.-A. Reyes-Esqueda, Opt. Mater. Express, 2014, 4, 92–100 CrossRef.
  3. W. D. Xiang, H. H. Gao, L. Ma, X. Ma, Y. Y. Huang, L. Pei and X. J. Liang, ACS Appl. Mater. Interfaces, 2015, 7, 10162–10168 CAS.
  4. C. L. Wu, Y. H. Lin, S. P. Su, B. J. Huang, C. T. Tsai, H. Y. Wang, Y. C. Chi, C. I. Wu and G. R. Lin, ACS Photonics, 2015, 2, 1141–1154 CrossRef CAS.
  5. C. Zheng, W. Z. Chen, Y. Y. Huang, X. Q. Xiao and X. Y. Ye, RSC Adv., 2014, 4, 39697–39703 RSC.
  6. G. Y. Jia, H. T. Dai, X. Y. Mu, C. G. Guo and C. L. Liu, Opt. Mater. Express, 2015, 5, 1156–1167 CrossRef.
  7. D. C. Kohlgraf-Owens1 and P. G. Kik, Opt. Express, 2008, 16, 16823–16834 CrossRef.
  8. M. Honda, Y. Kumamoto, A. Taguchi, Y. Saito and S. Kawata, Appl. Phys. Lett., 2014, 104, 061108 CrossRef.
  9. O. Lecarme, Q. Sun, K. Ueno and H. Misawa, ACS Photonics, 2014, 1, 538–546 CrossRef CAS.
  10. C. Langhammer, M. Schwind, B. Kasemo and I. Zorić, Nano Lett., 2008, 8, 1461–1471 CrossRef CAS PubMed.
  11. G. Y. Jia, C. L. Liu and H. T. Dai, Plasmonics, 2015, 10, 211–217 CrossRef.
  12. H. Ehrenreich, H. R. Philipp and B. Segall, Phys. Rev., 1963, 132, 1918–1928 CrossRef CAS.
  13. M. Kauranen and A. V. Zayats, Nat. Photonics, 2012, 6, 737–748 CrossRef CAS.
  14. M. Conforti and G. D. Valle, Phys. Rev. B: Condens. Matter Mater. Phys., 2012, 85, 245423 CrossRef.
  15. L. Yang, D. H. Osborne, R. F. Haglund Jr, R. H. Magruder, C. W. White, R. A. Zuhr and H. Hosono, Appl. Phys. A, 1996, 62, 403–415 CrossRef.
  16. A. Marini, M. Conforti, G. Della Valle, H. W. Lee, T. X. Tran, W. Chang, M. A. Schmidt, S. Longhi, P. S. J. Russell and F. Biancalana, New J. Phys., 2013, 15, 013033 CrossRef.
  17. M. Reichert, H. Hu, M. R. Ferdinandus, M. Seidel, P. Zhao, T. R. Ensley, D. Peceli, J. M. Reed, D. A. Fishman, S. Webster, D. J. Hagan and E. W. van Stryland, Optica, 2014, 1, 436–445 CAS.
  18. R. A. Ganeev, J. Opt. A: Pure Appl. Opt., 2005, 7, 717–733 CrossRef CAS.
  19. A. Samoc, J. Appl. Phys., 2003, 94, 6167–6174 CrossRef CAS.
  20. U. Kreibig and M. Vollmer, Optical properties of metal clusters, Springer, Berlin, 1995 Search PubMed.
  21. E. D. Palik, Handbook of optical constants of solids, New York, 1985 Search PubMed.
  22. M. I. Stockman, K. B. Kurlayev and T. F. George, Phys. Rev. B: Condens. Matter Mater. Phys., 1999, 60, 17071–17083 CrossRef CAS.
  23. M. Moskovits, I. Srnová-Šloufová and B. Vlčková, J. Chem. Phys., 2002, 116, 10435–10446 CrossRef CAS.
  24. B. Balamurugan and T. Maruyama, Appl. Phys. Lett., 2005, 87, 143105 CrossRef.
  25. B. Balamurugan and T. Maruyama, J. Appl. Phys., 2007, 102, 034306 CrossRef.
  26. R. del Coso and J. Solis, J. Opt. Soc. Am. B, 2004, 21, 640–644 CrossRef CAS.
  27. P. Liu, W. L. Smith, H. Lotem, J. H. Bechtel, N. Bloembergen and R. S. Adhav, Phys. Rev. B: Solid State, 1978, 17, 4620–4632 CrossRef CAS.

Footnote

Electronic supplementary information (ESI) available: Effects of linear refractive index of CS2 on IA, nonlinear refraction index and absorption coefficient of an Al–CS2 composite with t = 4 nm. See DOI: 10.1039/c5ra25981a

This journal is © The Royal Society of Chemistry 2016
Click here to see how this site uses Cookies. View our privacy policy here.