Michele A. Rochaa,
Philippe A. D. Petersenb,
Erico Teixeira-Netoc,
Helena M. Petrillib,
Fabrice Lerouxde,
Christine Taviot-Guehode and
Vera R. L. Constantino*a
aDepartamento de Química Fundamental, Instituto de Química, Universidade de São Paulo, C. P. 26077, CEP 05513-970, São Paulo, SP, Brazil. E-mail: vrlconst@iq.usp.br
bInstituto de Física, Universidade de São Paulo, C. P. 66318, CEP 05315-970, São Paulo, SP, Brazil
cLaboratório Nacional de Nanotecnologia, CNPEM, C. P. 6192, CEP 13083-970, Campinas, SP, Brazil
dUniversité Clermont Auvergne, Université Blaise Pascal, Institut de Chimie de Clermont-Ferrand, BP 10448, F-63000 Clermont-Ferrand, France
eCNRS, UMR 6296, ICCF, F-63178 Aubiere, France
First published on 2nd February 2016
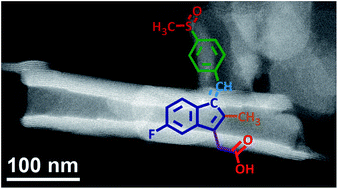
Sulindac, a non-steroidal anti-inflammatory of the indene acetic acid class, was immobilized inside layered double hydroxide Mg2Al and Zn2Al (LDH) nanovessels through a one pot reaction. LDH–drug materials were characterized by chemical elemental analysis, X-ray diffraction (XRD) (one dimensional electron distribution along the c-stacking axis, pair distribution function analysis), scanning and transmission electron microscopies, mass coupled thermal analyses, vibrational infrared and Raman spectroscopies, and solid state 13C NMR. Density Functional Theory (DFT) calculations were performed for sulindac (protonated and deprotonated forms) with the aim to assign the LDH–drug spectroscopic results. All converge towards a spatial organization of interleaved sulindac molecules close to that reported for the pristine polymorph II crystal structure. Of relevance for human treatment because of its biocompatibility and non-immunogenic effect, in vitro sulindac release experiments were performed in a phosphate buffer mimicking biological fluids and release profiles were refined using kinetic models.
Layered double hydroxides (LDHs) are potential candidates to such approach given that one particular composition (known as hydrotalcite) has been already used commercially for antacid therapy.6 Besides acid neutralizing action, commercial hydrotalcite presents mucosal protective property, promotes the angiogenesis in wounded gastric mucosa, steps up curing of human gastroduodenal ulcers, and improves the quality of mucosal scar.7 These 2D materials, and their hierarchical nanocomposites, have important properties that empower them for usage as inorganic nanomedicine, as pointed out by published review works:8–14 biocompatibility, non-immunogenic effects, slow degradation at pH values between 4 to 6, well-timed and mild synthetic conditions (water solvent, no harmful chemicals, one-pot synthesis etc.), and precise control of composition.
LDHs have the general formula [MII(1−x)MIIIx(OH)2]Ax/n·mH2O, wherein MII and MIII are divalent and trivalent cations present in the layer, and A is the anion of valence n which occupies the interlayer region (simplified writing: MIIRMIII-A with R equal MII/MII molar ratio),15 as shown in Fig. 1A. LDH platelets are built up from brucite-type edge-sharing octahedral in which a part of MII octahedral site is substituted by MIII, thus creating positive charged layers. The excess of charge is balanced by anions, i.e. sulindac in the present case, thus permitting the uptake and the transport of sulindac between LDH layers.
Sulindac or Z-5-fluoro-2-methyl-1-((4-(methylsulfinyl)phenyl)methylene)-1H-indene-3-acetic acid (Fig. 1B) has been administrated to patients with severe or chronic inflammatory disorders such as rheumatoid arthritis or osteo-arthritis.16 Indeed, sulindac is a prodrug that is transformed to an active non-steroidal anti-inflammatory drug (NSAID) in the organism. Besides its recognized anti-inflammatory and analgesic properties, some studies have also demonstrated that sulindac presents antiproliferative activity against tumors17 as familial adenomatous polyposis,18 colon,19 prostate,20 breast,21 and lung22 cancers. However, as is the case with other NSAIDs, sulindac frequently may cause severe side-effects in patients such as gastric mucosal erosions, ulcers and liver injury.23
One approach to overcome these inconveniences is immobilizing sulindac into vehicles to control its release. For instance, in vitro release of sulindac in simulated body fluids showed the delivery of 50–80% after one hour only, this by using a solvent dispersing method with poly(L-lactic acid) (PLLA).24 Using a polymers blend with different molecular weights, end chemical groups and co-monomer ratios, implantable drug depot comprising sulindac and biodegradable polymers were found to release over longer time period.25 The main innovation described the possibility of administration by subcutaneous implants at or near a target site. When appropriate formulations are provided, sulindac can be released for up to 180 days in doses approaching 8–10 mg per day to reduce, prevent, or treat pain and/or inflammation. Other methodologies involve targeted delivery systems based on molecular assemblies. In this way, El-Kamel et al.26 have prepared colon-targeting carriers to oral administration through the linkage of the carboxylic unit of sulindac with the amino group of L-aspartic acid or the hydroxyl group of cyclodextrins.
Linkage can also be done at the interface with open inorganic structure. Promising O/I assemblies in which organic loading is sandwiched between LDH layers are more and more considered, but usually the understanding of the spatial host guest organization is not scrutinized. Attempts have been made to reduce NSAID-induced gastroduodenal damage27 and increase the drug action28 through intercalation into LDHs. This class of materials have been reviewed as very favourable hosts for the preparation of hybrid materials with possibility of pH-dependent control release of drugs.29 In the present work, we aim at a detailed structural description of LDH–sulindac assembly.
LDH hybrid materials were synthesized under different temperatures using magnesium–aluminium and zinc–aluminium in a MII/Al3+ molar ratio equal 2 and Al3+/sulindac equal 1 in order to isolate materials with high crystallinity. Complementary physical chemical techniques were employed to characterize LDH–sulindac materials: chemical elemental analysis (C, H, S and metals), X-ray diffraction (XRD), mass coupled thermal analyses (TGA-DSC-MS), vibrational infrared (IR) and Raman spectroscopies, solid state 13C nuclear magnetic resonance (NMR), and scanning (SEM) and transmission (TEM) electron microscopies. Spectroscopic data attributions were supported by Density Functional Theory (DFT) calculations. The usage of pair distribution function (PDF) analysis to evaluate the structure of LDH materials is original and reported by the first time for an intercalated organic species. The metal hydroxide precipitation in the sulindac solution has produced nanoparticles with amazing scrolled forms no observed before for LDHs systems. The higher thermal stability of sulindac into zinc–aluminium LDH compared to the magnesium analogous was investigated by vibrational spectroscopies and a partial grafting reaction was suggested. The drug releasing testing in vitro was performed using LDH–sulindac tablets in simulated intestinal fluid (phosphate buffer solution at pH 7.2 and 37 °C). Kinetic modelling on drug release was investigated using models applied in pharmaceutical field such as Korsmeyer–Peppas, Bhaskar, and Higuchi and also the parabolic diffusion model used in soil studies.
The materials synthesized at room temperature were denoted as MIIRAl–Sul RT where MII is Mg or Zn, and R is 2 (R = MII/MIII) while materials prepared at 55 °C were abbreviated M2IIAl–Sul 55. For comparison purposes, LDHs samples containing intercalated chloride ions (abbreviated M2IIAl–Cl) were prepared in similar conditions by one pot reaction at pH 9.5 (for Mg2Al–LDH sample) or 7.5 (for Zn2Al–LDH) at 55 °C.
To study the release kinetics, data obtained from in vitro drug release are plotted as the cumulative percentage of drug release versus time. Some of empiric kinetic models usually applied for drug delivery systems comprising organic polymers matrices were used for M2IIAl–Sul 55 hybrid materials and for pristine sulindac. A brief description of the models used in this work is given in the ESI.‡
Mass coupled thermal analyses (TG-DSC-MS) were registered on a Netzsch thermoanalyser model TGA/DSC 490 PC Luxx coupled to an Aëolos 403 C mass spectrometer under synthetic air flow of 50 mL min−1 employing alumina crucibles and a heating rate of 10 °C min−1.
Preliminary X-ray diffraction (XRD) measurements on powdered samples were performed on a Philips X-Pert Pro diffractometer equipped with CuKα1/Kα2 radiation (1.5406/1.5444 Å) and graphite monochromator, using 40 kV and 30 mA. Data were collected with steps of 0.02°/2θ in a range of 1.0–90°/2θ and scan speed of 0.02° min−1. Powders were back-loaded in an aluminium sample holder to produce a good sample surface and avoid preferential orientation effects.
UV-vis absorption spectrophotometry experiments were performed on a Shimadzu UV-1650PC spectrophotometer.
The Fourier transform infrared (FT-IR) spectra of samples diluted in KBr were recorded in the 4000–300 cm−1 range on a Bomen spectrophotometer, model MB-102, equipped with a coupled diffuse reflectance accessory (Pike Technologies, Inc.) with a resolution of 4 cm−1 and accumulation of 64 scans.
Fourier transform Raman (FT-Raman) spectra were recorded in a FT-Raman Bruker FRS-100/S spectrometer using 1064 nm exciting radiation (Nd:YAG laser Coherent Compass 1064-500 N) and a Ge detector with a resolution of 4 cm−1 and accumulation of 100 scans. Laser power was kept at 100 mW.
13C (I = 1/2) solid state NMR experiments were performed with a 300 Bruker Advance spectrometer at 75.47 MHz. The experiments were carried out using magic angle spinning (MAS) condition at 10 kHz and a 4 mm diameter size zirconia rotor. 13C spectra obtained by proton enhanced cross-polarization method (CP, contact time of 1 ms, recycling time of 5 s) are referenced to the carbonyl of glycine calibrated at 176.03 ppm. 2.000 to 10.000 scans were needed to obtain a proper signal for sulindac and its LDH hybrid samples.
SEM images were recorded at CA-IQUSP using a Jeol-JSM 7401F (FEG) electron microscope operating at an accelerating voltage of 5 kV at LEI mode. After each synthesis, a fraction of the water washed slurry precipitate was diluted approximately 600 times with distilled water for SEM studies. For the preparation of the electron microscopy samples, one drop of the slurry was deposited onto flat silicon substrates, dried at room temperature and sputtered with a thin gold layer using a HHV Auto306 deposition system.
Bright-field scanning transmission electron microscopy (BF-STEM) images were acquired using a FEI Inspect F50 microscope operating at 30 kV. High-angle annular dark-field (HAADF-STEM) images were acquired using a JEOL-JEM 2100F microscope operating at 200 kV. One drop of the M2Al–Sul 55 slurry diluted 100 times in water was deposited onto standard TEM grids and dried at room temperature. The basal distances d003 were determined in images by measuring the layers spacing using the Image-Pro Plus 6.0 software (Media Cybernetics, Inc.).
The one-dimensional (1D) electron density distribution along the c-stacking axis ρ(z) for Zn2Al–Sul 55 was calculated from the intensity of the 00l diffraction lines according to the following equation:
To calculate the 1D plot, XRD data were collected on a PANalyticalX'Pert PRO X-ray diffractometer in the Bragg–Brentano θ–θ geometry, equipped with a Cu Kα anticathode and X'Celerator linear detector. The scanning angle of the detector was varied within the range 2–80°(2θ) in continuous scanning mode with the following setting conditions: beam mask = 10 mm, divergence slits = 1/321, detector active length = 2.1221, steps size = 0.01671 and counting time = 850 s.
First, the Le Bail-method consisting in the refinement of the total envelope of the XRD patterns was used to determine the cell parameters assuming the Rm space group, typical for LDH materials, and to extract the intensities of diffraction peaks. The Thompson, Cox and Hastings (TCH) pseudo-Voigt function was chosen as profile function.33 It should be noted that the spherical harmonics correction for an anisotropic peak broadening due to size effects was essential to reach a good fit. The background was refined by adjusting the height of preselected points for linear interpolation modelled. The instrumental contribution to peak broadening was estimated using the same TCH profile function by measuring the standard reference sample LaB6 (refined values were: U = 7.8 × 10⁻⁴, V = 9.8 × 10⁻³, W = 4.8 × 10⁻³, X = 3.6 × 10⁻², Y = 2.4 × 10⁻²). The size of the coherent domains could be calculated from the Lorentzian integral breath component using Scherrer equation.34
Afterwards, the hydroxide part of the structure was entered and the F00l structure factors calculated; the signs of the structure factors were directly obtained from the scattering contributions of the Zn2Al(OH)6 hydroxide layers assuming a relatively small contribution of the intercalated molecules. The treatment of the XRD data was carried out using the Fullprof suite program.35
PDF measurements were performed on the CRISTAL beamline at the synchrotron Soleil using high-resolution powder X-ray diffraction data. A monochromatic beam of wavelength 0.43544 Å tuned with a double crystal Si(111) monochromator was used. Each sample was loaded in a rotating 0.7 mm diameter glass capillary, which was mounted on a two-circle diffractometer equipped with an XPAD detector.
The PDF analysis is a total scattering method i.e. considering both the Bragg peaks and diffuse scattering pattern. The Bragg peaks contain information about the long range average structure whereas diffuse scattering may contain information on the disorder, on local structural distortions beyond the average structure.36 At first, the diffraction pattern was corrected for sample holder signal using a separate diffraction measurement of an empty glass capillary, also for Compton scattering, absorption and polarization effects. All these corrections were done using the program PDFgetX2.37 Subsequently, the corrected X-ray diffraction data were scaled into electron units and the structure function S(Q) was calculated. The PDF, which gives the probability to find an atom at a distance r away from another atom, was obtained by a Fourier transformation of S(Q) according to the following equation:
XRD patterns of LDH–sulindac samples show profiles typical of layered double hydroxides (Fig. 2) and the positions of 00l diffraction lines confirm the drug intercalation between LDH carrier layers. Indeed, the first peak indexed as the 003 reflection in Rm space group (3R polytype) is observed at 2θ = 3.80° and 3.65° which correspond to basal distances d003 equal to about 2.32 (see Table S2, ESI‡) and 2.42 nm (see Table 1) for Mg2Al–Sul RT and Zn2Al–Sul RT phases respectively prepared at room temperature. Surprisingly, the interlayer distance of the samples prepared at 55 °C are higher: 2.74 nm and 2.75 nm for Mg2Al–Sul 55 and Zn2Al–Sul 55 respectively. The expansion of the interlayer space is +0.42 nm for Mg2Al–Sul and +0.33 nm for Zn2Al–Sul. Chemical analysis and TGA-DSC-MS data presented ahead show significant modifications in the samples composition that could justify the interlayer space expansion. Zn2Al–Sul sample obtained at 55 °C has a higher hydration degree than the sample precipitate at room temperature (metals/sulindac molar ratios are the same). In contrast, the quantity of sulindac intercalated into Mg2Al–Sul sample increases when the material is precipitate under heating condition. On the other hand, Zn2Al–Sul 55 and Mg2Al–Sul 55 show similar basal spacing (2.75 nm and 2.74 nm, respectively) and intercalated sulindac neutralizes 90% of layer charges (results shown ahead), which suggest that coprecipitation at 55 °C promotes the same interlayer arrangement for guest species in both LDH matrices.
Mg2Al–Sul 55 | Zn2Al–Sul 55 | hkl | ||
---|---|---|---|---|
2θ | d (nm) | 2θ | d (nm) | |
3.23 | 2.74 | 3.21 | 2.75 | (003) |
6.40 | 1.38 | 6.44 | 1.37 | (006) |
9.36 | 0.944 | 9.61 | 0.920 | (009) |
12.8 | 0.694 | 12.8 | 0.689 | (0012) |
16.1 | 0.550 | (0015) | ||
19.6 | 0.452 | 19.6 | 0.452 | (0018) |
22.6 | 0.393 | 22.6 | 0.393 | (0021) |
34.8 | 0.257 | 34.1 | 0.263 | (012) |
60.9 | 0.152 | 60.6 | 0.153 | (110) |
At the same time, the crystallinity of the samples is improved when heat is applied during LDH layers formation in the presence of sulindac; up to nine 00l diffraction lines are observed in the case of Zn2Al–Sul 55 indicating an improvement of the ordering in the stacking direction. Besides a higher d003 basal spacing, samples prepared at 55 °C also show improved crystallinity compared to those one obtained at room temperature. A large number of basal peaks was defined (as shown in Table 1) indicating the formation of particles with well-ordered staking sequence. XRD data confirm that a better structural organization is achieved for LDH–Sul systems when heat is applied during the layers formation in the presence of the organic species. On the other hand, no significant increase in crystallinity was observed for all samples M2Al–Sul 55 when subjected to post-synthesis hydrothermal treatment.
In the case of Zn2Al–Sul 55, the cell parameters were determined accurately using the Le Bail whole powder pattern decomposition method (Fig. 3): a = 3.0639(3) Å, c = 82.791(9) Å with a resulting basal spacing d003 equals to 27.597 Å (c/3). The value of the cell parameter a related to the interatomic distance between two neighbour cations within LDH hydroxide layers is consistent with a Zn2+/Al3+ ratio of 2.0 and the formation of Zn2Al–LDH host.48
If the LDH layer thickness (0.21 nm) and the hydrogen-bond distances between guest and host (0.27) nm are subtracted from the interlayer distance, the space available for sulindac species in the interlayer domain is about 2.01 nm (2.76 − 0.21 − 2 × 0.27) for Zn2Al–Sul 55. The difference between this value to the estimated length of the guest species (1.40 nm, Fig. 2 insert) suggests the formation of a bilayer of interdigitated sulindac anions with the carboxylate groups nearby the positive LDH layers.
Assuming a parallelepiped shape of about 0.9 nm × 0.6 nm × 1.4 nm for sulindac polymorph II (Fig. 2), one can consider a perpendicular orientation of sulindac and estimate the surface area per unit charge for interlayer sulindac projected on LDH hydroxide layer. Taking into account this orientation, the value obtained equals 0.54 nm2 (0.9 nm × 0.6 nm)/e− is higher than the available surface area per unit charge of Zn2Al hydroxide layers (i.e. 0.25 nm2/e− or 0.50 nm2 if the two sides of each layer are considered).49,50 Hence, an interlayer dense packing and/or the co-intercalation of small ion as chloride must be envisaged to ensure compatibility between charge distributions.
The good crystallinity of Zn2Al–Sul 55 sample and the large number of 00l diffraction lines up to nine visible allows probing the structure of the interlayer space by the calculation of a one-dimensional electron density distribution along the c-stacking axis ρ(z) from the analysis of the intensity of the 00l reflections and Fourier transformation. As shown in Fig. 4, peaks on the 1D plot match perfectly with a bilayer arrangement of polymorph II of sulindac molecule with a tilt angle of about 45° with respect to the hydroxide layer. The two most intense peaks are due to the hydroxide layers containing Zn/Al cations. The carboxylate groups cause maxima at the outer parts of the interlayer space at a distance of 4.0 Å from the centre of the hydroxide layers which is consistent with hydrogen bond interactions between carboxylate and OH groups: C–O⋯HO–Zn/Al. The small maximum in the middle of the interlayer space is attributed to the SO bond and implies a bilayer arrangement of sulindac. Interestingly, the interlayer arrangement of sulindac molecules deduced from XRD data analysis is very close to the spatial organization observed in polymorph II crystal structure (Fig. S4, ESI‡). This result is similar to previous results obtained with pravastatin intercalated into LDHs which has also shown to maintain partially the spatial organization of pristine crystals.28,31
The PDF analysis of M2Al–Sul 55 samples provide additional information on the interlayer arrangement. The PDF curves were extracted from high resolution synchrotron X-ray total scattering data and to facilitate interpretation, the same analysis was performed on M2Al–Cl samples.
The PDF curves of the samples are given in Fig. 5. For M2Al–Cl samples (Fig. 5A), the main peaks can be easily attributed based on the structural information available on LDH materials.51,52 For distances below the interlayer distance, PDF peaks correspond to bonds within the same hydroxide layer. Hence, the first peak around 2.0 Å is due to the closest OH shell around M atoms and as expected, the average length of M–OH bonds in Zn2Al(OH)6 hydroxide layers (about 2.06 Å at the peak maximum) is slightly higher than in Mg2Al(OH)6 (2.00 Å). The peaks observed at approximately 3.07 Å (a), 5.3 Å (√3a), and 6.2 Å (2a) are attributed to the M–M bond distances. The other peaks are due to multiple pairs of atoms.
![]() | ||
Fig. 5 Experimental pair distribution functions PDF of (A) M2Al–Cl reference materials compared to (B) Zn2Al–Sul 55 and (C) Mg2Al–Sul 55; peaks are labelled with the corresponding atomic pairs. |
The comparison between M2Al–Cl and M2Al–Sul 55 data enables identification of peaks related to sulindac intercalated species. Due to the high X-ray scattering power of Zn atom (Z = 30, the scattering power increases with the atomic number Z) compared to Mg atom (Z = 12), the PDF signal of Zn2Al(OH)6 hydroxide layers is more intense than that of Mg2Al(OH)6 layers making it difficult to observe the signal from the interlayer space in the case of Zn2Al–Sul 55 (Fig. 5B). On the other hand, in the case of Mg2Al–Sul 55 for which the contrast between the two parts of the structure is weaker in term of X-ray scattering power, the contribution of the interlayer species is clearly visible (Fig. 5C). Thereby, C–C/C–O/C–F/S–O bonds in sulindac can explain the broad peak centered at about 1.4 Å. Interestingly, we observe a splitting of the peak due to Mg/Al–OH bonds into two peaks leading to two distances 1.83 Å and 2.04 Å attributed respectively to Al–OH and Mg–OH bonds. This splitting could results from an ordering of cations within the hydroxide layer upon sulindac intercalation. Other peaks are observed at longer distance that do not exist in Mg2Al–Cl, for instance at approximately 4.2, 5.5 and 5.9 Å and which may be attributed to interatomic distances between neighbouring sulindac anions. Owing to the high X-ray scattering power of S (Z = 16) compared to C (Z = 6), O (Z = 8) and F (Z = 9) atoms, we believe these peaks are due to SO⋯S
O distances. These distances are very close to that observed in sulindac polymorph II crystal structure, between S atoms belonging to a pair of opposite molecules (Fig. S4, ESI‡).
The area occupied by sulindac ion in a tilt (45°) orientation is higher than a perpendicular alignment (about 0.54 nm2) and, consequently, larger than the LDH surface (2 × 0.25 nm2). Hence, sulindac anions should be very close to one another to avoid steric constraint. Considering the angle between indene and phenyl rings (Fig. 1A) of about 44°,41 it is possible to have an eclipsed arrangement of sulindac ions as shown in Fig. S5, ESI,‡ similar to a bilayer arrangement of interdigitated sulindac anions.
The steric constrain can also be overcome by the co-intercalation of small ion such as chloride anion resulting in a decrease of the average surface area per unit charge for the interlayer species. This hypothesis is supported by the fact that for all M2Al–Sul samples, the values of sulindac/Al3+ molar ratio (as determined from chemical analysis and reported in Table 2) are below the expected value which is 1. Thus, we can reasonably assume a co-intercalation of Cl− anion. Actually the presence of chloride ion was confirmed by dissolving the LDH–Sul samples in HNO3 and adding AgNO3 solution. The formation of a white precipitate confirmed the presence of chloride in M2Al–Sul samples. Such co-intercalation was already uncovered for the accommodation of cumbersome guest molecule such as pravastatin.31
M2+/Al3+ | Sul/Al3+ | H2O/Al3+ | % Ca | % Ha | % Sa | Sul loading wt% | Proposed formula | |
---|---|---|---|---|---|---|---|---|
a wt%.b ( ) Values obtained based on the proposed formula. | ||||||||
Zn2Al–Sul 55 | (2.03)b | (0.94) | (2.22) | (35.34) | (3.67) | (4.72) | (52.28) | [Zn2.0Al(OH)6.0](C20H16O3FS)0.9Cl0.1·2.2H2O |
2.03 | 0.94 | 2.22 | 35.56 | 4.29 | 4.34 | 52.36 | ||
Zn2Al–Sul RT | (2.02) | (0.91) | (1.71) | (35.30) | (3.52) | (4.71) | (52.23) | [Zn2.0Al(OH)6.0](C20H16O3FS)0.9Cl0.1·1.7H2O |
2.02 | 0.91 | 1.71 | 34.90 | 4.32 | 4.26 | 52.33 | ||
Mg2Al–Sul 55 | (1.91) | (0.90) | (1.40) | (41.50) | (4.02) | (5.54) | (61.39) | [Mg1.9Al(OH)5.8](C20H16O3FS)0.9Cl0.1·1.4H2O |
1.91 | 0.90 | 1.37 | 39.21 | 4.93 | 4.77 | 61.30 | ||
Mg2Al–Sul RT | (1.87) | (0.72) | (1.40) | (37.61) | (3.77) | (5.02) | (55.64) | [Mg1.9Al(OH)5.8](C20H16O3FS)0.7Cl0.3·1.4H2O |
1.87 | 0.72 | 1.42 | 36.06 | 4.78 | 4.31 | 55.59 |
As mentioned before, chemical compositions given in Table 2 also reveal that the application of temperature during the co-precipitation reaction and the ageing step influence the sulindac content in Mg2Al–Sul and the hydration level degree of Zn2Al–Sul sample. The amount of drug incorporated into LDH host accounts for more than 50% by weight of all of the carrier material which is a very promising achievement for the application as a drug delivery system.
Compared to the results obtained by Minagawa et al.,30 we have improved the crystallinity and sulindac content of Mg2Al–Sul sample, which was prepared by the authors using different experimental conditions: coprecipitation at pH equal 8 and at room temperature, using nitrate metal salts as precursors. These data illustrated that modifications in the synthetic procedure can generate differences in the organic loading (an increase from 45 to 61 wt% of sulindac).
As already been reported elsewhere,53 besides being intercalated, the presence of exogenous species during the coprecipitation of LDH may also influence the textural properties of LDH products and one can obtain other morphologies than the hexagonal platelet and sand-rose aggregation typical of LDH materials (Fig. 6A and 6B).54 For instance, various particle sizes, morphologies, and aggregation types were obtained in presence of amino acids attributed to a template effect.55 In the present case, the effect is quite remarkable with curved Zn2Al–Sul crystals as evidenced by HAADF analysis (Fig. 6C and 6D). The same analysis was performed on Mg2Al–Sul samples but they were degrading during the imaging process, being more electron beam sensitive than the zinc analogue. This may be the reason why this atypical morphology was not reported by Minagawa et al.30
It is interesting to compare the coherence lengths as determined by XRD and the platelet dimensions observed by electron microscopy. As said before, the anisotropic peak broadening for Zn2Al–Sul 55 was modelled by a linear combination of spherical harmonics from which are then calculated the average apparent sizes in the directions corresponding to a given Bragg reflection. The average apparent diameter L110 and thickness L00l of Zn2Al–Sul 55 platelets have thus been obtained from the values determined in the directions normal to the 110 and 00l reflecting planes: L110 = 11.5 nm and L00l = 10.2 nm. The similarity we observe between the L00l coherence length and the platelet thicknesses obtained by electron microscopy is worth noting and indicates that particle size is probably the main source of the observed XRD peak broadening in the 00l direction. On the other hand, the in-plane dimensions of the particles measured by TEM are larger than the coherent length determined in the 110 direction (L110) and this can be explained by a non-coherent coalescence of domains due to microstrains or defects during crystal growth which occurs preferentially in the basal plane as already reported elsewhere.51
The distance between the parallel fringes in HAADF image for Zn2Al–Sul 55 (Fig. 6C) is 2.8 ± 0.3 nm which is in good agreement with the d003 value of 2.76 nm determined by XRD. It is also interesting to note that the number of parallel fringes observed on this HAADF image (i.e. about 5) is very close to the number of stacking layers one can calculate from the value of the coherence length in the stacking direction i.e. 3–4 (L00l/d003). Fig. 6D shows a nanoscroll of Zn2Al–Sul 55 where the walls consist of adjacent LDH layers containing sulindac.
The particles size and shape are very important factors to take into account when dealing with drug delivery systems. The internalization of nanoparticles by macrophage cells via phagocytosis for example, depends on the particles shape, size, and surface chemistry as well as the hydrophobic or hydrophilic character.56 Studies of cell-uptake and retention of the inorganic particles performed by Choy et al.57 have revealed that the ideal range for LDH particles size as drug carriers is about 100 to 200 nm. Xu et al.58 have shown that LDH particle morphology is also a very important parameter for uses in biological systems. For example, nanorods particles can access the nucleus cell while nanosheets remain in the cytosol. Particles size and morphology can also affect the manufacture of solid forms for oral administration such as tablets since these parameters are related with properties like flow, compactibility, and sticking.59
The assignments of the vibrational spectra of sulindac (protonated form) and sodium salt were performed based both on DFT calculations and data reported in the literature60 and are shown in Fig. S6, ESI,‡ and listed on Table 3. Sulindac structure can be decomposed in the following main groups: acetic acid, indene ring (i.e. benzene fused with a cyclopentene), methylene, phenyl ring and methylsulfinyl as shown in Fig. 1B. Fig. S6A and S6B, ESI,‡ show the experimental and calculated IR and Raman spectra respectively of the drug and its sodium salt. A good agreement was observed between experimental and theoretical spectra although the calculations were performed in gas phase and the measurements in solid state.
Sulindac calc. (without shift) | Sulindac calc.a (cm−1) | Sulindac experimentalb (cm−1) | Sodium sulindac calc. (without shift) | Sodium sulindac calc.a (cm−1) | Sodium sulindac experimental (cm−1) | Tentative attribution of main groups involved in the vibrationc | ||
---|---|---|---|---|---|---|---|---|
FT-Raman | FT-IR | FT-Raman | FT-IR | |||||
a Selected values in cm−1 obtained by functional/basis set B3LYP/6-31G**. The wavenumbers are shifted by 0.9742, according to the literature.61b Polymorph II.c νs = symmetric stretching, νas = antisymmetric stretching, δ = bending, ip = in plane; oop = out-of-plane, sh = shoulder; br = broad, w = weak. | ||||||||
1810 | 1762 | 1701 | ν(C![]() |
|||||
1670 | 1626 | 1623 | 1622 | 1668 | 1625 | 1626 | — | ν(C1![]() |
1652 | 1609 | 1616 | 1650 | 1607 | 1615 sh | — | ν(C![]() |
|
1638 | 1596 | 1602 | 1636 | 1594 | — | 1601 | ν(C![]() |
|
1627 | 1585 | 1589 | 1589 | 1626 | 1584 | 1590 | 1583 | ν(C![]() |
1622 | 1581 | 1616 sh | 1602 | ν(C![]() ![]() |
||||
1585 | 1544 | 1561 w | 1564 | νas(COO−) + δas(3-CH2) | ||||
1519 | 1479 | 1492 w | 1491 | 1519 | 1479 | 1490 w | 1489 | δip(CH) phenyl |
1500 | 1460 | 1469 | 1499 | 1460 | 1466 | δ(2-CH3) + ν(C![]() |
||
1462 | 1424 | 1416 | ν(C![]() |
|||||
1422 | 1392 | ν(C![]() |
||||||
1407 | 1370 | 1391 | 1394 br | ν(C–COO−) and δ(2-CH3) + δ(C10–H) | ||||
1393 | 1358 | 1368 | 1375 br | νs(COO−) + ν(C–COO−) + δipC(10-H) | ||||
1348 | 1314 | 1328 | ν(C![]() |
|||||
1347, 1297 | 1312, 1278 | 1271 | δip(OH) + ν(C–C) acetate | |||||
1314 | 1280 | 1285 | ν(C![]() |
|||||
1299 | 1265 | 1276 sh | 1276 | δs(3-CH2) + δip(CH) indene | ||||
1227 | 1195 | 1211 | 1211 w | 1228 | 1195 | 1208 | δip(CH) indene + δip(CH) phenyl + δas(3-CH2) + δ(C10–H) | |
1214 | 1183 | 1181 sh | 1196 | ν(C–F) + δas(3-CH2) + δip(CH) indene | ||||
1202 | 1170 | 1157 w | δ(3-CH2) acetate | |||||
1196 | 1166 | 1157 | ν(C–F) + δ(CH2) acetate | |||||
1176 | 1146 | 1163 | ν(C–F) + δas(3-CH2) + δip(CH) indene + δ(2-CH3) | |||||
1158 | 1129 | 1137 | 1134 | δip(CH) indene + δ(2-CH3) | ||||
1148 | 1119 | 1134 | δ(3-CH2) + δ(OH) + δ(2-CH3) + δip(CH) indene | |||||
1085 | 1057 | 1089 | 1088 | 1085 | 1057 | 1089 | 1089 | ν(C14–S) + δip(CH) phenyl + δip(CH) + δ(2-CH3) indene |
1039 | 1013 | 1018 | 1020 | 1038 | 1011 | 1039 br | ν(S![]() |
|
1028 | 1002 | 1007 | 1028 | 1002 | 1021 | 1011 br | ν(S![]() ![]() |
|
968 | 944 | 967 | 966 | 942 | 958 | δas(CH3) + δoop(CH) phenyl | ||
940 | 916 | 921 | δ(3-CH2) + δ(COO−) | |||||
909, 889, 871 | 886, 867, 849 | 879 | 892 | 908, 889, 869 | 884, 866, 847 | 869 br | 864 br | δoop(C10–H) + δoop(CH) phenyl + ν(CH) indene ring + δs(2-CH3) + δ(C–F) |
671, 687 | 654, 668 | 662 br | δ(COO−) + δ(2-CH3) + δ(3-CH2) + δoop(C10–H) | |||||
686 | 670 | 636 | δoop(O–H) | |||||
Fig. 7 displays the FT-IR and FT-Raman spectra of M2Al–Sul 55 samples and also the spectrum of sodium sulindac for comparison purposes. Vibrational spectra of the drug intercalated into LDH layers are equivalent to that of sodium sulindac. Thus, the attribution proposed for the bands of the hybrid materials are the same as for sulindac salt shown in Table 3. The values of bands assigned to νasCOO− and νsCOO− in the spectra of M2Al–Sul 55 samples are close to that of NaSul (Fig. 7A) indicating that sulindac is interacting as a free ion with the inorganic layers (i.e. sulindac is no coordinated/grafted to LDH hydroxide layer). Only the bands ascribed to COO− stretching in FT-IR and COO− bending in FT-Raman spectra show slight modification in their profiles when compared to sodium sulindac consistently with its interaction with LDH hydroxide layer as proposed in Fig. 4. FT-IR spectra of M2Al–Sul samples are not well-defined in the 1000–400 cm−1 range because of the absorption of LDH framework in this region.60 On the other hand, FT-Raman spectra of hybrid samples show the bands exclusively related to the drug since the inorganic matrix presents bands of very low intensity in the recorded range (1800–300 cm−1).62 It is noticed the absence of a band at about 1056 cm−1 assigned to carbonate ions, a common contaminant species present in LDHs samples.
![]() | ||
Fig. 7 FT-IR (transmittance mode, top) and FT-Raman spectra (bottom) of M2Al–Sul 55 samples and sodium sulindac salt. |
Solid state 13C-NMR spectra of M2Al–Sul samples and the pristine drug were also recorded to confirm the chemical stability of the drug after intercalation and to investigate local interactions with LDH host. Fig. S7, ESI,‡ shows the experimental and calculated NMR spectra of pristine sulindac; all experimental and calculated chemical shifts provided by DFT method are listed in Table 3. A good linear correlation between experimental and the DFT calculated 13C chemical shift values is seen in Fig. S8, ESI.‡ A small displacement of the theoretical chemical shift values is observed in other works63,64 and can be related to the fact that our simulation considered the drug molecule in the vacuum.
It is well known in the literature that the DFT calculations for fluorocompounds are still a theoretical challenge.65 In particular, the resonance peak of carbon–fluorine (carbon C5 in the present case) is split in the experimental spectra (164.2 and 160.9 ppm) whereas it presents only a single value in the theoretical calculations. Furthermore, a general movement of the peaks is caused by the presence of fluorine. These features can be observed in Fig. S7, ESI.‡ To correct or minimize the shift of the calculated values in relation to the measurements, Gryff-Keller et al.65 suggest considering a simple scaling procedure where the experimental data are linearly fitted to the theory. Nevertheless, since there is no consensus in the literature about this approach for analysing the data, and because the origin of the experimental/theoretical discrepancy is known to be due to the presence of the fluorine atom, this re-scaling was not applied here.
Table 4 presents the assignment of sulindac, sodium sulindac and the M2Al–Sul materials based on chemical shifts provided by DFT method and considering the results reported by Douglas66 for sulindac, its sodium salt and analogous molecules in DMSO solution and CDCl3. Experimental and calculated data show that deprotonation of sulindac molecule promotes mainly the chemical shift of carbon atoms of acetic acid group (deshielding of C19, C18) and indene ring (C3, C4, C7, C8); the atoms less affected by the drug ionization are the carbon atom linked to fluorine (C5) and carbon atoms of phenyl ring (C12, C13, C15, C16). After deprotonation, the peaks assigned to C4 (103.4 ppm) and C6 (108.9 ppm) are joined in a single one at 107.7 ppm. This behaviour was foreseen by DFT calculation (Table 4). Peak signals of C8 and C14, attributed to the same peak (146.4 ppm) to the protonated form, are split in the sulindac salt to 149.4 ppm and 144 ppm (a shoulder), respectively (Fig. 8). According to Douglas,66 C8 and C14 appears as distinctive peaks in solution and are more separated in the salt form.
Assignment | Sul calc.a | Sul exp. | SulNa calc.a | SulNa exp. | Zn2Al–Sul 55 exp. | Mg2Al–Sul 55 exp. |
---|---|---|---|---|---|---|
a Calculated by DFT method. | ||||||
C17 | 12.3 | 7.8 | 12.6 | 10.2 | 10.2 | 10.1 |
C18 | 33.8 | 32.7 | 38.6 | 36.1 | 35.9 | 35.8 |
C20 | 48.2 | 41.7 | 48.4 | 42–44.2 | 42.9 | 42.9 |
C4 | 111.5 | 103.4 | 113.3 | 107.7 | 105.7 | 105.7 |
C6 | 115.0 | 108.9 | 113.4 | 107.7 | 109.9 | 109.9 |
C7 | 127.6 | 124.3 | 126.7 | 122.2 | 124.5 | 124.5 |
C15 | 127.5 | 124.3 | 127.2 | 124.6 | 124.5 | 124.5 |
C13 | 129.0 | 124.3 | 128.6 | 124.6 | 124.5 | 124.5 |
C10 | 137.8 | 127.8 | 134.6 | 129.3 | 127.0 | 126.9 |
C9 | 134.0 | 128.7 | 134.8 | 129.3 | 130.0 | 129.9 |
C16 | 134.4 | 130.2 | 134.4 | 129.3 | 130.0 | 129.9 |
C12 | 135.7 | 130.2 | 135.8 | 129.3 | 130.0 | 129.9 |
C3 | 139.7 | 130.2 | 146 | 137.4 | 133.9 | 133.9 |
C2 | 144.1 | 138.1 | 141.4 | 137.4 | 137.8 | 137.7 |
C11 | 144.5 | 139.5 | 145.8 | 137.4 | 140.5 | 140.5 |
C1 | 148.9 | 141.6 | 150.3 | 142.8 | 140.5 | 140.5 |
C14 | 158.3 | 146.4 | 156.6 | 144 sh | 145.3 | 145.2 |
C8 | 150.4 | 146.4 | 152.3 | 149.4 | 148.4 | 148.3 |
C5 | 173.5 | 160.9 | 173.5 | 161.2 | 161.8 | 161.6 |
C5 | 164.2 | 164.6 | 164.9 | 164.9 | ||
C19 | 175.3 | 174.9 | 187.5 | 179.2 | 179.7 | 179.5 |
![]() | ||
Fig. 8 Experimental solid state 13C-NMR spectra of sulindac, sodium sulindac and M2Al–Sul 55 samples. |
Comparing the map of electric charge density calculated by DFT for sulindac and its deprotonated form (Fig. S9, ESI‡), a significant decrease of electronic density is observed in the acetic and indene ring regions. The charge density on sulfinyl group also decreases after sulindac deprotonation which can justify the C14 shift from 146.6 to about 144 ppm. Although the vibrational spectroscopic data have shown minor differences between sodium sulindac and M2Al–Sul spectra, NMR technique seems to be more sensitive to the intercalation process than FTIR measurements. Fig. 8 reveals a sharp shift of a few peaks after intercalation i.e. C4 (107.7 to 105.7 ppm), C3 (from 137.4 to 133.9 ppm), C1 (from 142.8 to 140.5 ppm), and C14 (from about 144 to 145.2 ppm). Furthermore, the chemical shifts of the related peaks are intermediate between the peaks of the protonated and deprotonated sulindac forms. As often observed in O/I LDH assemblies, 13C-NMR data succeed in unravelling the change in the electronic environment of the chemical function electrostatically linked to the inner-surface of the LDH layer, in particular a rather strong deshielding effect of C19. As for other molecules presenting strong electronic delocalization,67 the overall effect is transferred to the whole backbone, resulting in a modification of the sulindac charge density.
One advantage of organic species intercalation into carriers as LDH is the increase of the thermal stability of the guest species. In the case of drug intercalation, the improvement in its thermal property can be translated in a longer shelf life. With this idea in mind, the thermal behaviour of sulindac and sodium sulindac were compared to those of the intercalated M2Al–Sul samples under air atmosphere. TG-DSC and DTG-MS curves of sulindac drug (Fig. 9) show a melting endothermic event at 190.5 °C. The thermal decomposition of sulindac starts at about 200 °C and occurs in main three steps with release of m/z fragments assigned to water and carbon dioxide molecules (DTG peak at 270 °C), water and sulphur dioxide (DTG peak at 361 °C), and H2O, CO2 and SO2 (DTG peak at 596 °C). A fragment related to fluorine atoms (m/z = 19) was observed with a very low intensity above 500 °C. As it is expected, no residue was noticed for temperature above 1000 °C under air atmosphere. The onset temperature for sodium sulindac decomposition (and CO2 release) is about 170 °C (DTG peak at 228 °C). The thermal behaviour of the salt is similar to sulindac (protonated form) (Fig. 9) but a residue of about 8.3 wt% is observed due to Na2O formation. Considering the results of thermal analysis data, the composition of sodium sulindac is NaSul·H2O (or C20H16FO3SNa·H2O).
![]() | ||
Fig. 9 TG-DSC and DTG-MS curves of sulindac, sodium sulindac, Mg2Al–Sul 55 and Zn2Al–Sul 55 samples from top to bottom. Inserts: photos of respective samples heated at 250 °C under dynamic air flow. |
M2Al–Sul materials contain ca. 5–6 wt% of adsorbed and intercalated water molecules which are released from room temperature to 200 °C for Mg2Al–Sul 55 and up to 160 °C for Zn2Al–Sul 55 sample (Fig. 9). After the dehydration step, the thermal process differs depending on LDH host composition: while Zn2Al–Sul 55 material releases water molecules (DTG peak at 196 °C), Mg2Al–Sul 55 sample liberates both water and CO2 molecules (DTG peak at 246 °C). This contrasting behaviour seems to have an effect on the thermal stability of intercalated sulindac species. The insert in Fig. 9 shows pictures of hybrid samples heated at 250 °C under air flow. Surprisingly, Zn2Al–Sul 55 material keeps its yellow colour while the magnesium derivative is pale brown suggesting a partial decomposition of sulindac. It is known that zinc–aluminium LDH is usually less stable regarding to dehydroxylation process than magnesium–aluminium LDH.68,69 To clarify this point, Fig. S10 (ESI‡) shows the TG-DTG-MS curves of M2Al–Cl 55 (M = Mg2+ or Zn2+) samples.
Usually, MgRAl–Cl samples undergo dehydroxylation process at about 300 °C and dehydrochlorination above 350 °C.70,71 Mg2Al–Cl 55, synthetized in the same experimental conditions that Mg2Al–Sul 55, starts releasing water molecules from dehydroxylation reaction at about 240 °C (with two events on DTG curve at 358 and 423 °C) and a MS fragment of m/z = 36 measured at 400 °C and assigned to H35Cl (Fig. S10A, ESI‡). The mass loss observed for ZnRAl–Cl samples at temperature values above 200 °C is ascribed to the layers dehydroxylation.72 Zn2Al–Cl 55 sample isolated in this work undergoes two water release events in the 190–260 °C range with DTG peaks at 215 and 275 °C (Fig. S5B, ESI‡), confirming that the zinc LDH matrix has a lower thermal stability than the magnesium analogous. Hence, the events observed at 196 °C and 246 °C respectively can be attributed to the dehydroxylation of Zn2Al–Sul 55 and Mg2Al–Sul 55 materials (Fig. 9).
The hydroxylation process decreases the coordination number of zinc ions opening up free sites for new linkages. Having in mind that some carboxylates species intercalated into ZnRAl–LDH can be coordinated to the metal under thermal treatment at 120 °C,73 it is reasonable to suggest that the Zn2Al–Sul 55 dehydroxylation (DTG peak at 196 °C) promotes the sulindac coordination to the metal ion through carboxylate group. This new bonding could stabilize the organic species face to reactions as decarboxylation for example. To shed light on this proposal, FT-IR and Raman spectra of M2Al–Sul 55 samples were recorded after heating the original samples up to 250 °C, under air atmosphere, in the TGA equipment (Fig. S11, ESI‡).
The vibrational bands modified after heating are highlighted in the spectra and can be mainly assigned to acetate group and the indene ring, which vibrational modes proposed by DFT calculation are displayed in Fig. S12, ESI.‡ FT-IR spectrum of Mg2Al–Sul 55 material heated at 250 °C shows a decrease of the intensity of the bands at 1558 and 1380 cm−1, both attributed to antisymmetric and symmetric stretching of COO− group, respectively, and also the band at 918 cm−1, assigned to bending of 3-CH2 and COO− groups, suggesting a decarboxylation process. Consistently the MS curve shows CO2 release at about 230 °C (Fig. 9). The indene ring bands have their intensities decreased or shifted (1466, 1196, 1163 and 1135 cm−1). Although MS curve of Mg2Al–Sul 55 material shows SO2 release above 500 °C, the heating step at 250 °C promotes alteration in the methylsulfinyl and phenyl groups since the band at 1045 cm−1 attributed to ν(SO) + δip(CH) phenyl + δCH3 methylsulfinyl is modified. Raman spectrum of magnesium LDH hybrid after the thermal treatment shows only few bands confirming the materials decomposition.
The modifications observed for 1558 (νasCOO−) and 1380 cm−1 (νsCOO−) bands in the FT-IR spectrum of heated Zn2Al–Sul 55 material are different from those observed for Mg2Al–Sul 55 (Fig. S11A, ESI‡). Although the bands are broad in the 1600–1500 cm−1 region, one can say that band at 1558 cm−1 seems to be shift to higher wavenumber for Zn2Al–Sul 55, with a more important separation between νas and νs values (Δ > 178 cm−1), suggesting a COO− linkage to metal ion in monodentate coordination.74 To clarify this point, Zn2Al–Sul 55 sample was also heated up to 120 °C (dehydration step) and 190 °C (dehydroxylation process), and their FTIR spectra are shown in Fig. S13, ESI.‡ As can be notice, dehydration event promotes the shift of band at 1045 cm−1 (assigned to ν(SO) + δip(CH) + δ(CH3) phenyl) to 1033 cm−1. Hence it is inferred that water molecules interact mainly with sulfinyl polar groups in the interlayer domain. No other modification is observed when sample is heated at 120 °C. On the other hand, 1600–1500 cm−1 region is affected when Zn2Al–Sul 55 is heated at 190 °C, suggesting that layers dehydroxylation event can afford modifications in the sulindac carboxylate environment.
The indene band intensity at 1466 cm−1 is not decreased in the spectrum of Zn2Al–Sul 55 sample heated up to 250 °C (Fig. S11A, ESI‡), suggesting that the organic species are less decomposed than in Mg2Al–Sul 55 matrix. Raman spectrum of Zn2Al–Sul 55 sample heated at 250 °C is well defined consistently with the higher thermal stability of the drug intercalated into Zn2Al than Mg2Al (Fig. S11B, ESI‡). Alterations are also noticed for bands at 918, 669 and 600 cm−1 that are involved with bending of COO− group (Fig. S12, ESI‡). Summing up, the dehydroxylation process of Zn2Al–Sul 55 should promotes the partial coordination of sulindac carboxylate group, enhancing its thermal stability.
The kinetic curve profiles of M2Al–Sul 55 samples consist in two mainly different zones with different delivery patterns indicating a bimodal or biphasic release. This release behavior seems to be typical of LDH–drug systems as stated in the review paper published recently by Rives et al.10 Six kinetic models (zero order, first order, Korsmeyer–Peppas,75,76 Hixson–Crowell,77 Bhaskar,78 and parabolic diffusion model79–81) were tested to fit the drug release curves (Fig. S14 and S15, ESI‡). As judged from the value of the linear correlation coefficients (R2), the best results were obtained with the Hixson–Crowell model for pristine sulindac (Fig. 10C) while Higuchi (Fig. 10E) model give better fits for M2Al–Sul 55. Hixson–Crowell model assumes a drug dissolution and a modification of the shape with time consistently with our observations for sulindac. As mentioned in ESI,‡ Higuchi model presumes a Fickian diffusion as the delivery rate limiting step (diffusion controlled model).
Most of drug delivery tests carried out with LDH were performed with powdered samples in suspension. LDH–drug samples were here used in tablet form (pressed powder) since biological tests are commonly carried out with delivery systems in the compacted form. The exposed external surface is less important with tablets than with suspended samples. Rojas et al.82 have studied anti-inflammatory molecules intercalated into Mg2Al–LDH in a compressed form and observed a slow release due to longer diffusion path. For example, ketoprofen release from the Mg2Al–LDH matrix reaches only 45–50% after 25 h of contact time.
Based on this modelling study, the release of sulindac from LDH matrix can be decomposed in three main steps: (i) diffusion of anionic ions as chloride and phosphate from the buffer solution into the aggregates reaching the interparticle spaces among primary particles (Fig. 6A), (ii) ion–exchange reaction in the liquid/solid interface involving basal and internal surfaces of primary LDH particles (Fig. 6C); (iii) diffusion of sulindac ion from the interparticle spaces up to the buffer solution. As shown before, Zn2Al–Sul 55 particles comprise 5–6 interlayers (Fig. 6C); thus the estimated percentage of basal (or external) area is about 15–20% of the total area (basal plus internal surface). Considering a monophasic release behaviour for LDH–Sul sample in the first 24 h with 70% of the drug released (Fig. 10A and B), the release of sulindac present at the basal surfaces is not enough to explain such quantity; intercalated drug should also contribute to the first step of release. One has to note a rapid burst release at much shorter time (t < 1 h, slop almost parallel to y-axis). It corresponds to about 10% of release probably due to surface effect, as mentioned above. The kinetic curves of M2Al–Sul samples fit well Higuchi model in the 0–24 h time range that presumes a drug concentration gradient in the solid/liquid interface fluid following the Fick law, and the matrix is not dissolved or weathered.83
In order to get more information about the sulindac release process, M2IIAl–Sul 55 tablets were isolated after 6 h (about 35% of release) and 24 h (about 70% of release) contact time for structural analysis by XRD (Fig. S16, ESI‡). After 6 h, M2IIAl–Sul 55 samples keep their initial XRD profiles and no new peaks (that could be attributed to crystalline phosphate, chloride or LDH interstratified phases) are observed. The peaks of magnesium–aluminium sample are broad and weak indicating a decrease of the size of the coherent domains due to a strong disorder and/or a decrease of the particles size. XRD signals of M2Al–Sul 55 samples after 24 h (about 70% of release) are very broad; the 011 peak practically is not changed indicating that layers are preserved up to 24 h, thus underlining a topotactic driven mechanism.
The amount of metal cations in solution was quantified by ICP OES technique to check whether the LDH carrier was partially dissolved in the delivery experimental conditions (pH value of 7.2 and 37 °C). All metal quantification data are summarized on Table 5. The aluminium amount in solution after 6 h of sulindac delivery from Zn2Al–Sul tablet is below the method detection limit (MDL) while after 24 h and 56 h of reaction it is below the limit of quantification (MQL). The amount of zinc in solution after 6 h of contact time is below the MDL but after 24 h and 56 h it corresponds to 0.48% and 0.59% of the metal in the pellet before the delivery process, respectively.
Material | Metal concentration in solution after 6 hours (mg L−1) | Metal concentration in solution after 24 hours (mg L−1) | Metal concentration in solution after 56 hours (mg L−1) | ||||||
---|---|---|---|---|---|---|---|---|---|
Al | Zn | Mg | Al | Zn | Mg | Al | Zn | Mg | |
a Below the method detection limit (MDL = 0.01 mg L−1).b Below the method quantification limit (MQL = 0.05 mg L−1).c Percentage in weight of metal in the pellet before the delivery reaction. | |||||||||
Zn2Al–Sul 55 | a | a | b | 0.15 (0.48%)c | b | 0.19 (0.59%) | |||
Mg2Al–Sul 55 | b | 1.93 (13.2%) | b | 4.20 (28.8%) | 0.26 (3.46%) | 5.96 (40.8%) |
For the delivery assays with Mg2Al–Sul 55 sample, the amount of aluminium present in solution is 3.46% of that one initially in the pellet after 56 h of contact time. The concentration of magnesium in solution past 6 h, 12 h and 56 h are 13.2%, 28.8% and 40.8%, respectively. The magnesium amount is not changed significantly after 56 h (45% after 86 h).
The solubility of Mg, Zn and Al metals from the M2Al–Sul 55 tablets are closely related to the solubility product constants of their hydroxide compounds (Ksp of Al(OH)3 = 1.0 × 10⁻³³, Zn(OH)2 = 2.0 × 10⁻¹⁷ and Mg(OH)2 = 1.1 × 10⁻¹¹).84 The very high level of Mg leaching from LDH layers compared to Al and Zn do not affect the sulindac release since the kinect curves for Zn2Al–Sul and Mg2Al–Sul 55 showed in Fig. 10A are very similar in all observed range time suggesting that that Mg solubilization occurs from the surface to the inner part of the tablet as well as the ion exchange front of sulindac. Fig. S17 (ESI‡) shows the Raman spectra of different regions of a cross section of the Mg2Al–Sul 55 tablet after 24 h in buffer solution. As it is expected, the intensity of sulindac bands monitored at the external surfaces of the tablet is very lower compared to the spectra recorded at the central regions of the tablet (similar results were obtained for Zn2Al–Sul 55 tablet). Hence the sulindac kinect curve is no affected by the magnesium leaching probably because of the metal solubilization occurs after the drug exchange. As can be noticed from data in Fig. 10A and Table 5 data, after 6, 24 or 56 h, the percentage of sulindac delivery to the buffer solution is higher than the magnesium percentage leached from the tablets. Maybe a different result could be obtained if working with powder suspensions (i.e. after a reaction time interval, the drug release could occur because the LDH layers solubilization).
The XRD profile for both samples after 56 h shows only a broad peak assigned to 110 plane (data not shown) while Raman spectra present very low intensity bands of sulindac (1620–1590 cm−1) and new ones at 980–995 cm−1 assigned to phosphate ions (chloride ions can also be present but are not detected by vibrational spectroscopy).
The delivery data reported in this work are no straightforward compared with those reported in the literature obtained with other carriers and with different experimental conditions. Among the studies performed on the mechanism of sulindac delivery from organic matrices, Yegin et al.85 studied calcium alginate beads and proposed a sulindac release by on diffusion and also the polymer surface erosion at pH 6.8 (phosphate buffer).
All isolated samples award more than 50% by weight of sulindac drug, an expressive result to drug carriers. The particles average size of both hybrid materials are in the nanometer scale according to XRD and electron microscopy data. The presence of sulindac during LDH layers formation has an important influence on the particles morphology. The number of stacking layers is about 3–5, indicating very thin particles (ca. 10 nm) that, for Zn2Al–Sul 55 sample, certainly promotes the particle's curling. Although the coiling of exfoliated layered materials is usually observed, such kind of nanoscroll structure has not been observed so far for layered double hydroxides. The particles morphology of drug carriers is of pharmaceutical technology interest and also of biological concern, given that nanoparticles and membranes interactions for example are dependent of particle shape too. As shown by complementary spectroscopic techniques (IR, Raman and 13C-NMR), the intercalation process used in this work to confine sulindac into LDH carrier preserves the drug chemical structure.
Thermal behaviour of magnesium and zinc–LDHs hybrids are distinctive owing to the lower stability of the last matrix. Vibrational spectroscopy supported by DFT calculation has shown that the main modifications in the sulindac structure after heating concern the carboxylate group. As observed for other zinc–aluminium materials intercalated with carboxylic acid derivatives, the layers dehydroxylation can create free sites in the metals coordination sphere that promotes the carboxylate group coordination. This reaction can explain the higher thermal stability of sulindac intercalated into Zn2Al–LDH than into Mg2Al–LDH. The study of influence of the coordination (or grafting) process in the drug delivery kinetics will be investigate in a forthcoming study.
Confinement of sulindac between the layers decreases the delivered amount in ca. 50% compared to free drug after 12 h of contact time, when using the carrier system in tablet form (pressed powder) and at pH 7.2. The in vitro delivery mechanism for both hybrid samples in the 0–24 h can be described by Higuchi model indicating a Fickian diffusion controlled process. Sulindac release is followed by magnesium ions leaching. After 24 h, about 28% of Mg2+ ions from de pellets are dissolved in the phosphate buffer while metals leaching from zinc–aluminium sample is not significant. As notice about the materials properties such crystallinity, morphology and thermal stability, the chemical composition of LDH layers also change the materials stability and dissolution process in simulated biological fluid.
Footnotes |
† Dedicated to Professor Thomas J. Pinnavaia on the occasion of his retirement. |
‡ Electronic supplementary information (ESI) available: DSC and XRD data of sulindac, XRD data of LDH–Sul samples prepared at room temperature, experimental and calculated IR and Raman spectra of protonated sulindac and sodium sulindac, solid state 13C-NMR spectra of sulindac and sodium sulindac, TG-DTG-MS curves of Mg2Al–Cl 55 and Zn2Al–Cl 55 samples, experimental IR and Raman spectra of heated M2IIAl–Sul 55 samples, sulindac vibrational modes obtained by DFT calculations, kinetic models applied to M2IIAl–Sul 55 samples, XRD patterns of M2IIAl–Sul 55 tablets after 6 and 24 h in buffer solution, Raman spectra of M2IIAl–Sul 55 tablet after 24 h in buffer solution. See DOI: 10.1039/c5ra25814f |
This journal is © The Royal Society of Chemistry 2016 |