A facile hydrothermal synthesis of a reduced graphene oxide modified cobalt disulfide composite electrode for high-performance supercapacitors†
Guijing
Liu
,
Bo
Wang
*,
Lei
Wang
,
Yuhe
Yuan
and
Dianlong
Wang
*
Harbin Institute of Technology, School of Chemical Engineering and Technology, Xidazhi Street, 150001 Harbin, China. E-mail: wangdianlonghit@163.com; wangbo19880804@163.com; Fax: +86 45186413721; Tel: +86 451 86413751
First published on 28th December 2015
Abstract
In this study, a 3D reduced graphene oxide modified CoS2 composite electrode (CoS2/RGO) is synthesized by a facile hydrothermal approach. The dimensions of the CoS2 nanoparticles in CoS2/RGO are effectively reduced due to the geometric confinement of RGO, and a novel, large-scale wave-like structure is formed. This leads to an enlarged specific surface area and improved conductivity and could thus be favourable for both fast electron and ion transport. As a consequence, CoS2/RGO displays better electrochemical properties than the pure individual components. When the mass ratio of CoCl2·6H2O and GO as the raw materials is 1![[thin space (1/6-em)]](https://www.rsc.org/images/entities/char_2009.gif) :
:![[thin space (1/6-em)]](https://www.rsc.org/images/entities/char_2009.gif) 2, the obtained CoS2/RGO composite electrode (CoS2/RGO-2) delivers the highest capacitance of 930.3 F g−1 at 2 A g−1 and retains a capacitance as high as 677.9 F g−1 as the current density increases up to 20 A g−1. Moreover, in order to obtain high energy and power densities, a high-voltage asymmetric supercapacitor has been designed and constructed using the optimized CoS2/RGO-2 composite electrode as the positive electrode and activated carbon (AC) as the negative electrode material. Such a device with an operational voltage of 1.6 V can achieve a remarkable energy density of 45.7 W h kg−1 at a power density of 797.0 W kg−1, in addition to the superior rate capability and prominent stability towards long time charge–discharge cycles.
2, the obtained CoS2/RGO composite electrode (CoS2/RGO-2) delivers the highest capacitance of 930.3 F g−1 at 2 A g−1 and retains a capacitance as high as 677.9 F g−1 as the current density increases up to 20 A g−1. Moreover, in order to obtain high energy and power densities, a high-voltage asymmetric supercapacitor has been designed and constructed using the optimized CoS2/RGO-2 composite electrode as the positive electrode and activated carbon (AC) as the negative electrode material. Such a device with an operational voltage of 1.6 V can achieve a remarkable energy density of 45.7 W h kg−1 at a power density of 797.0 W kg−1, in addition to the superior rate capability and prominent stability towards long time charge–discharge cycles.
Introduction
The development of energy storage devices with high energy and power outputs, long lifetimes, and short charging times is quite significant and desirable for use in many important areas such as plug-in electric vehicles, overnight power storage and energy storage for wind and large industrial equipment.1–3 Supercapacitors are among the most important types of energy storage devices and have received tremendous attention due to their many features, which include a high power density, long cycle life, fast charge/discharge rate, and safe operation mode compared to traditional batteries.4–6 However, the current commercial supercapacitors usually suffer from relatively lower energy densities as compared to rechargeable lithium batteries and fuel cells, and this has seriously restricted their practical applications.7,8 Consequently, from the viewpoint of future practical applications, advanced high-performance supercapacitors have to be further developed with higher energy densities without significantly sacrificing on power delivery and cycle life.2,8 More recently, asymmetric supercapacitors that perfectly incorporate the advantages of both Li-ion batteries and supercapacitors with enhanced energy densities have been considered attractive. The attractive features of the asymmetric configuration lie in the greatly improved specific capacitance arising from the pseudocapacitive electrode and the wide operation voltage, which favor a significantly increased energy density. Moreover, it has been well established that the electrochemical performance of such devices is directly affected by the properties and structures of the chosen electrodes and electrode materials. The main challenge to fabricating high-energy density asymmetric supercapacitors still lies in the selection and exploitation of advanced electrodes and electrode materials.With the purpose of enhancing the electrochemical performance of the asymmetric supercapacitor, numerous efforts have been devoted to investigating extensively pseudocapacitive transition metal oxides, hydroxides, chalcogenides and conducting polymer materials. These can in principle offer higher specific capacitance and superior energy densities than typical carbonaceous materials with electric double layer capacitance.9–11 In recent years, considerable research efforts have been devoted to preparing metal sulfides, including MoS2,12 WS2,12,13 CoS14 and VS2,15 which show superior electrochemical performances as electrode materials for supercapacitors. One important type of transition metal chalcogenides for potential application in supercapacitors, lithium-ion batteries, alkaline rechargeable batteries, magnetic materials and catalysts are cobalt sulfides, including CoS2, Co3S4, CoS and Co9S8, due to their excellent physical, chemical, electronic and optical properties.16–20 In particular, cobalt disulfide (CoS2), a key member of the semiconductor family, has been considered as one of the most promising materials for great potential applications in supercapacitors21 due to its high redox activity as well as multiple convertible valence states.22 However, previous attempts to fabricate supercapacitors based on CoS2 or/and CoS2/carbonaceous materials have encountered several major problems such as relatively low capacitance,22,23 poor cycling stability11 and rate capability.24 The main causes for the unsatisfying performance can be attributed to the following four main aspects.25,26 (1) The single CoS2 component is intrinsically unstable. (2) The use of insulating polymer binders has an adverse effect on the electric conductivity of the fabricated electrode. (3) The traditional strategy of coating the slurry layer onto the electrode in general leads to the peeling of active material during cycling (4) random assembly of CoS2 is not favorable for electron conduction during electrode reactions. Therefore, an effective synthesis strategy for direct growth of the CoS2 active material on a conductive support to fabricate an integrated electrode has great potential to simultaneously resolve the abovementioned problems, and thus, drastically improve its electrochemical performance.
In this study, a facile hydrothermal approach for in situ growth of CoS2 combined with reduced graphene oxide (RGO) on a Ni foam support to fabricate an integrated composite electrode (CoS2/RGO) has been reported. Such a method could effectively enhance the specific capacitance of the product due to the spatial confinement of graphene and the synergetic effect between the CoS2 component and the graphene component.27 The influence of the mass ratios of CoS2 and RGO in the composite electrode on the electrochemical performance has also been systematically investigated by tuning the addition of the raw materials. The test results showed that CoS2 was uniformly wrapped by RGO sheets to form a novel large-scale wave-like structure on the surface of the Ni foam. Such a binder free, highly conductive and structure optimized CoS2/RGO electrode exhibited a high specific capacitance of 930.3 F g−1 at 2 A g−1. In addition, a high performance asymmetric supercapacitor was successfully fabricated using the optimized CoS2/RGO composite electrode as the positive electrode and activated carbon (AC) electrode as the negative electrode, which exhibited excellent rate capability (70.8% retention at initial current density of 1 A g−1), high energy density (45.7 W h kg−1), and superior cycling ability (∼90% after 6000 cycles).
Experimental
Materials preparation
All materials were of analytical grade and were used without further purification. Graphite oxide (GO) was synthesized by an improved Hummers' method, as reported previously.28 The CoS2/RGO composite electrode was prepared by a facile hydrothermal process, as illustrated in Scheme 1 (on the left). First, the Ni foam substrate (1 × 1 × 0.1 cm) was pretreated with 6 M HCl, deionized (DI) water and ethanol to remove the NiO film and impurities from its surface. Second, an appropriate amount of GO was dispersed into 35 ml DI water and 35 ml ethanol by ultrasonication for 2 h to obtain a homogeneous exfoliated GO solution. Third, 2 mmol CoCl2·6H2O and 2 mmol Na2S2O3·5H2O were added into the GO solution. Finally, the reaction mixture and Ni foam were transferred to a Teflon-lined autoclave and hydrothermally treated at 150 °C for 10 h. After washing with water and ethanol several times followed by drying, the CoS2/RGO composite electrode was obtained. For comparison purposes, the pure CoS2 electrode was also prepared by a similar hydrothermal method without GO.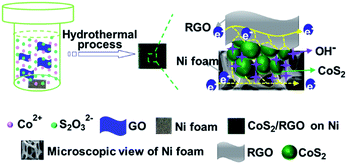 | ||
| Scheme 1 Schematic of the synthetic process (left) and structure (right) of the CoS2/RGO composite electrode. | ||
For further detailed experiments, the mass ratios of CoCl2·6H2O and GO were controlled at 1![[thin space (1/6-em)]](https://www.rsc.org/images/entities/char_2009.gif) :
:![[thin space (1/6-em)]](https://www.rsc.org/images/entities/char_2009.gif) 0, 1
0, 1![[thin space (1/6-em)]](https://www.rsc.org/images/entities/char_2009.gif) :
:![[thin space (1/6-em)]](https://www.rsc.org/images/entities/char_2009.gif) 1, 1
1, 1![[thin space (1/6-em)]](https://www.rsc.org/images/entities/char_2009.gif) :
:![[thin space (1/6-em)]](https://www.rsc.org/images/entities/char_2009.gif) 2 and 1
2 and 1![[thin space (1/6-em)]](https://www.rsc.org/images/entities/char_2009.gif) :
:![[thin space (1/6-em)]](https://www.rsc.org/images/entities/char_2009.gif) 3, and the as-prepared composite electrodes were named CoS2, CoS2/RGO-1, CoS2/RGO-2 and CoS2/RGO-3, respectively. The mass loading of the active material on Ni foam was about 1.5 mg.
3, and the as-prepared composite electrodes were named CoS2, CoS2/RGO-1, CoS2/RGO-2 and CoS2/RGO-3, respectively. The mass loading of the active material on Ni foam was about 1.5 mg.
Characterization
The crystal structures of the products were characterized by X-ray diffraction (XRD) analyses using a D/max-γB X-ray diffractometer (Rigaku, Japan) with a Cu Kα source. Raman spectra were obtained using a Raman spectrometer (Renishaw in Via, Germany) under laser excitation at 532 nm. The Brunauer–Emmett–Teller (BET) nitrogen adsorption measurements were obtained on a Micromeritics ASAP 2020 Surface Area and Porosity Analyzer (Micromeritics, Norcross, GA, USA). Morphologies and sizes of as-prepared samples were obtained by field-emission scanning electron microscopy (FESEM, Hitachi SU8000, Japan), transmission electron microscopy (TEM, Hitachi S-7650, Japan) and high resolution transmission electron microscopy (HTEM, JEM-2100, Japan). X-ray photoelectron spectroscopy (XPS, ESCALAB 250Xi, America) measurements were obtained using the monochromatic Al Kα radiation (1486.6 eV) to evaluate the elemental compositions and chemical status of the sample. In the XPS analysis, we used the carbon C 1s peak at 284.8 eV as a reference for charge correction.Asymmetric supercapacitor devices
To construct the asymmetric supercapacitor, the optimized CoS2/RGO-2 composite electrode and AC electrode were used as the positive and negative electrodes with 2 M KOH as the electrolyte. The negative electrode was fabricated by dispersing AC as the active material, acetylene black as the conductive agent and PTFE as the binder with a mass ratio of 85![[thin space (1/6-em)]](https://www.rsc.org/images/entities/char_2009.gif) :
:![[thin space (1/6-em)]](https://www.rsc.org/images/entities/char_2009.gif) 10
10![[thin space (1/6-em)]](https://www.rsc.org/images/entities/char_2009.gif) :
:![[thin space (1/6-em)]](https://www.rsc.org/images/entities/char_2009.gif) 5.29 A small amount of distilled water was added to the abovementioned electrode material to form a uniform slurry, followed by plastering the slurry onto the Ni foam current collector within a certain area. Furthermore, the fabricated electrode was pressed and dried under vacuum at 60 °C for 8 h to obtain the final AC electrode. Based on a series of comparative experiments, 4.5 mg of AC was chosen to balance the capacitance of the two electrodes. Therefore, the total mass of the active electrode materials was 6.0 mg.
5.29 A small amount of distilled water was added to the abovementioned electrode material to form a uniform slurry, followed by plastering the slurry onto the Ni foam current collector within a certain area. Furthermore, the fabricated electrode was pressed and dried under vacuum at 60 °C for 8 h to obtain the final AC electrode. Based on a series of comparative experiments, 4.5 mg of AC was chosen to balance the capacitance of the two electrodes. Therefore, the total mass of the active electrode materials was 6.0 mg.
Electrochemical measurements
In the three-electrode electrochemical measurement system, the synthesized electrode was used as the working electrode, the platinum wire was used as the counter electrode and the saturated Ag/AgCl electrode was used as the reference electrode. The electrochemical performances of the samples were determined on an electrochemical workstation system (CHI660E, Shanghai ChenHua Co., Ltd, China). The electrochemical performances of supercapacitors were evaluated by characterizing their cyclic voltammetry (CV), galvanostatic charge/discharge (GCD) and electrochemical impedance spectroscopy (EIS). The voltage window was from −0.1 to 0.6 V vs. Ag/AgCl for the CoS2/RGO composite electrode, −1.0 to 0 V vs. Ag/AgCl for the AC electrode, and 0 to 1.8 V for the asymmetric CoS2/RGO-2//AC cell. Their GCD tests were measured at different current densities. The EIS measurement was conducted using a superimposed 5 mV sinusoidal voltage in the frequency range from 100 kHz to 10 mHz at open circuit potential. The parameters of the equivalent circuit were calculated and analysed by computer simulations using the ZSimpWin software. The specific capacitance (Cs, F g−1) and equivalent series resistance (ESR, Ω) in the three-electrode configuration were calculated from GCD curves on the basis of the following equation:9,29| Cs = I × Δt/(ΔV × m) | (1) |
| ESR = iRdrop/(2 × I) | (2) |
The CV and GCD tests of the asymmetric electrochemical capacitors were performed in a two-electrode cell. The specific capacitance (Ccell, F g−1), the energy density (E, W h kg−1) and power density (P, W kg−1) were calculated from GCD curves by the following equations:8,30
| Ccell = I × Δt/(ΔV × M) | (3) |
| E = 0.5 × Ccell × (ΔV)2/3.6 | (4) |
| P = E × 3600/(Δt) | (5) |
In addition, the specific capacitance of the electrode can be calculated from the CV curves on the basis of the following equation:9,31
| Cs = (∫IdV)/(vmacV) | (6) |
Results and discussion
Characterization of electrode materials
The crystallographic phase of CoS2 and different CoS2/RGO composites grown on the Ni foam was first characterized by XRD analysis. Because of the strong background of the Ni foam substrate on the XRD peak signals, the CoS2 and different CoS2/RGO composites had to be scratched from the Ni foam for XRD analysis. Fig. 1a shows the typical XRD patterns of GO, RGO, different CoS2/RGO composites, CoS2 and standard CoS2 (JCPDS card no. 65-3322). The XRD pattern of GO obtained through an improved Hummers' method presents a main diffraction peak at 2θ = 11.2° with an interlayer spacing of 0.79 nm, which is similar to those of many other previously reported GO because of the introduction of oxygen-containing functional groups between the graphene sheets.32 In contrast, a weak diffraction peak at around 25.8° is distinguishable for RGO, which indicates the highly amorphous nature of RGO, and the results suggest that GO was reduced to RGO through hydrothermal treatment at 150 °C for 10 h. In addition, for CoS2 and different CoS2 composites, all Bragg peaks at 28.0°, 32.4°, 36.5°, 40.0°, 46.5°, 55.1°, 60.3° and 62.8° were indexed to the reflections from (111), (200), (210), (211), (220), (311), (230) and (321) crystal planes of the cattierite CoS2 crystalline structure (JCPDS Card no. 65-3322),17 respectively, evidently indicating a perfect crystallinity. Moreover, in the XRD patterns of the CoS2/RGO composites, only the CoS2/RGO-3 composite was observed with a weak broad peak at about 25.6° corresponding to the (002) peak of RGO owing to its relatively higher RGO content. These results also indicate that the CoS2 and different CoS2/RGO composite electrodes were successfully prepared by our facile hydrothermal method.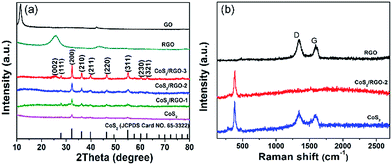 | ||
| Fig. 1 (a) XRD patterns of GO, RGO, different CoS2/RGO composites and CoS2. (b) Raman spectra of RGO, CoS2/RGO-2 and CoS2 composite. | ||
Raman spectroscopy is a noninvasive technique that has been a widely employed tool for the characterization of carbonaceous materials, especially for characterizing their ordered and disordered crystal structures.40 Fig. 1b shows the Raman spectra of the RGO, CoS2 scratched from Ni foam and CoS2/RGO-2 scratched from Ni foam. In the Raman spectrum of the CoS2/RGO-2 composite, there is a D peak at approximately 1360 cm−1 associated with defects in the graphite structure and a G peak at about 1590 cm−1, corresponding to the first-order scattering of the E2g mode.32 These two peaks are also observed in the RGO spectrum. In the Raman spectrum of CoS2/RGO-2 composite, there are D peak (∼1350 cm−1) and G peak (∼1590 cm−1) of RGO. The additional peak located at about 380 cm−1 is attributed to CoS2, since it is also seen in the Raman spectrum of pure CoS2 prepared in the absence of GO under the same conditions. Based on these results, it can be concluded that both RGO and CoS2 are present in the as-prepared composite.
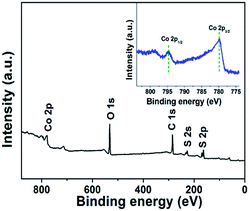
The X-ray photoelectron spectroscopy (XPS) measurements were performed to further confirm the oxidation state of Co in the CoS2RGO-2 composite (Fig. 2). Two distinct peaks at binding energies of 779.9 and 794.7 eV were found in the high resolution spectrum of Co 2p (the inset). These two peaks could be attributed to Co 2p3/2 and Co 2p1/2, which is the characteristic of Co2+ in the CoS2RGO-2 composite, and consistent with that of CoS2 reported previously.33–35 Moreover, the wide XPS spectrum of the composite exhibited that the binding energies of O 1s, S 2s and S 2p were determined to be 531.4 eV, 230.8 eV and 162.7 eV,34 respectively, with the reference binding energy at 284.8 eV for the C 1s peak. Thus, XPS analysis further demonstrated that the state of Co within the composite was positive bivalent.
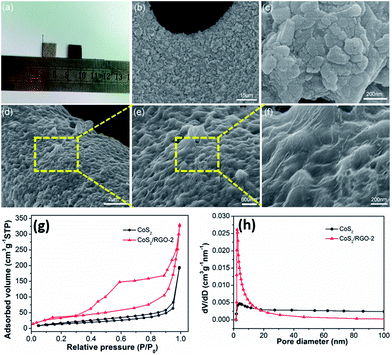
The images and SEM images of the Ni foam, CoS2 electrode and CoS2/RGO-2 composite electrode are shown in Fig. 3a–f. The images of the Ni foam (left) and CoS2 (right) are shown in Fig. 3a. The color of Ni foam changes to black after the hydrothermal reaction, which is indicative of the formation of CoS2. Fig. 3b and d clearly show that the as-prepared particles are fully deposited on the surface of the Ni foam, indicating that the present hydrothermal system is favorable for growing the particles on conductive substrates. Similar to the previous reports,36–38 a porous structure with an interconnected 3D scaffold of the Ni foam serves as a direct conductive substrate for the growth of materials. As shown in Fig. 3c, the pristine CoS2 without GO, displays a severe aggregation of CoS2 particles. However, in the presence of GO, it is revealed that the surface of the CoS2/RGO-2 composite obtains a novel large-scale wave-like structure with CoS2 nanoparticles uniformly wrapped by the RGO sheets, and the agglomeration of CoS2 was effectively alleviated at the same time (Fig. 3e). The high-magnification SEM (Fig. 3f) image revealed that the CoS2 particles had an equable size distribution ranging from 200 to 300 nm. Prevention of CoS2 and RGO agglomeration results from the effect of steric hindrance between CoS2 and RGO, which is advantageous for reducing the diffusion and migration distance of the ions and increasing the effective contact area between active material and electrolyte. In addition, the exclusion of an insulating binder, direct contact with the current collector (Ni foam) and facile electron conduction along the novel large-scale wave-like structure all enhance the electrochemical performance of the CoS2/RGO composite electrode for the supercapacitor.
The mesoporous nature of the as-synthesized products was verified by surface area and pore size distribution analysis. Fig. 3g displays the N2 adsorption–desorption isotherms of the CoS2 and CoS2/RGO-2 composite. The BET specific surface area of the CoS2/RGO-2 composite was calculated to be 93 m2 g−1, which was much higher than that of CoS2 (21 m2 g−1). Interestingly, based on the BJH model (Fig. 3h), both samples indicated the existence of mesopores. With respect to CoS2, the higher surface area of CoS2/RGO-2 is due to the introduction of RGO, resulting from the fact that RGO not only acts as the support for the deposition of CoS2 nanoparticles but also prevents CoS2 from aggregating. Moreover, combined with the CoS2/RGO-2 mesoporous feature, it is advantageous to provide a short and fast transport pathway, thus enhancing the faradaic reaction.
To study the effects of different concentrations of GO, the SEM images of CoS2/RGO-1 and CoS2/RGO-3 are shown in Fig. 4. As shown in Fig. 4a and b, CoS2 nanoparticles within the CoS2/RGO-1 composite were mostly wrapped by the RGO sheets, but some CoS2 particles still agglomerated on the surface without being in contact with the RGO sheets at the same time, which was attributed to the lower RGO content. Moreover, the CoS2/RGO-3 composite (Fig. 4c and d) also displayed a large-scale wave-like structure with CoS2 nanoparticles uniformly wrapped by the RGO sheets; however, a mild aggregation between RGO sheets was observed because of a relatively higher RGO content (see Fig. 5). The SEM images of GO and RGO are also shown in Fig. S1.†
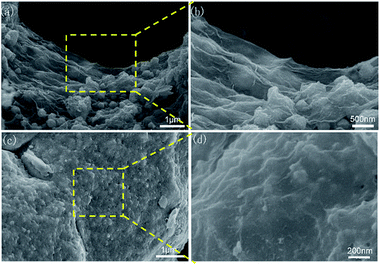 | ||
| Fig. 4 (a and b) SEM images of the CoS2/RGO-1 composite electrode. (c and d) SEM images of the CoS2/RGO-3 composite electrode. | ||
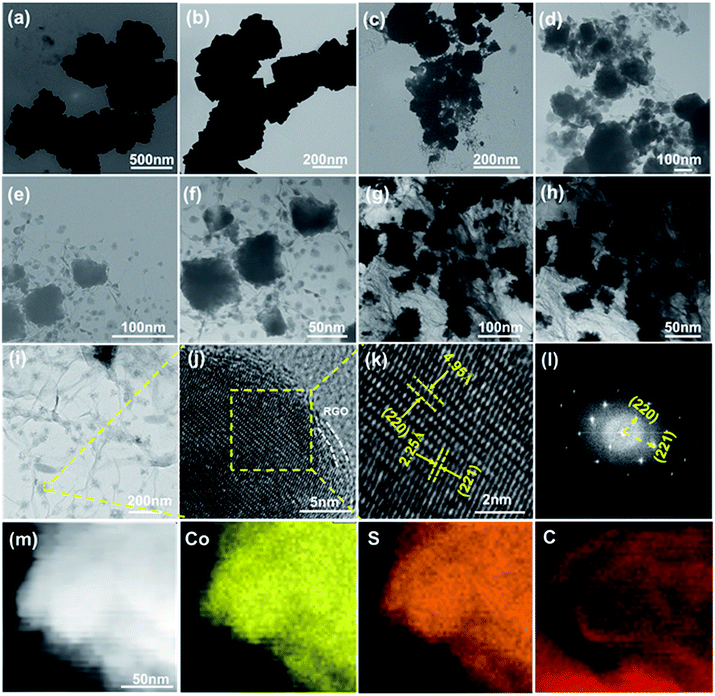
To further investigate the morphologies and particle sizes of the CoS2/RGO composites with different concentrations of the raw GO material, TEM/HTEM images of the samples were obtained. From the TEM images (Fig. 5a and b) of the CoS2 electrode at different magnifications, it can be seen that CoS2 particles exhibit a non-uniform size distribution from 400 nm up to 500 nm. As shown in Fig. 5c and d, CoS2 particles with sizes of 200 to 300 nm are wrapped by RGO sheets; however, to some extent, the CoS2 particles are agglomerated together. TEM images of the CoS2/RGO-2 composite electrode at different magnifications are shown in Fig. 5e and f. It can be seen that CoS2 particles are uniformly wrapped by RGO sheets over a broad area to form the composite materials. Clearly, the size of these CoS2 particles is reduced by about 100 nm compared to the pure CoS2 particles. Moreover, Fig. 5g and h illustrate that CoS2 particles are also homogeneously wrapped by RGO sheets, but the RGO aggregates slightly as well. These results are in good agreement with the abovementioned SEM analysis.
To further clarify the crystal structure of the CoS2/RGO-2 composite electrode, TEM/HTEM images are shown in Fig. 5i and j. As displayed in Fig. 5i and f, CoS2 nanoparticles are well wrapped by RGO. Moreover, from Fig. 5k, the widths of the lattice fringes are about 2.25 and 4.95 Å for CoS2/RGO-2, corresponding to the (211) and (210) planes of CoS2 crystals, which is in good agreement with the XRD analysis mentioned above. The fast Fourier transform (FFT) pattern (Fig. 5l corresponding to the yellow-boxed area in Fig. 5j) reveals that CoS2 prefers to form single crystals with high crystallinity. To further confirm the elemental composition of the CoS2/RGO-2 composite, elemental mapping was carried out using the high-angle annular dark-field scanning TEM (HAADF-STEM) (Fig. 5m). The resulting image from elemental mapping shows that the Co and S distributions are quite uniform with a trapezoidal shape, suggestive of CoS2 nanoparticles, whereas C is also well distributed throughout, indicative of RGO homogeneously wrapping the CoS2 nanoparticles.
The schematic of the structure of the CoS2/RGO composite electrode is shown on the right in Scheme 1. In view of the CoS2 nanoparticles growing directly on the Ni foam and being simultaneously wrapped by RGO sheets, ensuring that CoS2 nanoparticles get electrons from all directions, the polarization phenomenon of the electrode could be further alleviated.39 Hence, such a highly efficient and stable mixed (electron and OH−1) conducting network could provide superior electronic and electrolyte contact between the CoS2 nanoparticles and facilitate fast electron transport during the charge/discharge processes, which would be more effective in enhancing the electrochemical properties of CoS2/RGO in comparison with CoS2.
Electrochemical tests for positive electrode materials
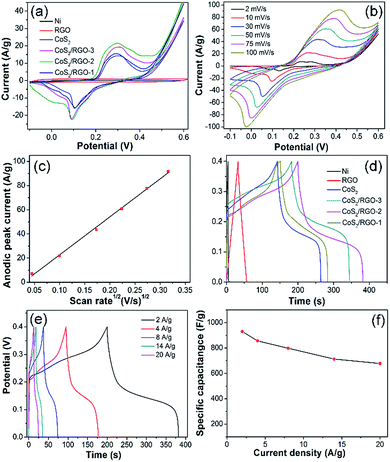
The CV curve of the Ni foam substrate is similar to a straight line (Fig. 6a), confirming the electrochemical performance of Ni foam. Moreover, the GCD curve of the Ni foam (Fig. 6d) is also in good agreement with the CV test. Therefore, the contribution of Ni foam is negligible for the total electrode. In order to obtain the optimum CoS2/RGO composite electrode, the effects of the mass ratios of CoCl2·6H2O and GO on the electrochemical properties of the composites were studied. The electrochemical performances of the RGO, CoS2 and different CoS2/RGO composite electrodes were firstly investigated by the CV method. Fig. 6a shows that the CV curves are measured under the potential window from −0.1 to 0.6 V in 2 M KOH at a scan rate of 10 mV s−1 in a three-electrode system. Clearly, the CV curve of RGO is close to a quasi-rectangular shape, differing from the CV curves of CoS2 and CoS2/RGO composite electrodes. In contrast, all the CV curves of the CoS2 and CoS2/RGO composite electrodes consist of a couple of strong redox peaks, indicating that the capacitance characteristics are mainly governed by faradaic redox reactions. The mechanism for charge-storage of CoS2 based electrodes in an alkaline solution might be explained by the following redox reaction:16,22 CoS2 + 2OH− ↔ CoS2O + H2O + 2e−.The areas of the curves increase with increasing the mass ratios of CoCl2·6H2O and GO from 1![[thin space (1/6-em)]](https://www.rsc.org/images/entities/char_2009.gif) :
:![[thin space (1/6-em)]](https://www.rsc.org/images/entities/char_2009.gif) 3 to 1
3 to 1![[thin space (1/6-em)]](https://www.rsc.org/images/entities/char_2009.gif) :
:![[thin space (1/6-em)]](https://www.rsc.org/images/entities/char_2009.gif) 2. When the mass ratios of CoCl2·6H2O and GO further increase to 1
2. When the mass ratios of CoCl2·6H2O and GO further increase to 1![[thin space (1/6-em)]](https://www.rsc.org/images/entities/char_2009.gif) :
:![[thin space (1/6-em)]](https://www.rsc.org/images/entities/char_2009.gif) 1, the area of the curves decrease; as is well known, the electrode specific capacitance is proportional to the area of the curves. On the other hand, the CoS2/RGO-2 composite electrode has a higher electrode specific capacitance than of CoS2 and other CoS2/RGO composite electrodes at the same scan rate. Fig. 6b exhibits the typical CV curves of the CoS2/RGO-2 composite electrode-based supercapacitors with various sweep rates ranging from 5 to 100 mV s−1. It is seen that all the CV shapes have a pair of obvious peaks, which is remarkably different from the closely ideal rectangular CV shape for an electric double-layer capacitor.33 Moreover, all the redox peaks are symmetrical with different scan rates, implying a desirable reversibility of the redox reaction at/near the CoS2/RGO electrode surface. Simultaneously, the area and the peak current densities both apparently increase with the increase of the scan rate, possibly resulting from the large surface area of the CoS2/RGO-2 and the good reversibility of the fast charge–discharge response. To further study the CV characteristics of the CoS2/RGO-2 composite electrode, the relationship between anodic peak current (ip) and scan rate (v) can be observed in Fig. 6c. The ip vs. v1/2 curve shows a reasonably linear relationship, which indicates that the redox reaction of the CoS2/RGO-2 electrode is diffusion-limited, as noted in other reports.36–41 These results demonstrate the excellent electrochemical properties of the CoS2/RGO-2 composite electrode, such as a good rate capability and remarkable reversibility, which can be ascribed to the large surface area of the wave-like structure of the CoS2/RGO-2 composite electrode and the fast ionic/diffusion rate within the composite electrode.
1, the area of the curves decrease; as is well known, the electrode specific capacitance is proportional to the area of the curves. On the other hand, the CoS2/RGO-2 composite electrode has a higher electrode specific capacitance than of CoS2 and other CoS2/RGO composite electrodes at the same scan rate. Fig. 6b exhibits the typical CV curves of the CoS2/RGO-2 composite electrode-based supercapacitors with various sweep rates ranging from 5 to 100 mV s−1. It is seen that all the CV shapes have a pair of obvious peaks, which is remarkably different from the closely ideal rectangular CV shape for an electric double-layer capacitor.33 Moreover, all the redox peaks are symmetrical with different scan rates, implying a desirable reversibility of the redox reaction at/near the CoS2/RGO electrode surface. Simultaneously, the area and the peak current densities both apparently increase with the increase of the scan rate, possibly resulting from the large surface area of the CoS2/RGO-2 and the good reversibility of the fast charge–discharge response. To further study the CV characteristics of the CoS2/RGO-2 composite electrode, the relationship between anodic peak current (ip) and scan rate (v) can be observed in Fig. 6c. The ip vs. v1/2 curve shows a reasonably linear relationship, which indicates that the redox reaction of the CoS2/RGO-2 electrode is diffusion-limited, as noted in other reports.36–41 These results demonstrate the excellent electrochemical properties of the CoS2/RGO-2 composite electrode, such as a good rate capability and remarkable reversibility, which can be ascribed to the large surface area of the wave-like structure of the CoS2/RGO-2 composite electrode and the fast ionic/diffusion rate within the composite electrode.
Fig. 6d shows the charge/discharge curves of the Ni foam, RGO, CoS2 and different CoS2/RGO composite electrodes tested at a constant current density of 2 A g−1. The GCD curve of RGO is highly linear and symmetrical, revealing an ideal capacitive character. In addition to Ni and RGO curves, the shapes of the other GCD curves show that the capacitance mainly results from pseudocapacitance, which is in accordance with the CV measurements. As expected, the CoS2/RGO-2 composite electrode has a much longer discharging time than pure CoS2 and other CoS2/RGO composite electrodes, suggesting that the CoS2/RGO-2 composite electrode material exhibits much higher specific capacitance values than the other materials. Furthermore, the potential–time profiles exhibit almost symmetrical charge/discharge features, indicating their good pseudocapacitive character. On the other hand, based on their GCD measurements, the Cs of the electrodes can be evaluated through eqn (1). The Cs of RGO, CoS2 electrode, and CoS2/RGO-1, 2 and 3 composite electrodes are 140.2, 624.1, 830.0, 930.3 and 679.5 F g−1, respectively. Furthermore, by GCD tests, the equivalent series resistances (ESR) can be calculated based on eqn (2). Their ESR values are 1.2, 0.9, 0.8 and 1.1 Ω, respectively, which demonstrates that the RGO can reduce the ESRs of supercapacitors, leading to the enhancement of Cs. However, when the mass ratio of CoCl2·6H2O and GO is 1![[thin space (1/6-em)]](https://www.rsc.org/images/entities/char_2009.gif) :
:![[thin space (1/6-em)]](https://www.rsc.org/images/entities/char_2009.gif) 3, the Cs decreases as the GO content increases, mainly attributed to the production of lower pseudocapacitance from CoS2. To further explain the rate capability of CoS2/RGO-2, its GCD curves are measured at different current densities from 2 to 20 A g−1 under an applied potential between 0 and 0.6 V (Fig. 6e). The charge curves have voltage plateaus and are highly symmetric with their corresponding discharge counter parts at various current densities from 2 to 20 A g−1. This demonstrates that the CoS2/RGO-2 composite electrode-based supercapacitor has a typical pseudocapacitance behavior and a rapid I–V response. The CoS2/RGO-2 composite electrode shows a high capacitance of 930.3 F g−1 at a current density of 2 F g−1, whereas the Cs remains at 677.9 F g−1 at a current density of 20 A g−1, suggesting that the CoS2/RGO-2 composite electrode has an excellent electrochemical reversibility. The Cs as a function of applied current density of the CoS2/RGO-2 composite electrode is exhibited in Fig. 6f. In general, with the increase in the current densities, the Cs gradually decreases. It can be found that the Cs (at 20 A g−1) is still around 72.9% retention of its initial values (at 2 A g−1), revealing the excellent rate capability of the supercapacitor based on the CoS2/RGO-2 composite electrode. All these results excellently demonstrate the synergistic effect of the combination of CoS2 and RGO on the electrochemical performance. In comparison with the CoS2 electrode and other CoS2/RGO composite electrodes, the CoS2/RGO-2 composite electrode exhibits the highest specific capacitance, mainly based on three reasons: (i) the RGO prevents the agglomeration of CoS2 nanoparticles to obtain higher specific surface area between CoS2/RGO and the electrolyte; (ii) lower resistance facilitates faster electron transport during the charge/discharge processes. (iii) The right amount of RGO not only forms an effective conductive network but also does not sacrifice much of the capacity of CoS2.42,48
3, the Cs decreases as the GO content increases, mainly attributed to the production of lower pseudocapacitance from CoS2. To further explain the rate capability of CoS2/RGO-2, its GCD curves are measured at different current densities from 2 to 20 A g−1 under an applied potential between 0 and 0.6 V (Fig. 6e). The charge curves have voltage plateaus and are highly symmetric with their corresponding discharge counter parts at various current densities from 2 to 20 A g−1. This demonstrates that the CoS2/RGO-2 composite electrode-based supercapacitor has a typical pseudocapacitance behavior and a rapid I–V response. The CoS2/RGO-2 composite electrode shows a high capacitance of 930.3 F g−1 at a current density of 2 F g−1, whereas the Cs remains at 677.9 F g−1 at a current density of 20 A g−1, suggesting that the CoS2/RGO-2 composite electrode has an excellent electrochemical reversibility. The Cs as a function of applied current density of the CoS2/RGO-2 composite electrode is exhibited in Fig. 6f. In general, with the increase in the current densities, the Cs gradually decreases. It can be found that the Cs (at 20 A g−1) is still around 72.9% retention of its initial values (at 2 A g−1), revealing the excellent rate capability of the supercapacitor based on the CoS2/RGO-2 composite electrode. All these results excellently demonstrate the synergistic effect of the combination of CoS2 and RGO on the electrochemical performance. In comparison with the CoS2 electrode and other CoS2/RGO composite electrodes, the CoS2/RGO-2 composite electrode exhibits the highest specific capacitance, mainly based on three reasons: (i) the RGO prevents the agglomeration of CoS2 nanoparticles to obtain higher specific surface area between CoS2/RGO and the electrolyte; (ii) lower resistance facilitates faster electron transport during the charge/discharge processes. (iii) The right amount of RGO not only forms an effective conductive network but also does not sacrifice much of the capacity of CoS2.42,48
In order to investigate the charge and ionic transfer characteristics of the electrodes, EIS measurements were carried out. Fig. 7 depicts the Nyquist plots of RGO, the CoS2 electrode and the CoS2/RGO-2 composite electrode. Notably, these plots exhibit a depressed arc at the high-frequency region, followed by a straight line at the low-frequency region. The enlargement of the EIS spectra at the high-frequency region and the equivalent circuit proposed to fit their EIS spectra are presented in the inset of Fig. 7, where Re is the internal resistance, Rct is the faradaic interfacial charge-transfer resistance, Cdl represents the electric double-layer capacitance, and W is the Warburg resistance.43 Re, which is attributed to the ionic resistance of the electrolyte, the intrinsic resistance of the electrode material, and the contact resistance at the interface of the electrode material, is counted from the point of intersection with the x-axis in the high frequency region. Rct, which is related to the process taking place at the electrode/electrolyte, is calculated from the span of the single semi-circle along the x-axis from the high to low frequency region. As illustrated in Fig. 7, the inner resistance (Re) of the CoS2/RGO-2 composite electrode (0.6 Ω) is lower than that of the CoS2 electrode (0.9 Ω), but higher than that of the RGO electrode (0.5 Ω). Moreover, the CoS2/RGO-2 composite electrode also has smaller charge transfer resistance (Rct, 0.2 Ω for CoS2/RGO-2 and 0.5 Ω for CoS2, respectively), meaning the CoS2/RGO-2 composite electrode has easier electron transport because of the presence of RGO.
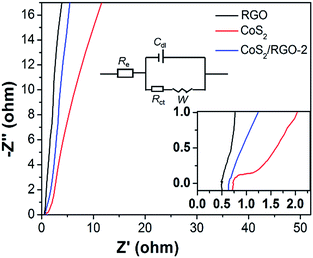 | ||
| Fig. 7 Nyquist plots of supercapacitors based on RGO, the CoS2 electrode and the CoS2/RGO-2 composite electrode. | ||
Asymmetric supercapacitor
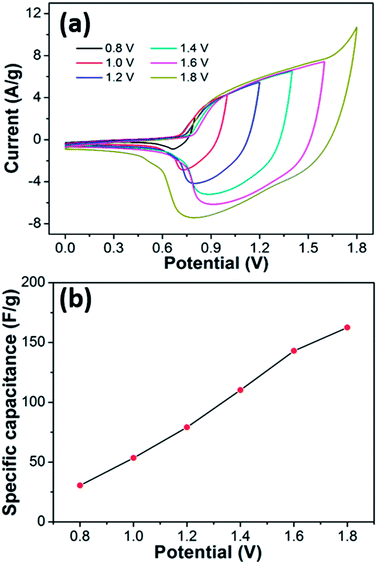
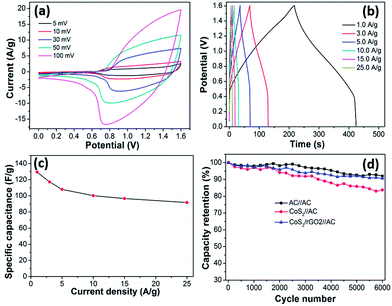
Considering the abovementioned results, the CoS2/RGO-2 composite electrode was chosen to fabricate an asymmetric supercapacitor to further assess its application value. Fig. 8a shows CV curves of the as-assembled CoS2/RGO-2//AC asymmetric supercapacitor at different voltage windows in 2 M KOH aqueous electrolyte solution at 20 mV s−1. It can be clearly seen that the assembled asymmetric supercapacitor displays distinct peaks beginning with 1.0 V, and the peaks gradually become stronger while the area also increases with the increase of the potential window. In Fig. 8b, the specific capacitance for the asymmetric supercapacitor is calculated to be as high as 143.0 F g−1 (at the operation potential of 1.6 V) and 30.4 F g−1 (at the operation potential of 0.8 V), meaning that the stored energy can be significantly improved based on the equation of the energy density. As a result, the overall performance of the supercapacitor is remarkably improved. However, for potential windows >1.8 V, the CV curves display a distortion and a slight hump around 1.8 V, indicating some irreversible reactions when the potential window is higher than 1.8 V,25 while there is clearly a serious limitation related to H2 evolution at the negative electrode. In our subsequent measurements, we chose a potential window from 0 to 1.6 V in 2 M KOH solution to further investigate the overall electrochemical characteristics of the as-fabricated asymmetric supercapacitor.Fig. 9 exhibits the electrochemical performance of the CoS2/RGO-2//AC asymmetric two-electrode supercapacitor. Fig. 9a presents the CV curves of the CoS2/RGO-2//AC asymmetric supercapacitor tested at various scan rates from 5 to 100 mV s−1 in the potential range of 0–1.6 V. A pair of distinct peaks can be observed in the CV curves of the CoS2/RGO-2//AC electrode. In addition, with the increase in the scan rates, the shapes of the CV curves are retained well.
Furthermore, galvanostatic discharge curves at various charge/discharge current densities were obtained from Fig. 9b to further assess the rate capability of the asymmetric supercapacitor. As shown in Fig. 9b, the GCD curves of the CoS2/RGO-2//AC asymmetric supercapacitor give an excellent linear variation with potential, suggesting superior electrochemical reversibility and capacitive behavior. Fig. 9c presents calculations of the Ccell based on the discharge curves of the CoS2/RGO-2//AC asymmetric supercapacitor. Ccell is 129.3, 117.5, 107.9, 100.2, 96.6 and 91.6 F g−1 at current densities of 1, 3, 5, 10, 15 and 25 A g−1, respectively. This is substantially higher than the values reported previously for hierarchical porous NiO//AC (38 F g−1 at 1 mV s−1),44 MnOOH/RGO//AC (74.4 F g−1 at 1 A g−1),7 and Ni3S2/MWCNTs//AC (55.8 F g−1 at 1 A g−1).45 The results also show the decrease of Ccell with the increase of current density. However, the asymmetric supercapacitor reveals high rate capability because the Ccell still remains at 91.6 F g−1 at a current density of 25 A g−1 (70.8% retention at initial current density of 1 A g−1), which is ascribed to high rate properties of both CoS2/RGO-2 composite and AC.
A long-term cycle stability of the as-fabricated asymmetric supercapacitor was conducted by repeating the GCD test at current density of 10 A g−1 over 6000 cycles. Fig. 9d shows that the overall specific capacitance can still be maintained at about 90% of the initial available capacitance after 6000 consecutive charge/discharge tests, which is comparable to that of AC//AC (92% after 6000 cycles) and CoS2//CoS2 (83% after 6000 cycles). Clearly, the asymmetric supercapacitor shows good stability towards long time usages. AC with excellent cycling stability46,47 as well as the CoS2/RGO-2 with synergistic effect both contribute to the superior cycling stability.
Power density and energy density are the two key parameters characterizing the performance of the electrochemical supercapacitors.49,50 Although it is a challenge to compare the performances of all types of supercapacitors due to different measurement conditions such as potential window, charge–discharge rates and material mass loadings, a rough comparison between the developed electrode and documented work can still be made. Ragone plots (Fig. 10) were made based on GCD data calculated by eqn (4) and (5) to illustrate the energy and power properties of CoS2/RGO-2//AC asymmetric supercapacitors. The asymmetric device presents the maximum energy density of 45.7 W h kg−1 at a power density of 797.0 W kg−1 and maintains a high energy density of 21.8 W h kg−1 at a high power density of 16.4 kW kg−1. These values are significantly improved compared to those of the CoS2/RGO-2//CoS2/RGO-2 and AC//AC symmetric supercapacitors and a CoS2//AC asymmetric supercapacitor. The improved energy and power densities of the constructed CoS2/RGO-2//AC asymmetric supercapacitor are mainly attributed to two reasons: on the one hand, the synergistic effect between the positive and negative electrodes to form high cell specific capacitance; on the other hand, the wide operation voltage window (1.6 V). A table showing comparisons of literature values of capacitance, working voltage window, stability, energy density and power density of supercapacitors based on CoS2 and CoS2/Graphene is shown in ESI (Table 1†).
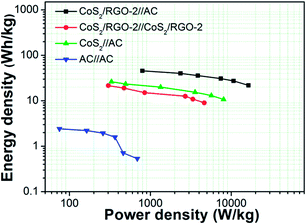 | ||
| Fig. 10 Ragone plots of symmetric and asymmetric supercapacitors based on AC, CoS2/RGO-2 and CoS2/RGO-2//AC. | ||
Conclusions
In conclusion, we demonstrated a general paradigm for fabricating 3D CoS2 electrodes and CoS2/RGO composite electrodes by directly growing active materials on a Ni foam with strong adhesion for high-performance supercapacitors by a facile hydrothermal approach. When the mass ratio of CoCl2·6H2O and GO is 1![[thin space (1/6-em)]](https://www.rsc.org/images/entities/char_2009.gif) :
:![[thin space (1/6-em)]](https://www.rsc.org/images/entities/char_2009.gif) 2, the CoS2/RGO-2 composite electrode exhibits the highest capacitance of 930.3 F g−1 at 2 A g−1 and shows excellent rate capability. This could probably be attributed to the positive synergistic effect between RGO and CoS2, the exclusion of insulating binder, direct contact with the current collector (Ni foam) as well as the facile electron conduction along the novel large-scale wave-like structure. More importantly, the asymmetric supercapacitor device has been fabricated using the CoS2/RGO-2 composite electrode as the positive electrode and AC as the negative electrode. This can result in remarkable electrochemical performance, including the Ccell of 91.6 F g−1 at a high current density of 25 A g−1 in a wide voltage window of 1.6 V, as well as outstanding rate capability and superior cyclic durability (90% retention after more than 6000 charge/discharge cycles). Furthermore, the asymmetric device delivers a maximum energy density of 45.7 W h kg−1 at a power density of 797.0 W kg−1. It is believed that this strategy provides a perfect platform for further electrochemical applications in high energy-power density storage systems.
2, the CoS2/RGO-2 composite electrode exhibits the highest capacitance of 930.3 F g−1 at 2 A g−1 and shows excellent rate capability. This could probably be attributed to the positive synergistic effect between RGO and CoS2, the exclusion of insulating binder, direct contact with the current collector (Ni foam) as well as the facile electron conduction along the novel large-scale wave-like structure. More importantly, the asymmetric supercapacitor device has been fabricated using the CoS2/RGO-2 composite electrode as the positive electrode and AC as the negative electrode. This can result in remarkable electrochemical performance, including the Ccell of 91.6 F g−1 at a high current density of 25 A g−1 in a wide voltage window of 1.6 V, as well as outstanding rate capability and superior cyclic durability (90% retention after more than 6000 charge/discharge cycles). Furthermore, the asymmetric device delivers a maximum energy density of 45.7 W h kg−1 at a power density of 797.0 W kg−1. It is believed that this strategy provides a perfect platform for further electrochemical applications in high energy-power density storage systems.
Acknowledgements
This study was supported financially by the National Natural Science Foundation of China (No. 50974045).Notes and references
- J. Xu, Q. Wang, X. Wang, Q. Xiang, B. Hang, D. Chen and G. Shen, ACS Nano, 2013, 7, 5453 CrossRef CAS PubMed.
- Z. Tang, C.-h. Tang and H. Gong, Adv. Funct. Mater., 2012, 22, 1272 CrossRef CAS.
- A. Izadi-Najafabadi, S. Yasuda, K. Kobashi, T. Yamada, D. N. Futaba, H. Hatori, M. Yumura, S. Iijima and K. Hata, Adv. Mater., 2010, 22, E235 CrossRef CAS PubMed.
- A. Burke, J. Power Sources, 2000, 91, 37 CrossRef CAS.
- J. R. Miller and P. Simon, Science, 2008, 321, 651 CrossRef CAS PubMed.
- P. Simon and Y. Gogotsi, Nat. Mater., 2008, 7, 845 CrossRef CAS PubMed.
- Y. Cao, Y. Xiao, Y. Gong, C. Wang and F. Li, Electrochim. Acta, 2014, 127, 200 CrossRef CAS.
- Z. Fan, J. Yan, T. Wei, L. Zhi, G. Ning, T. Li and F. Wei, Adv. Funct. Mater., 2011, 21, 2366 CrossRef CAS.
- W. Chen, C. Xia and H. N. Alshareef, ACS Nano, 2014, 8, 9531 CrossRef CAS PubMed.
- F. Zhang, T. Zhang, X. Yang, L. Zhang, K. Leng, Y. Huang and Y. Chen, Energy Environ. Sci., 2013, 6, 1623 CAS.
- Q. Zhang, C. Xu and B. Lu, Electrochim. Acta, 2014, 132, 180 CrossRef CAS.
- K. Gopalakrishnan, S. Sultan, A. Govindaraj and C. N. R. Rao, Nano Energy, 2015, 12, 52 CrossRef CAS.
- S. Ratha and C. S. Rout, ACS Appl. Mater. Interfaces, 2013, 5, 11427 CAS.
- J. Shi, X. Li, G. He, L. Zhang and M. Li, J. Mater. Chem. A, 2015, 3, 20619 CAS.
- J. Feng, X. Sun, C. Wu, L. Peng, C. Lin, S. Hu, J. Yang and Y. Xie, J. Am. Chem. Soc., 2011, 133, 17832 CrossRef CAS PubMed.
- J. Tang, J. Shen, N. Li and M. Ye, Ceram. Int., 2014, 40, 15411 CrossRef CAS.
- B. Qiu, X. Zhao and D. Xia, J. Alloys Compd., 2013, 579, 372 CrossRef CAS.
- Y. Gu, Y. Xu and Y. Wang, ACS Appl. Mater. Interfaces, 2013, 5, 801 CAS.
- H.-W. Chen, C.-W. Kung, C.-M. Tseng, T.-C. Wei, N. Sakai, S. Morita, M. Ikegami, T. Miyasaka and K.-C. Ho, J. Mater. Chem. A, 2013, 1, 13759 CAS.
- N. Mahmood, C. Zhang, J. Jiang, F. Liu and Y. Hou, Chem.–Eur. J., 2013, 19, 5183 CrossRef CAS PubMed.
- S. Amaresh, K. Karthikeyan, I. C. Jang and Y. S. Lee, J. Mater. Chem. A, 2014, 2, 11099 CAS.
- J.-C. Xing, Y.-L. Zhu, Q.-W. Zhou, X.-D. Zheng and Q.-J. Jiao, Electrochim. Acta, 2014, 136, 550 CrossRef CAS.
- B. Wang, J. Park, D. Su, C. Wang, H. Ahn and G. Wang, J. Mater. Chem., 2012, 22, 15750 RSC.
- L. Zhang, H. B. Wu and X. W. Lou, Chem. Commun., 2012, 48, 6912 RSC.
- X. Wang, C. Yan, A. Sumboja and P. S. Lee, Nano Energy, 2014, 3, 119 CrossRef CAS.
- T. Y. Wei, C. H. Chen, H. C. Chien, S. Y. Lu and C. C. Hu, Adv. Mater., 2010, 22, 347 CrossRef CAS PubMed.
- C.-Y. Chen, Z.-Y. Shih, Z. Yang and H.-T. Chang, J. Power Sources, 2012, 215, 43 CrossRef CAS.
- B. Wang, S. Wang, P. Liu, J. Deng, B. Xu, T. Liu, D. Wang and X. S. Zhao, Mater. Lett., 2014, 118, 137 CrossRef CAS.
- H.-Y. Lee and S.-M. Lee, Electrochem. Commun., 2004, 6, 465 CrossRef CAS.
- Y. Zhu, Z. Wu, M. Jing, X. Yang, W. Song and X. Ji, J. Power Sources, 2015, 273, 584 CrossRef CAS.
- J. A. Seabold and K. S. Choi, Chem. Mater., 2011, 23, 1105 CrossRef CAS.
- D. C. Marcano, D. V. Kosynkin, J. M. Berlin, A. Sinitskii, Z. Z. Sun, A. Slesarev, L. B. Alemany, W. Lu and J. M. Tour, ACS Nano, 2010, 4, 4806 CrossRef CAS PubMed.
- Y. Ji, X. Liu, W. Liu, Y. Wang, H. Zhang, M. Yang, X. Wang, X. Zhao and S. Feng, RSC Adv., 2014, 4, 50220 RSC.
- J. Xie, S. Liu, G. Cao, T. Zhu and X. Zhao, Nano Energy, 2013, 2, 49 CrossRef CAS.
- C. Zhao, D. Li and Y. Feng, J. Mater. Chem. A, 2013, 1, 5741 CAS.
- X. Qing, S. Liu, K. Huang, K. Lv, Y. Yang, Z. Lu, D. Fang and X. Liang, Electrochim. Acta, 2011, 56, 4985 CrossRef CAS.
- X. Yu, B. Lu and Z. Xu, Adv. Mater., 2014, 26, 1044 CrossRef CAS PubMed.
- S. Peng, L. Li, H. B. Wu, S. Madhavi and X. W. D. Lou, Adv. Energy Mater., 2015 DOI:10.1002/aenm.201401172.
- B. Wang, D. Wang, Q. Wang, T. Liu, C. Guo and X. Zhao, J. Mater. Chem. A, 2013, 1, 135 CAS.
- Z. Xing, Q. Chu, X. Ren, C. Ge, A. H. Qusti, A. M. Asiri, A. O. Al-Youbi and X. Sun, J. Power Sources, 2014, 245, 463 CrossRef CAS.
- S. W. Chou and J. Y. Lin, J. Electrochem. Soc., 2013, 160, D178 CrossRef CAS.
- B. Wang, A. Liu, W. A. Abdulla, D. Wang and X. S. Zhao, Nanoscale, 2015, 7, 8819 RSC.
- Y. Zhang, C. Sun, H. Su, W. Huang and X. Dong, Nanoscale, 2015, 7, 3155 RSC.
- D.-W. Wang, F. Li and H.-M. Cheng, J. Power Sources, 2008, 185, 1563 CrossRef CAS.
- C.-S. Dai, P.-Y. Chien, J.-Y. Lin, S.-W. Chou, W.-K. Wu, P.-H. Li, K.-Y. Wu and T.-W. Lin, ACS Appl. Mater. Interfaces, 2013, 5, 12168 CAS.
- C. Portet, P. L. Taberna, P. Simon, E. Flahaut and C. Laberty-Robert, Electrochim. Acta, 2005, 50, 4174 CrossRef CAS.
- B. Wang, Q. M. Wang, B. H. Xu, T. F. Liu, D. L. Wang and X. S. Zhao, RSC Adv., 2013, 3, 20024 RSC.
- B. Wang, B. H. Xu, T. F. Liu, P. Liu, C. F. Guo, S. Wang, Z. G. Xiong, D. L. Wang and X. S. Zhao, Nanoscale, 2014, 6, 986 RSC.
- X. Rui, X. Zhao, Z. Lu, H. Tan, D. Sim, H. H. Hng, R. Yazami, T. M. Lim and Q. Yan, ACS Nano, 2013, 7, 5637 CrossRef CAS PubMed.
- B. Wang, W. Al Abdulla, D. Wang and X. S. Zhao, Energy Environ. Sci., 2015, 8, 869 CAS.
Footnote |
| † Electronic supplementary information (ESI) available. See DOI: 10.1039/c5ra25665h |
| This journal is © The Royal Society of Chemistry 2016 |

