Investigations on Nb2C monolayer as promising anode material for Li or non-Li ion batteries from first-principles calculations
Junping Huabce,
Bo Xud,
Chuying Ouyangd,
Ying Zhang*f and
Shengyuan A. Yang*c
aSchool of Physics, Beijing Institute of Technology, Beijing 100081, China
bSchool of Science, Nanchang Institute of Technology, Nanchang 330099, China
cResearch Laboratory for Quantum Materials, Singapore University of Technology and Design, Singapore 487372, Singapore. E-mail: shengyuan_yang@sutd.edu.sg
dDepartment of Physics, Jiangxi Normal University, Nanchang 330022, China
eKunming Institute of Physics, Kunming, Yunnan 650223, China
fDepartment of Physics, Beijing Normal University, Beijing 100875, China. E-mail: yingzhang@bnu.edu.cn
First published on 2nd March 2016
Abstract
First-principles calculations are performed to study the electronic properties and metal ion storage capabilities of the two-dimensional (2D) Nb2C monolayer and its corresponding fluoride and hydroxide materials. We show that the Nb2C monolayer and the derived Nb2CF2 and Nb2C(OH)2 are all metallic in their most stable configurations. We systematically investigate the adsorption and surface diffusion of different metal atom species A = Li, Na, K, Be, Mg, Ca, Al. We find that the bare Nb2C monolayer has excellent performance in the case of Li or Mg: the material remains metallic after adsorption; the ion diffusion is fast with extremely low diffusion barrier; the storage capacity is high (∼542 mA h g−1 for Li and ∼1084 mA h g−1 for Mg); and the average intercalation potential is relatively low. Particularly, the diffusion barrier heights for the elements Li, Na, K, Mg and Ca are all lower than 0.1 eV. In addition, the functional groups tend to strongly degrade the performance, which should be avoided in experiment as much as possible. Our results suggest that the Nb2C monolayer is a promising anode material for Li- or non-Li-ion batteries.
1 Introduction
From portable electronic devices to electric vehicles and to large-scale power grid systems, energy storage has become an essential technology for our daily life. Among all kinds of energy storage systems, secondary batteries have the important advantages of high efficiency and compactness.1–3 As the most prominent example, Li-ion batteries (LIBs) have undergone rapid development since their first commercialization by Sony in 1991. Nevertheless, currently the development of LIBs has been hampered by cost and safety issues.4 With the increasing usage of LIBs, the lack of lithium sources also emerges as one major challenge. Therefore, non-Li-ion batteries, in which Li is substituted by other metal species, are being actively explored. Particularly, Na-ion batteries (NIBs) have received a lot of attention because Na is much more abundant and cheaper than lithium.5,6 Beyond NIBs, batteries with other alkali (such as K)7,8 or multivalent metal ions (Mg,9,10 Ca,11 and Al12) have also been investigated. For developing all these various secondary batteries, a critical problem is to search for suitable electrode materials to optimize the battery performance.Since the discovery of graphene, the novel properties and wide applications of two-dimensional (2D) layered materials have attracted tremendous interest. 2D materials such as graphene, phosphorene and dichalcogenides (such as NbSe2 and MoS2)13–15 have been investigated as electrode materials for LIBs,16–22 and the MoS2/graphene 2D composite has also been tested as anode materials for NIBs.23 Recently, a new family of 2D materials, the early transition-metal carbides and carbonitrides (Mn+1Xn, n = 1, 2, 3; X = C or N), known as “MXenes”, have attracted more and more attention in research. MXenes are typically synthesized from the MAX precursors (A represents one of the A group elements such as Al), which include more than 60 phases. One of the MXenes, Ti3C2, was first synthesized by Naguib et al.24–27 by selectively etching the Al layers from Ti3AlC2 with hydrofluoric acid (HF). To date, many other MXenes have also been successfully synthesized, such as Ti3CN, Ti2C, (V0.5Cr0.5)3C2, (Ti0.5Nb0.5)2C, Nb2C, V2C and Ta4C3, etc.25–29
With more MXenes being realized, their properties have been actively studied.30–34 It has been shown that these materials could have great potential for energy storage applications. For instance, Zhou et al.35 proposed that monolayer Ti3C2 and its derivatives are promising anode materials for LIBs using first-principles calculations. Naguib et al. theoretically predicted that Ti2C, (Ti0.5Nb0.5)2C, Ti3(C0.5N0.5), Ti3CN, TiNbC, Nb2C and Ta4C3 are all suitable electrode materials for LIBs.36,37 Gogotsi et al. demonstrated that 2D Ti3C2 MXene layers could be spontaneously intercalated by Na+, K+, NH4+, Mg2+ and Al3+ ions.38 They also performed calculations and showed that the MXene nanosheet could be utilized as anodes for non-Li-ion batteries.39
In recent experiments, two new kinds of MXenes (V2C, Nb2C) have been successfully synthesized for the first time by treating their corresponding MAX phases (V2AlC, Nb2AlC) in aqueous HF.40 Preliminary experimental studies demonstrated that for V2C-based electrodes, reversible capacities of 260 mA h g−1 at 1C and 125 mA h g−1 at 10C could be achieved; while for Nb2C-based electrodes, 170 mA h g−1 at 1C and 110 mA h g−1 at 10C were obtained. The measured Li specific capacities are not high enough as expected. For V2C, later on, it was clarified that the high capacity of bare V2C might be decreased largely by the functional groups which remain after synthesis.41 Whether a similar scenario also occurs in the case of Nb2C is currently not fully understood. In addition, it is worth noting that from low to high charge–discharge rates the capacity of Nb2C-based electrodes decreases much slower than the V2C-based electrodes, implying a much faster ion diffusion for Nb2C. Furthermore, since Nb belongs to the 4d transition metals, the electronic correlation effects could strongly affect the material's chemical and physical properties. All these interesting observations call for a detailed theoretical study to fully investigate the properties of Nb2C-based 2D materials.
Motivated by the reasons stated above, in this paper, we systematically investigate the electronic and metal ion storage properties of the Nb2C monolayer and its fluorinated and hydroxylated derivatives as anode materials based on first-principles calculations. We determine the structural and electronic properties of the materials before and after adsorption. The adsorption and diffusion of different metal species A (A = Li, Na, K, Be, Mg, Ca, Al) are studied. We find that the bare Nb2C monolayer has very good performance as an anode material. Especially, its surface diffusion barrier heights for various ions are all below 0.1 eV which is among the lowest of all the existing 2D materials discovered to date, indicating a very fast ion diffusion. We also show that the bare Nb2C monolayer is metallic before and after adsorption, with a very high specific Mg capacity (∼1084 mA h g−1) as well as a high Li capacity (∼542 mA h g−1). The functional groups greatly reduce the Li or non-Li storage capacities, which should be avoided in experiment as much as possible.
2 Computational details
Our calculations are based on density functional theory (DFT) using the plane-wave pseudopotentials42 with the Perdew–Burke–Ernzerhof (PBE)43,44 form of exchange–correlation functionals as implemented in the Vienna Ab initio Simulation Package (VASP).45 A cutoff energy of 600 eV is employed for the plane wave expansion. Considering the strong correlation effects in niobium element, electronic structure calculations and structural relaxations are performed by using a GGA plus Hubbard U (GGA+U)46,47 method. The U value of the Nb atom is set to be 6.5 eV.48 The Brillouin zone is sampled with 6 × 6 × 1 Monkhorst–Pack k-point mesh49 for the structural optimization, and with 12 × 12 × 1 mesh for the electronic structure calculations. The convergence criteria for the total energy and ionic forces were set to be 10−4 eV and 0.001 eV Å−1, respectively.Possible spin polarization is carefully tested and no spin-polarization effect is observed in our calculation. In addition, concerning the spin–orbital coupling (SOC) effects, we have compared the electronic structures of Nb2C monolayer with and without SOC in our calculations. Results show that the SOC effect has little effect on the band structure. Therefore, in the following calculations we do not include the SOC effect.
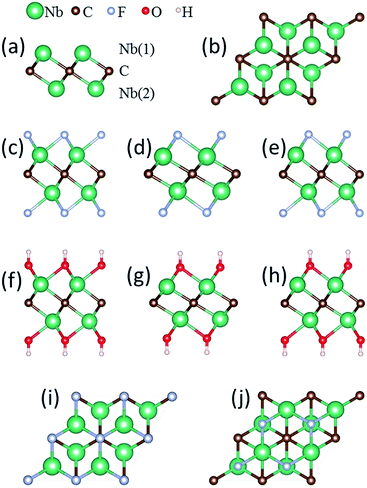
The atomic model of the free-standing Nb2C sheet constructed based on the Nb2AlC structure is used as the initial configuration for geometry optimization. Each bare Nb2C monolayer consists of a triple-layer stacked in the sequence of Nb(1)–C–Nb(2), which can be viewed as two Nb-atomic layers being cleaved with one C-atomic layer, forming edge-shared Nb2C octahedra [Fig. 1(a)]. For the study of metal ion adsorption and diffusion on Nb2C and Nb2CX2 (X = F, OH) monolayers, a 4 × 4 supercell containing 32 Nb and 16 C atoms is employed in our calculations. A 2 × 2 supercell is utilized for the study of structural and electronic properties, average open circuit voltage, and storage capacity.
3 Results and discussion
3.1 Structural and electronic properties of Nb2C and Nb2CX2 (X = F, OH) monolayers
We first address the optimized crystal structures and the electronic properties of monolayer Nb2C as well as its fluorinated and hydroxylated derivatives [denoted as Nb2CF2 and Nb2C(OH)2, respectively]. For a 2 × 2 supercell of the bare Nb2C monolayer, the optimized lattice parameters are listed in Table 1. The vertical distance between Nb(1)-layer and Nb(2)-layer, i.e., the thickness of the monolayer, is 2.468 Å. The Nb(1)–C bond length is 2.198 Å, the same as that of the Nb(2)–C bond.| Parameter | Bond length | Thickness | ||
|---|---|---|---|---|
| a, b | Nb(1)–C/Nb(2)–C | Nb(1)–F/O/Nb(2)–F/O | Monolayer | |
| Nb2C | 6.302 | 2.198/2.198 | 2.468 | |
| I-Nb2CF2 | 6.526 | 2.188/2.188 | 2.335/2.335 | 4.984 |
| II-Nb2CF2 | 6.100 | 2.227/2.227 | 2.270/2.270 | 5.592 |
| III-Nb2CF2 | 6.200 | 2.250/2.164 | 2.289/2.326 | 5.492 |
| I-Nb2C(OH)2 | 6.500 | 2.197/2.197 | 2.231/2.231 | 6.979 |
| II-Nb2C(OH)2 | 6.176 | 2.237/2.237 | 2.261/2.261 | 7.435 |
| III-Nb2C(OH)2 | 6.280 | 2.255/2.174 | 2.275/2.322 | 7.326 |
The Nb2CF2 and Nb2C(OH)2 sheets are constructed by saturating the surface under-coordinated Nb atoms with F and OH, respectively. Three possible configurations are considered: type I: the F or OH groups are above the vertical site of each C atom on both sides of the Nb2C monolayer [see Fig. 1(c) and (f)]; type II: the F or OH groups are located above each hollow site formed by three neighboring C atoms on both sides of the Nb2C monolayer [see Fig. 1(d) and (g)]; type III: a mixture of type I and II, in which the F or OH groups are located above the vertical sites of three C atoms on one side while above the hollow sites of C atoms on the other side, forming different layouts on the two sides of the Nb2C monolayer [see Fig. 1(e) and (h)]. The optimized lattice parameters for each type of configuration are shown in Table 1.
The relative structural stability of the three types of configurations for Nb2CF2 and Nb2C(OH)2 can be determined by comparing their total energies. The results show that the type I configuration is energetically the most favorable for both Nb2CF2 and Nb2C(OH)2. Specifically, the total energy of I-Nb2CF2 (denoting the type I structure) is lower than that of II-Nb2CF2 and III-Nb2CF2 by about 0.17 and 0.55 eV per unit cell, respectively. Also, the energy of I-Nb2C(OH)2 is lower than that of II-Nb2C(OH)2 and III-Nb2C(OH)2 by about 0.24 and 0.51 eV per unit cell, respectively. This indicates that both F and OH groups prefer to stay at the top sites of C atoms, rather than staying at the hollow sites. It is also worth noting that for both derivatives, their type I structures have the largest lattice parameter and the thinnest layer thickness.
In order to be utilized as battery electrode materials, it is desirable for the material to be metallic. Fig. 2 shows the total density of states (DOS) of Nb2C, Nb2CF2 and Nb2C(OH)2 monolayers. For bare Nb2C, the resulting DOS in Fig. 2(a) indicates that it is metallic, which is in agreement with previous work.50 We find that when Nb2C is passivated by F or OH, the generated Nb2CF2 or Nb2C(OH)2 monolayers still maintain metallic properties regardless of the specific adsorption configurations [see Fig. 2(b)–(g)]. This hence indicates that the bare Nb2C monolayer and its fluorinated and hydroxylated derivatives all satisfy the requirement of being metallic for electrode materials. Fig. 2(a) also shows that the C atoms have almost no contribution to states near the Fermi level, namely, the low-energy carriers are originated from Nb atoms. We note that neglecting the correlation effect on Nb atoms would lead to insulating phases for the two derivatives,40 which indicates the importance of electronic correlation effects in the current system. Due to the above analysis, we will mainly focus on the most stable structures, i.e. the type I structures for the two derivatives Nb2CF2 and Nb2C(OH)2 in the following investigations.
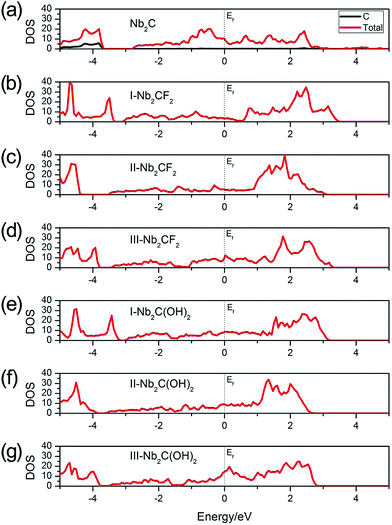 | ||
| Fig. 2 Total DOS of (a) Nb2C, (b) I-Nb2CF2, (c) II-Nb2CF2, (d) III-Nb2CF2, (e) I-Nb2C(OH)2, (f) II-Nb2C(OH)2 and (g) III-Nb2C(OH)2. The Fermi levels are set to zero. | ||
3.2 Metal atom adsorption on Nb2C and on Nb2CX2 (X = F, OH) monolayers
Since the Nb2C monolayer and its fluorinated or hydroxylated derivatives are all metallic, in the following, we explore the possibility of these materials to be utilized as electrode materials for Li- and non-Li-ion batteries by investigating their adsorption of the metal species A (A = Li, Na, K, Be, Mg, Ca, Al). To this end, the first step is to analyze the adsorption energy and to determine the most favorable adsorption site. Herein, a 4 × 4 supercell is used to study the adsorption of one A atom on the surface, corresponding to the chemical stoichiometries of Nb32C16A, Nb32C16F32A and Nb32C16(OH)32A, respectively, for the three materials. Three different adsorption sites with high symmetry are considered in our calculations: (i) top site of C atom (which is above the F atom for I-Nb2CF2, and above the OH group for I-Nb2C(OH)2); (ii) top site of Nb(1) atom; (iii) top site of Nb(2) atom.Here, the adsorption energy (Ead) of an A atom on the monolayer is defined as:
| Ead = ENb32C16X32A(X=□,F,OH) − ENb32C16X32(X=□,F,OH) − EA, | (1) |
A negative value of Ead indicates that the corresponding atom A prefers to adsorb on the monolayer, instead of forming a metal cluster. The adsorption energies calculated for different adsorption sites are plotted in Fig. 3. One observes that for I-Nb2CF2, only Na and K can adsorb on the monolayer (for Na, only the top site of Nb(2) works), while other adatoms tend to form metal clusters by themselves. For I-Nb2C(OH)2, all the adsorption energies are positive indicating that none of the atoms can get adsorbed. Therefore the presence of F/OH groups on the surface would significantly degrade the storage capacity of Nb2C. This is similar to the cases of other MXene materials.35,41
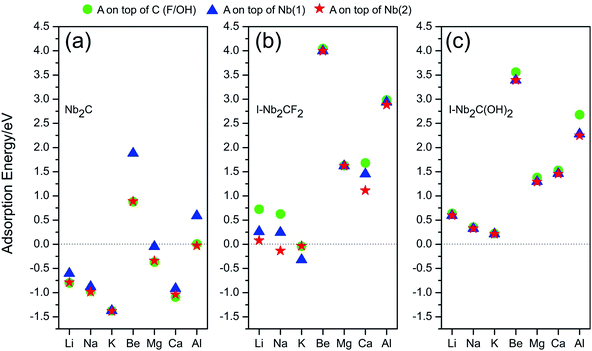 | ||
| Fig. 3 Adsorption energies for atom species A (A = Li, Na, K, Be, Mg, Ca, Al) on (a) Nb2C, (b) I-Nb2CF2 and (c) I-Nb2C(OH)2 at different adsorption sites. | ||
Fortunately, for the bare Nb2C monolayer, almost all the adatoms prefer to adsorb on its surface as indicated by the negative adsorption energy values in Fig. 3(a), except for Be and Al which have relatively small Ead. The result indicates that the bare Nb2C monolayer possesses the possibility to be utilized as an electrode material for the A′-ion batteries with (A′ = Li, Na, K, Mg, Ca). Further, by comparing the adsorption energies for different sites, one can determine the most favorable adsorption site for each element. Specifically, the most favorable adsorption sites for Li, Na, K, Mg and Ca are on top of C, Nb(2), Nb(2), C and C, respectively. In the following calculations, we will focus on the adsorption of Li, Na, K, Mg and Ca atoms onto the bare Nb2C monolayer.
We next present the optimized structures for A′-adsorbed Nb2C monolayers (A′ = Li, Na, K, Mg, Ca). As shown in Fig. 4, for the cases of Na- and K-adsorption, the distances along the c-axis between Nb(2) and Na/K (or between C and Na/K) are 5.209/5.620 Å (or 3.978/4.391 Å), respectively. The adsorption height of K is larger than that of Na. For Li-, Mg- and Ca-adsorbed configurations, the distances along the c-axis between C and Li/Mg/Ca are 3.677/3.678/3.981 Å, respectively. To further investigate the charge transfer during the adsorption process, we carry out the Bader charge analysis. The results are listed in Table 2. One can see that in general the adatoms lose electrons, which are mostly transferred to the C atoms in the layer. To be specific, the Li atom transfers about 0.84e to the bare Nb2C monolayer, and the transferred charges for Na/K/Mg/Ca are about 0.68/0.68/0.69/0.94e, respectively. This indicates that the atoms are chemically adsorbed on Nb2C and they form chemical compounds, corresponding to the redox reaction similar to other electrode materials.
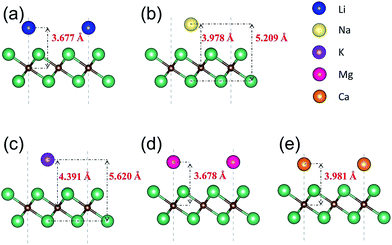 | ||
| Fig. 4 Side views of the optimized structures of Nb2C monolayers after adsorption with (a) Li, (b) Na, (c) K, (d) Mg and (e) Ca. | ||
| Average charge state | |||
|---|---|---|---|
| Nb | C | A′ | |
| Nb2C | 11.91 | 6.18 | |
| Nb2C + Li | 12.02 | 6.18 | 0.16 |
| Nb2C + Na | 11.99 | 6.18 | 0.32 |
| Nb2C + K | 11.99 | 6.18 | 8.32 |
| Nb2C + Mg | 12.00 | 6.17 | 1.31 |
| Nb2C + Ca | 12.03 | 6.17 | 9.06 |
After adsorption, whether the monolayer would maintain a metallic character or become an insulator is important for its electrode performance. To answer this question, we calculate the total DOS of the A′-adsorbed Nb2C monolayer. The results are shown in Fig. 5. We can see that, as desired for a good electrode material, the system remains metallic after adsorption with any kind of the A′ atoms (A′ = Li, Na, K, Mg, Ca).
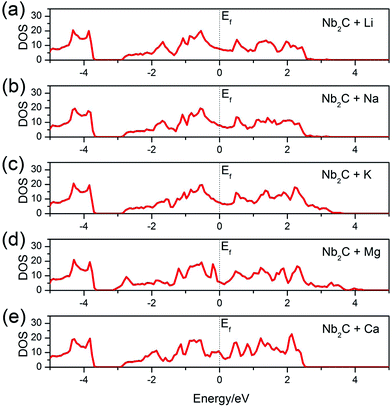 | ||
| Fig. 5 Total DOS of the bare Nb2C monolayer after (a) Li, (b) Na, (c) K, (d) Mg and (e) Ca adsorption. The dotted vertical lines denote the Fermi levels. | ||
3.3 Ion diffusion on Nb2C monolayer
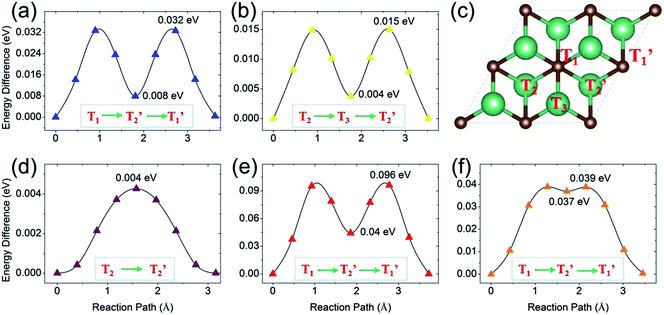
Next, we turn to study the ion diffusion of A′ (A′ = Li, Na, K, Mg, Ca) on the surface of the Nb2C monolayer. The climbing-image nudged elastic band (NEB) method51 is used to seek the saddle points and the minimum energy path and to determine the diffusion barrier height. The most stable adsorption configuration (which is determined for each atom species in the previous section) is taken as the initial state. The configurations with A′ adsorption at the nearest-neighboring most stable site is chosen to be the final state. Fig. 6 shows the calculated diffusion energy profiles and the corresponding migration pathways. Our results show that the diffusion barriers are 0.032 eV (for Li), 0.015 eV (for Na), 0.004 eV (for K), 0.096 eV (for Mg) and 0.039 eV (for Ca), respectively. These low energy barriers indicate fast ion diffusion. For Li, Mg and Ca [Fig. 6(a), (e) and (f)], the diffusion paths are almost the same, from the T1 site to the neighboring T1′ site passing through the T2′ site [see Fig. 6(c)]. These paths clearly show two saddle points. For Na and K, their diffusion paths are from T2 to T2′. The path for Na has two saddle points and it passes through the T3 site. Meanwhile, one observes that the path for K goes from T2 to T2′ almost directly with only one saddle point located, which might be due to its very small barrier height (0.004 eV). Overall, the diffusion barrier heights are very low, indicating that all the A′ atoms could have fast diffusion on the surface of the Nb2C monolayer, which is advantageous for applications as electrode materials.We stress that all these diffusion barrier heights are less than 0.1 eV, which are among the lowest of the available anode materials. For example, in terms of diffusion barrier heights, we have for Ti3C2 (0.068 eV for Li,3,35 0.096 eV for Na, 0.103 eV for K and 0.118 eV for Ca3), silicene (0.28 eV for Li,52 0.25 eV for Na,53 0.11 eV for K54), graphene55,56 (>0.3 eV for Li, ∼0.10 eV for Na, K, Mg, Ca, Al57,58), phosphorene (0.13–0.76 eV for Li,59,60 0.04 eV for Na,61 0.30 eV for Mg and 0.69 eV for Al62), Mo2S (0.21 eV for Li,21 0.28 eV for Na,63 0.48 eV for Mg64), TiO2-based polymorphs (0.3–0.65 eV for Li,65,66 0.4 eV for Na67), and the commercialized graphite (0.2–0.4 eV for Li68). All these are larger than the corresponding values of Nb2C.
Experimentally it has been found that the reversible capacities of the Nb2C-based electrode are 170 and 110 mA h g−1 obtained at 1C and 10C respectively, while for V2C-based electrode, the two values are 260 and 125 mA h g−1 respectively.40 The reversible capacity of Nb2C-based electrodes is 65% of that of V2C-based electrode at 1C, and this percentage is increased to 88% at 10C. According to our results above, the experimental observation might be attributed to the faster Li diffusion on Nb2C surface than on V2C surface (barrier height ∼ 0.045 eV for V2C41).
3.4 Average open circuit voltage and storage capacity of Nb2C monolayer
The average open circuit voltage and the storage capacity are important characteristics for battery electrode materials. To estimate the maximum possible capacity for A′ atom adsorption, we still employ the 2 × 2 supercell and increase concentration of A′ atoms adsorbed on both sides of the host Nb2C monolayer. Here we assume the following half-cell reaction vs. A′/A′+:69,70| Nb2C + xA′y+ + xye− ↔ Nb2CA′x. | (2) |
The difference in total energies before and after A′ intercalation is used to determine the average open circuit voltage. The volume and entropy effects are usually negligible during the reaction. The average open circuit voltage can be approximately computed from the energy difference:
| Vave = (ENb2C + xEA′ − ENb2CA′x)/xye | (3) |
We first take the Li case as an example to demonstrate the calculation of the average open circuit voltage and the storage capacity. In this case, the adsorption sites of the first Li layer are at the top sites of C atoms, because they correspond to the most stable sites for Li adsorption onto the bare Nb2C monolayer. From symmetry, the Li layer could form on both sides of the Nb2C monolayer. After the first-layer adsorption, the second layer Li atoms are adsorbed on the top sites of Nb(2) atoms (also on both sides). To evaluate the interaction between the host material and the Li layers, we calculate the layer-resolved average adsorption energy (Enave) of Li atoms in the n-th layer, which is defined as
| Enave = (ENb8C4Lin×8 − ENb8C4Li(n−1)×8 − 8ELi)/8, | (4) |
For the rest of A′ atoms, namely Na, K, Mg and Ca atoms, we perform the calculations following the procedures described above. For Na and K, their chemical valences are both +1. We find that one supercell could accommodate up to 8 Na atoms and 4 K atoms, respectively. The corresponding chemical stoichiometries are Nb2CNa2 and Nb2CK1. The calculated average open circuit voltages and their corresponding theoretical specific capacities are 0.27 V and 271 mA h g−1 for Nb2CNa2, and 0.29 V and 136 mA h g−1 for Nb2CK1. As for Mg and Ca, their chemical valences are both +2. We find the bare Nb2C supercell could accommodate up to 16 (two layers) Mg atoms but only 4 Ca atoms, respectively, with corresponding chemical stoichiometries Nb2CMg4 and Nb2CCa1. The calculated average open circuit voltages and their corresponding theoretical specific capacities are 0.18 V and 1084 mA h g−1 for Nb2CMg4, and 0.06 V and 271 mA h g−1 for Nb2CCa1. We note that although Nb2C shows a fairly good capacity for Ca, when further considering the solid electrolyte interface (SEI) formation, due to the very low average open circuit voltage (0.06 V) for Nb2CCa1, the bare Nb2C might not be a suitable anode material for Ca-ion batteries.
Typically the experimental samples would be a mixture of monolayer, few-layer, and even bulk materials. From experiment, it is observed that the interlayer distance is around 4 Å, which limits the amount of ions intercalated between the layers (and also decreases the diffusion efficiency). Therefore, to enhance the performance, appropriate methods need to be developed to decrease the thickness and to expose more surface area of the material.
From the above discussion, concerning the average open circuit voltage and the specific capacity, the bare Nb2C monolayer is most suitable for anode materials of Li-ion and Mg-ion batteries.
4 Conclusions
In summary, we have studied the electronic properties and Li or non-Li storage capabilities of monolayer Nb2C and its fluoride and hydroxide materials. We find that the Nb2C monolayer and its derived Nb2CF2 and Nb2C(OH)2 in their the most stable configurations are all metallic before and after metal atom adsorption, which is the desired property of battery electrode materials. Among all the searched secondary batteries, the bare Nb2C monolayer is most suitable as anode materials for Li-ion and Mg-ion batteries. It shows fast ion diffusion with very low diffusion barrier heights (<0.1 eV) and high storage capacities (with theoretical value 542 mA h g−1 for Li and 1084 mA h g−1 for Mg). In addition, we find that the functional groups tend to reduce the Li or non-Li capacity almost completely, which needs be avoided in experiment as much as possible. Moreover, the average intercalation potentials for Nb2C-based materials are also found to be relatively low. Our results suggest that 2D Nb2C is a promising anode material for Li- and non-Li-ion batteries.Acknowledgements
This work was supported by SUTD-SRG-EPD2013062, the NSFC (Grant No. 11135001 and 11264014). The computations were performed on Texas Advanced Computing Center (TACC) of the University of Texas at Austin.References
- B. Dunn, H. Kamath and J.-M. Tarascon, Science, 2011, 334, 928–935 CrossRef CAS PubMed.
- H. Chen, T. N. Cong, W. Yang, C. Tan, Y. Li and Y. Ding, Nat. Sci., 2009, 19, 291–312 CAS.
- D. Er, J. Li, M. Naguib, Y. Gogotsi and V. B. Shenoy, ACS Appl. Mater. Interfaces, 2014, 6, 11173–11179 CAS.
- J. B. Goodenough and Y. Kim, Chem. Mater., 2010, 22, 587–603 CrossRef CAS.
- M. D. Slater, D. Kim, E. Lee and C. S. Johnson, Adv. Funct. Mater., 2013, 23, 947–958 CrossRef CAS.
- H. Pan, Y.-S. Hu and L. Q. Chen, Energy Environ. Sci., 2013, 6, 2338–2360 CAS.
- A. Eftekhari, J. Power Sources, 2004, 126, 221–228 CrossRef CAS.
- C. D. Wessells, S. V. Peddada, R. A. Huggins and Y. Cui, Nano Lett., 2011, 11, 5421–5425 CrossRef CAS PubMed.
- N. Singh, T. S. Arthur, C. Ling, M. Matsui and F. Mizuno, Chem. Commun., 2013, 49, 149–151 RSC.
- T. Ichitsubo, T. Adachi, S. Yagi and T. Doi, J. Mater. Chem., 2011, 21, 11764–11772 RSC.
- D. Datta, J. Li and V. B. Shenoy, ACS Appl. Mater. Interfaces, 2014, 6, 1788–1795 CAS.
- S. Liu, J. J. Hu, N. F. Yan, G. L. Pan, G. R. Li and X. P. Gao, Energy Environ. Sci., 2012, 5, 9743–9746 CAS.
- S. Jeong, D. Yoo, J. T. Jang, M. Kim and J. Cheon, J. Am. Chem. Soc., 2012, 134, 18233–18236 CrossRef CAS PubMed.
- K. G. Zhou, N. N. Mao, H. X. Wang, Y. Peng and H. L. Zhang, Angew. Chem., Int. Ed., 2011, 50, 10839–10842 CrossRef CAS PubMed.
- Z. Y. Zeng, Z. Y. Yin, X. Huang, H. Li, Q. Y. He, G. Lu, F. Boey and H. Zhang, Angew. Chem., Int. Ed., 2011, 50, 11093–11097 CrossRef CAS PubMed.
- M. Chhowalla, H. S. Shin, G. Eda, L.-J. Li, K. P. Loh and H. Zhang, Nat. Chem., 2013, 5, 263–275 CrossRef PubMed.
- X. Zhao, C. M. Hayner, M. C. Kung and H. H. Kung, ACS Nano, 2011, 5, 8739–8749 CrossRef CAS PubMed.
- J. Xiao, D. Choi, L. Cosimbescu, P. Koech, J. Liu and J. P. Lemmon, Chem. Mater., 2010, 22, 4522–4524 CrossRef CAS.
- Y. Jing, Z. Zhou, C. R. Cabrera and Z. Chen, J. Mater. Chem. A, 2014, 2, 12104–12122 CAS.
- Q. Tang and Z. Zhou, Prog. Mater. Sci., 2013, 58, 1244–1315 CrossRef CAS.
- Y. Li, D. Wu, Z. Zhou, C. R. Cabrera and Z. Chen, J. Phys. Chem. Lett., 2012, 3, 2221–2227 CrossRef CAS PubMed.
- Y. Jing, Z. Zhou, C. R. Cabrera and Z. Chen, J. Phys. Chem. C, 2013, 117, 25409–25413 CAS.
- L. David, R. Bhandavat and G. Singh, ACS Nano, 2014, 8, 1759–1770 CrossRef CAS PubMed.
- M. Naguib, M. Kurtoglu, V. Presser, J. Lu, J. J. Niu, M. Heon, L. Hultman, Y. Gogotsi and M. W. Barsoum, Adv. Mater., 2011, 23, 4248–4253 CrossRef CAS PubMed.
- M. Naguib, V. N. Mochalin, M. W. Barsoum and Y. Gogotsi, Adv. Mater., 2014, 26, 992–1005 CrossRef CAS PubMed.
- O. Mashtalir, M. Naguib, V. N. Mochalin, Y. Dall'Agnese, M. Heon, M. W. Barsoum and Y. Gogotsi, Nat. Commun., 2013, 4, 1716–7 CrossRef PubMed.
- M. Naguib, V. Presser, D. Tallman, J. Lu, L. Hultman, Y. Gogotsi and M. W. Barsoum, J. Am. Ceram. Soc., 2011, 94, 4556–4561 CrossRef CAS.
- M. Naguib, O. Mashtalir, J. Carle, V. Presser, J. Lu, L. Hultman, Y. Gogotsi and M. W. Barsoum, ACS Nano, 2012, 6, 1322–1331 CrossRef CAS PubMed.
- O. Mashtalir, M. Naguib, B. Dyatkin, Y. Gogotsi and M. W. Barsoum, Mater. Chem. Phys., 2013, 139, 147–152 CrossRef CAS.
- M. Kurtoglu, M. Naguib, Y. Gogotsi and M. W. Barsoum, MRS Commun., 2012, 2, 133–137 CrossRef CAS.
- I. R. Shein and A. L. Ivanovskii, Comput. Mater. Sci., 2012, 65, 104–114 CrossRef CAS.
- A. N. Enyashin and A. L. Ivanovskii, J. Solid State Chem., 2013, 207, 42–48 CrossRef CAS.
- A. N. Enyashin and A. L. Ivanovskii, J. Phys. Chem. C, 2013, 117, 13637–13643 CAS.
- A. N. Enyashin and A. L. Ivanovskii, Comput. Theor. Chem., 2012, 989, 27–32 CrossRef CAS.
- Q. Tang, Z. Zhou and P. Shen, J. Am. Chem. Soc., 2012, 134, 16909–16916 CrossRef CAS PubMed.
- J. Come, M. Naguib, P. Rozier, M. W. Barsoum, Y. Gogotsi, P. L. Taberna, M. Morcrette and P. Simon, J. Electrochem. Soc., 2012, 159, A1368–A1373 CrossRef CAS.
- M. Naguib, J. Come, B. Dyatkin, V. Presser, P.-L. Taberna, P. Simon, M. W. Barsoum and Y. Gogotsi, Electrochem. Commun., 2012, 16, 61–64 CrossRef CAS.
- M. R. Lukatskaya, O. Mashtalir, C. E. Ren, Y. Dall'Agnese, P. Rozier, P. L. Taberna, M. Naguib, P. Simon, M. W. Barsoum and Y. Gogotsi, Science, 2013, 341, 1502–1505 CrossRef CAS PubMed.
- Y. Xie, Y. Dall'Agnese, M. Naguib, Y. Gogotsi, M. W. Barsoum, H. L. Zhuang and P. R. Kent, ACS Nano, 2014, 8, 9606–9615 CrossRef CAS PubMed.
- M. Naguib, J. Halim, J. Lu, K. M. Cook, L. Hultman, Y. Gogotsi and M. W. Barsoum, J. Am. Chem. Soc., 2013, 135, 15966–15969 CrossRef CAS PubMed.
- J. P. Hu, B. Xu, C. Y. Ouyang, S. Y. A. Yang and Y. G. Yao, J. Phys. Chem. C, 2014, 118, 24274–24281 CAS.
- J. Ihm, A. Zunger and M. L. Cohen, J. Phys. C: Solid State Phys., 1979, 12, 4409–4421 CrossRef CAS.
- J. P. Perdew, K. Burke and M. Ernzerhof, Phys. Rev. Lett., 1996, 77, 3865–3868 CrossRef CAS PubMed.
- G. Kresse and D. Joubert, Phys. Rev. B: Condens. Matter, 1999, 59, 1758–1775 CrossRef CAS.
- G. Kresse and J. Furthmĺźller, Phys. Rev. B: Condens. Matter, 1996, 54, 11169–11186 CrossRef CAS.
- V. I. Anisimov, I. V. Solovyev and M. A. Korotin, Phys. Rev. B: Condens. Matter, 1993, 48, 16929–16934 CrossRef CAS.
- V. I. Anisimov, F. Aryasetiawan and A. I. Lichtenstein, J. Phys.: Condens. Matter, 1997, 9, 767–808 CrossRef CAS.
- H. Xu, A. Chernatynskiy, D. Lee, S. B. Sinnott, V. Gopalan, V. Dierolf and S. R. Phillpot, Phys. Rev. B: Condens. Matter Mater. Phys., 2010, 82, 184109 CrossRef.
- H. J. Monkhorst and J. D. Pack, Phys. Rev. B: Solid State, 1976, 13, 5188–5192 CrossRef.
- M. Khazaei, M. Arai, T. Sasaki, C. Y. Chung, N. S. Venkataramanan, M. Estili, Y. Sakka and Y. Kawazoe, Adv. Funct. Mater., 2013, 23, 2185–2192 CrossRef CAS.
- G. Henkelman, B. P. Uberuaga and H. Jónsson, J. Chem. Phys., 2000, 113, 9901–9904 CrossRef CAS.
- J. Setiadi, D. A. Matthew and J. F. Michael, ACS Appl. Mater. Interfaces, 2013, 5, 10690–10695 CAS.
- X. X. Guo, P. Guo, J. M. Zheng, L. K. Cao and P. J. Zhao, Appl. Surf. Sci., 2015, 341, 69–74 CrossRef CAS.
- X. Lin and J. Ni, Phys. Rev. B: Condens. Matter Mater. Phys., 2012, 86, 075440 CrossRef.
- X. Fan, W. T. Zheng and J. L. Kuo, ACS Appl. Mater. Interfaces, 2012, 4, 2432–2438 CAS.
- L. J. Zhou, Z. F. Hou and L. M. Wu, J. Phys. Chem. C, 2012, 116, 21780–21787 CAS.
- C. Ling and F. Mizuno, Phys. Chem. Chem. Phys., 2014, 16, 10419–10424 RSC.
- K. T. Chan, J. B. Neaton and M. L. Cohen, Phys. Rev. B: Condens. Matter Mater. Phys., 2008, 77, 235430 CrossRef.
- G. C. Guo, X. L. Wei, D. Wang, Y. Luo and L. M. Liu, J. Mater. Chem. A, 2015, 3, 11246–11252 CAS.
- S. Zhao, W. Kang and J. Xue, J. Mater. Chem. A, 2014, 2, 19046–19052 CAS.
- V. V. Kulish, O. I. Malyi, C. Persson and P. Wu, Phys. Chem. Chem. Phys., 2015, 17, 13921–13928 RSC.
- T. Hu and J. S. Hong, J. Phys. Chem. C, 2015, 119, 8199–8207 CAS.
- M. Mortazavi, C. Wang, J. Deng, V. B. Shenoy and N. V. Medhekar, J. Power Sources, 2014, 268, 279–286 CrossRef CAS.
- S. Q. Yang, D. X. Li, T. R. Zhang, Z. L. Tao and J. Chen, J. Phys. Chem. C, 2012, 116, 1307–1312 CAS.
- M. V. Koudriachova, N. M. Harrison and S. W. de Leeuw, Phys. Rev. Lett., 2001, 86, 1275 CrossRef CAS PubMed.
- M. Wagemaker, R. van de Krol, A. P. Kentgens, A. A. Van Well and F. M. Mulder, J. Am. Chem. Soc., 2001, 123, 11454–11461 CrossRef CAS PubMed.
- Y. S. Wang, X. Q. Yu, S. Y. Xu, J. M. Bai, R. J. Xiao, Y. S. Hu, H. Li, X. Q. Yang, L. Q. Chen and X. J. Huang, Nat. Commun., 2013, 4, 2365 Search PubMed.
- K. Persson, Y. Hinuma, Y. S. Meng, A. Van der Ven and G. Ceder, Phys. Rev. B: Condens. Matter Mater. Phys., 2010, 82, 125416 CrossRef.
- M. K. Aydinol and G. Ceder, J. Electrochem. Soc., 1997, 144, 3832–3835 CrossRef CAS.
- Y. S. Meng, Energy Environ. Sci., 2009, 2, 589–609 CAS.
| This journal is © The Royal Society of Chemistry 2016 |

